 CAFF - Arctic Biodiversity Data Service (ABDS)
Freshwater
Type of resources
Available actions
Topics
Keywords
Contact for the resource
Provided by
Representation types
Update frequencies
status
Scale
-

Results of circumpolar assessment of river diatoms, indicating (a) the location of river diatom stations, underlain by circumpolar ecoregions; (b) ecoregions with many river diatom stations, colored on the basis of alpha diversity rarefied to 40 stations; (c) all ecoregions with river diatom stations, colored on the basis of alpha diversity rarefied to 10 stations; (d) ecoregions with at least two stations in a hydrobasin, colored on the basis of the dominant component of beta diversity (species turnover, nestedness, approximately equal contribution, or no diversity) when averaged across hydrobasins in each ecoregion. State of the Arctic Freshwater Biodiversity Report - Chapter 4 - Page 36 - Figure 4-8
-

Figure 3-5 Changes in alpha diversity (red line), predator body size (blue dashed line), and ecosystem metabolism (blue solid line) with a shift in glacial cover from high (left) to low (right). Redrawn from Milner et al. (2017). State of the Arctic Freshwater Biodiversity Report - Chapter 3 - Page 22 - Figure 3-5
-

Summary of the taxa accounting for 85% of the river benthic macroinvertebrates collected in each of several highly-sampled geographic areas, with taxa grouped by order level or higher in pie charts placed spatially to indicate sampling area. Pie charts correspond to (1) Alaska, (2) western Canada, (3) southern Canada, south of Hudson Bay, (4) northern Labrador, (5) Baffin Island, (6) Ellesmere Island, (7) Greenland high Arctic, (8) Greenland low Arctic, (9) Iceland, (10) Svalbard, and (11) Fennoscandia. State of the Arctic Freshwater Biodiversity Report - Chapter 4 - Page 70 - Figure 4-34
-
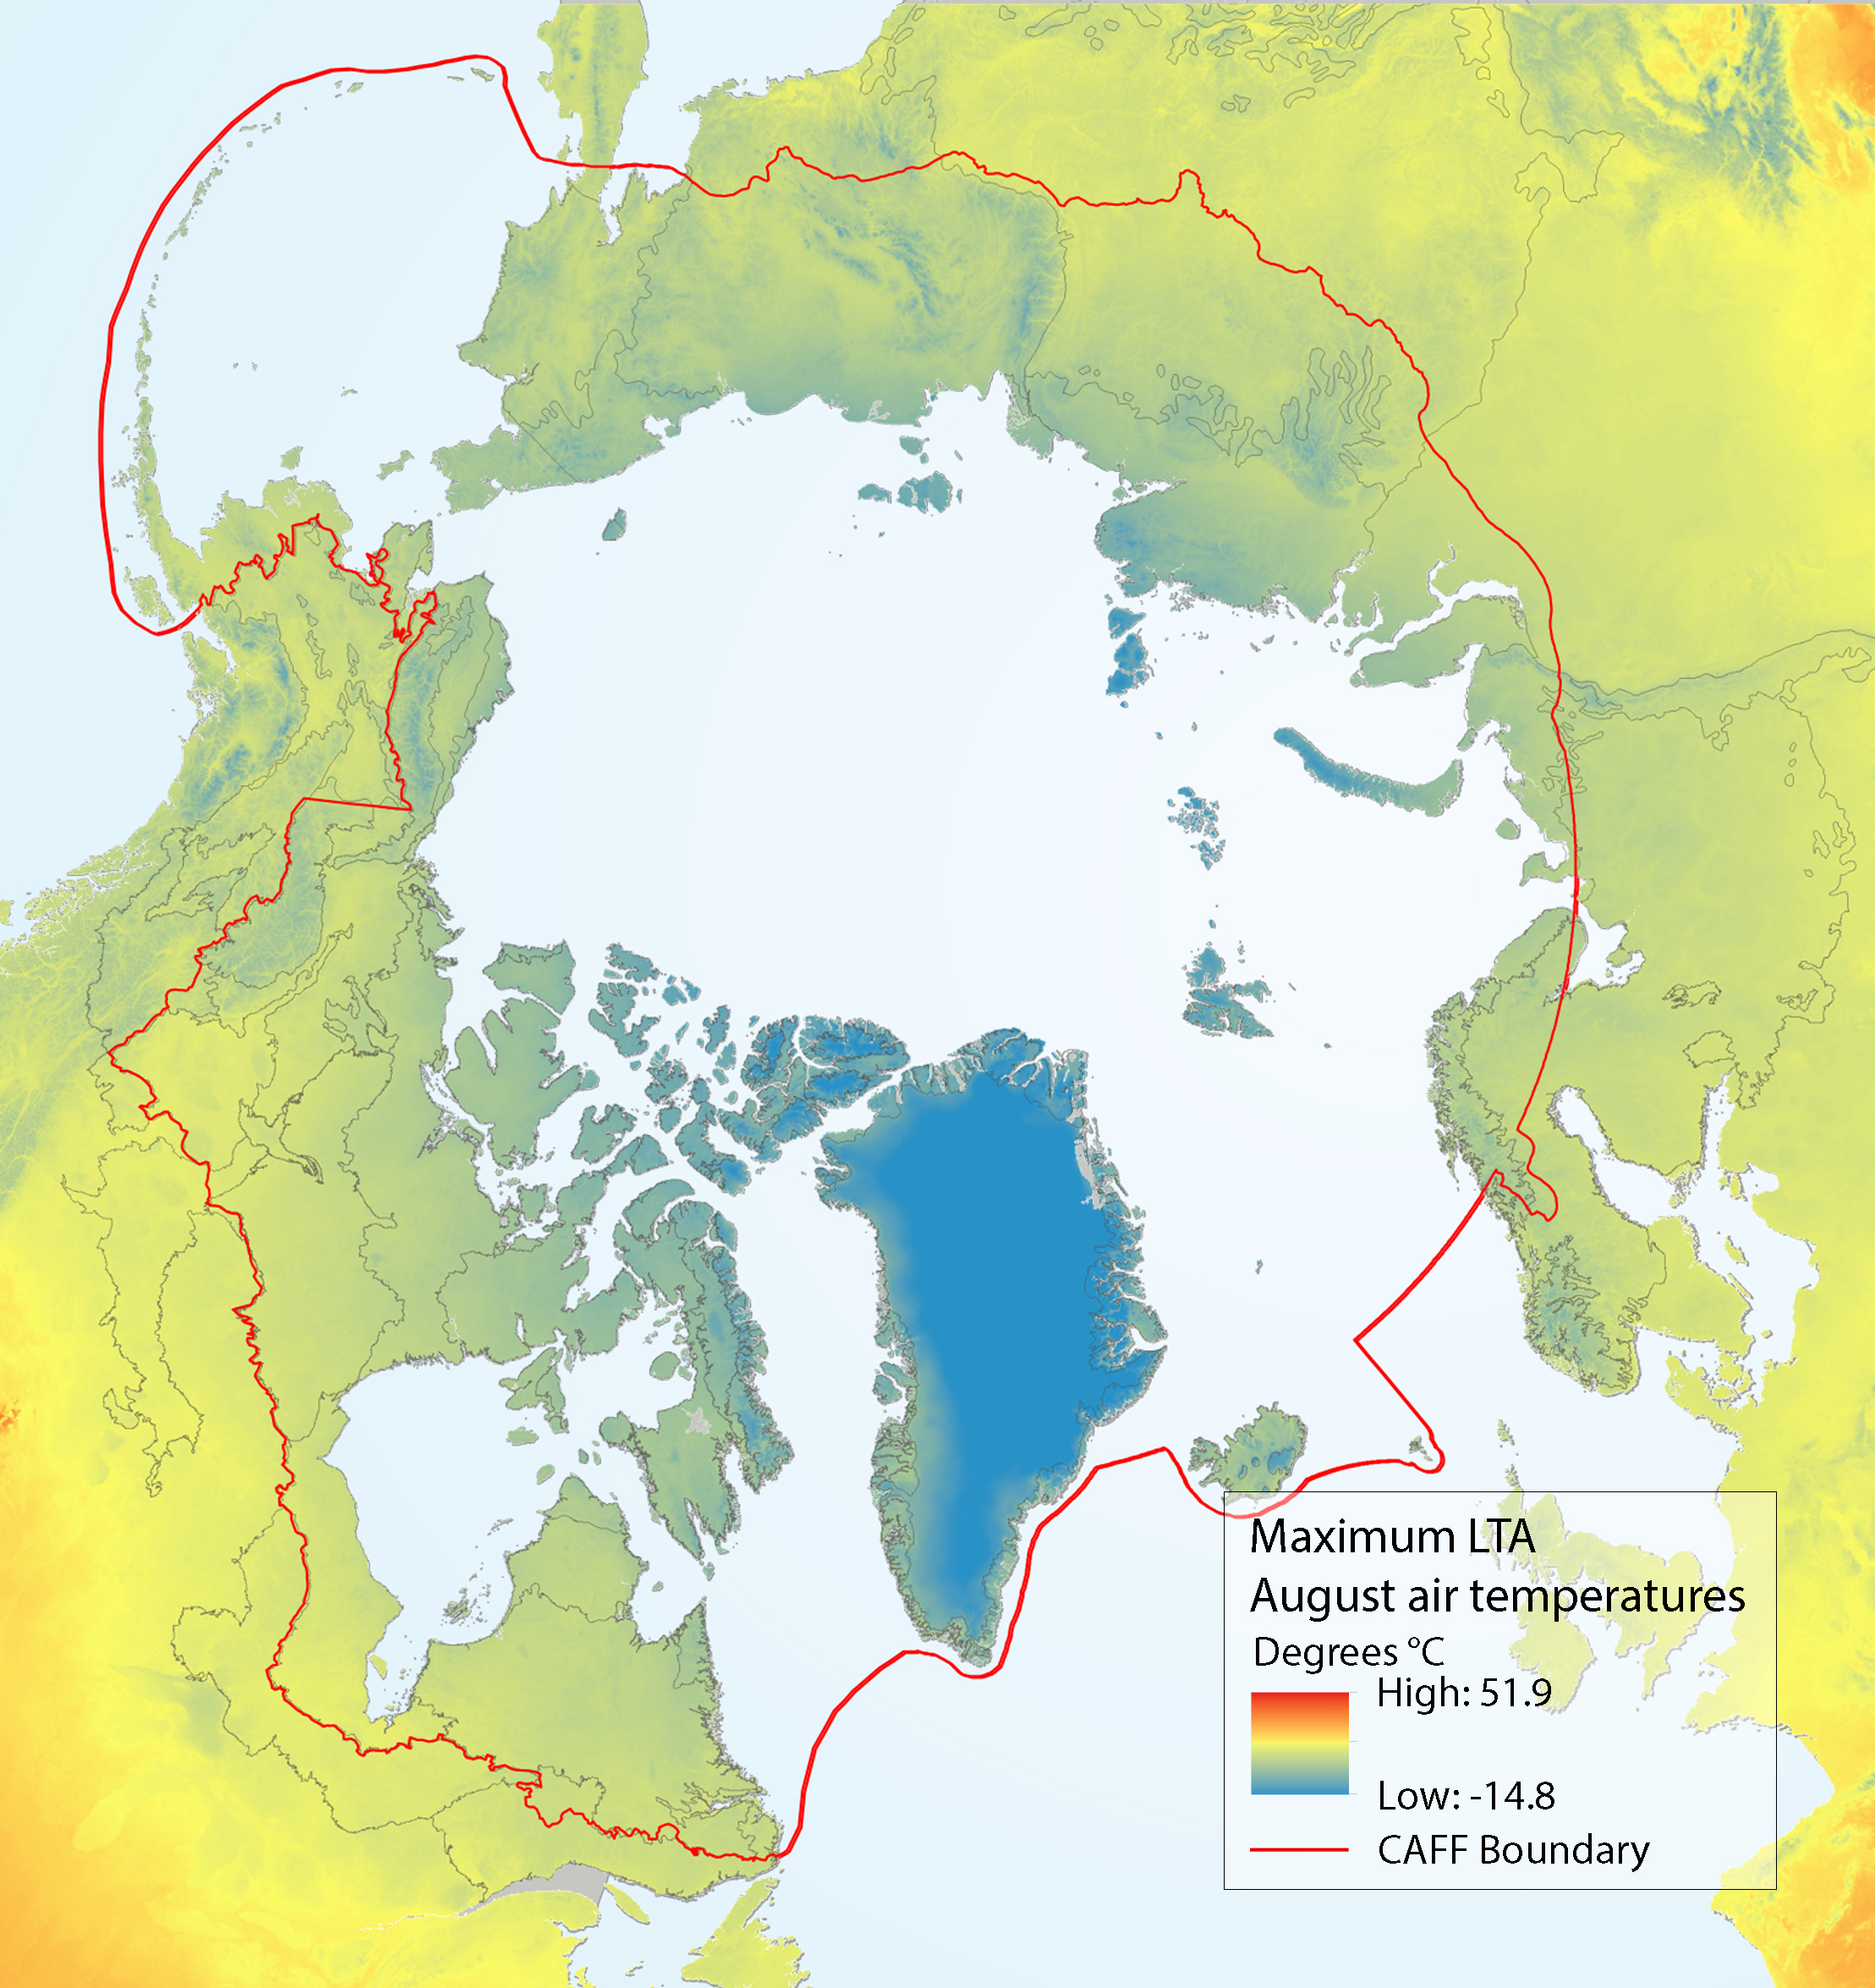
Maximum LTA (long-term average) August air temperatures for the circumpolar region, with ecoregions used in the analysis of the SAFBR outlined in black. Source for temperature layer: Fick and Hijmans (2017). State of the Arctic Freshwater Biodiversity Report - Chapter 5 - Page 89 - Figure 5-5
-
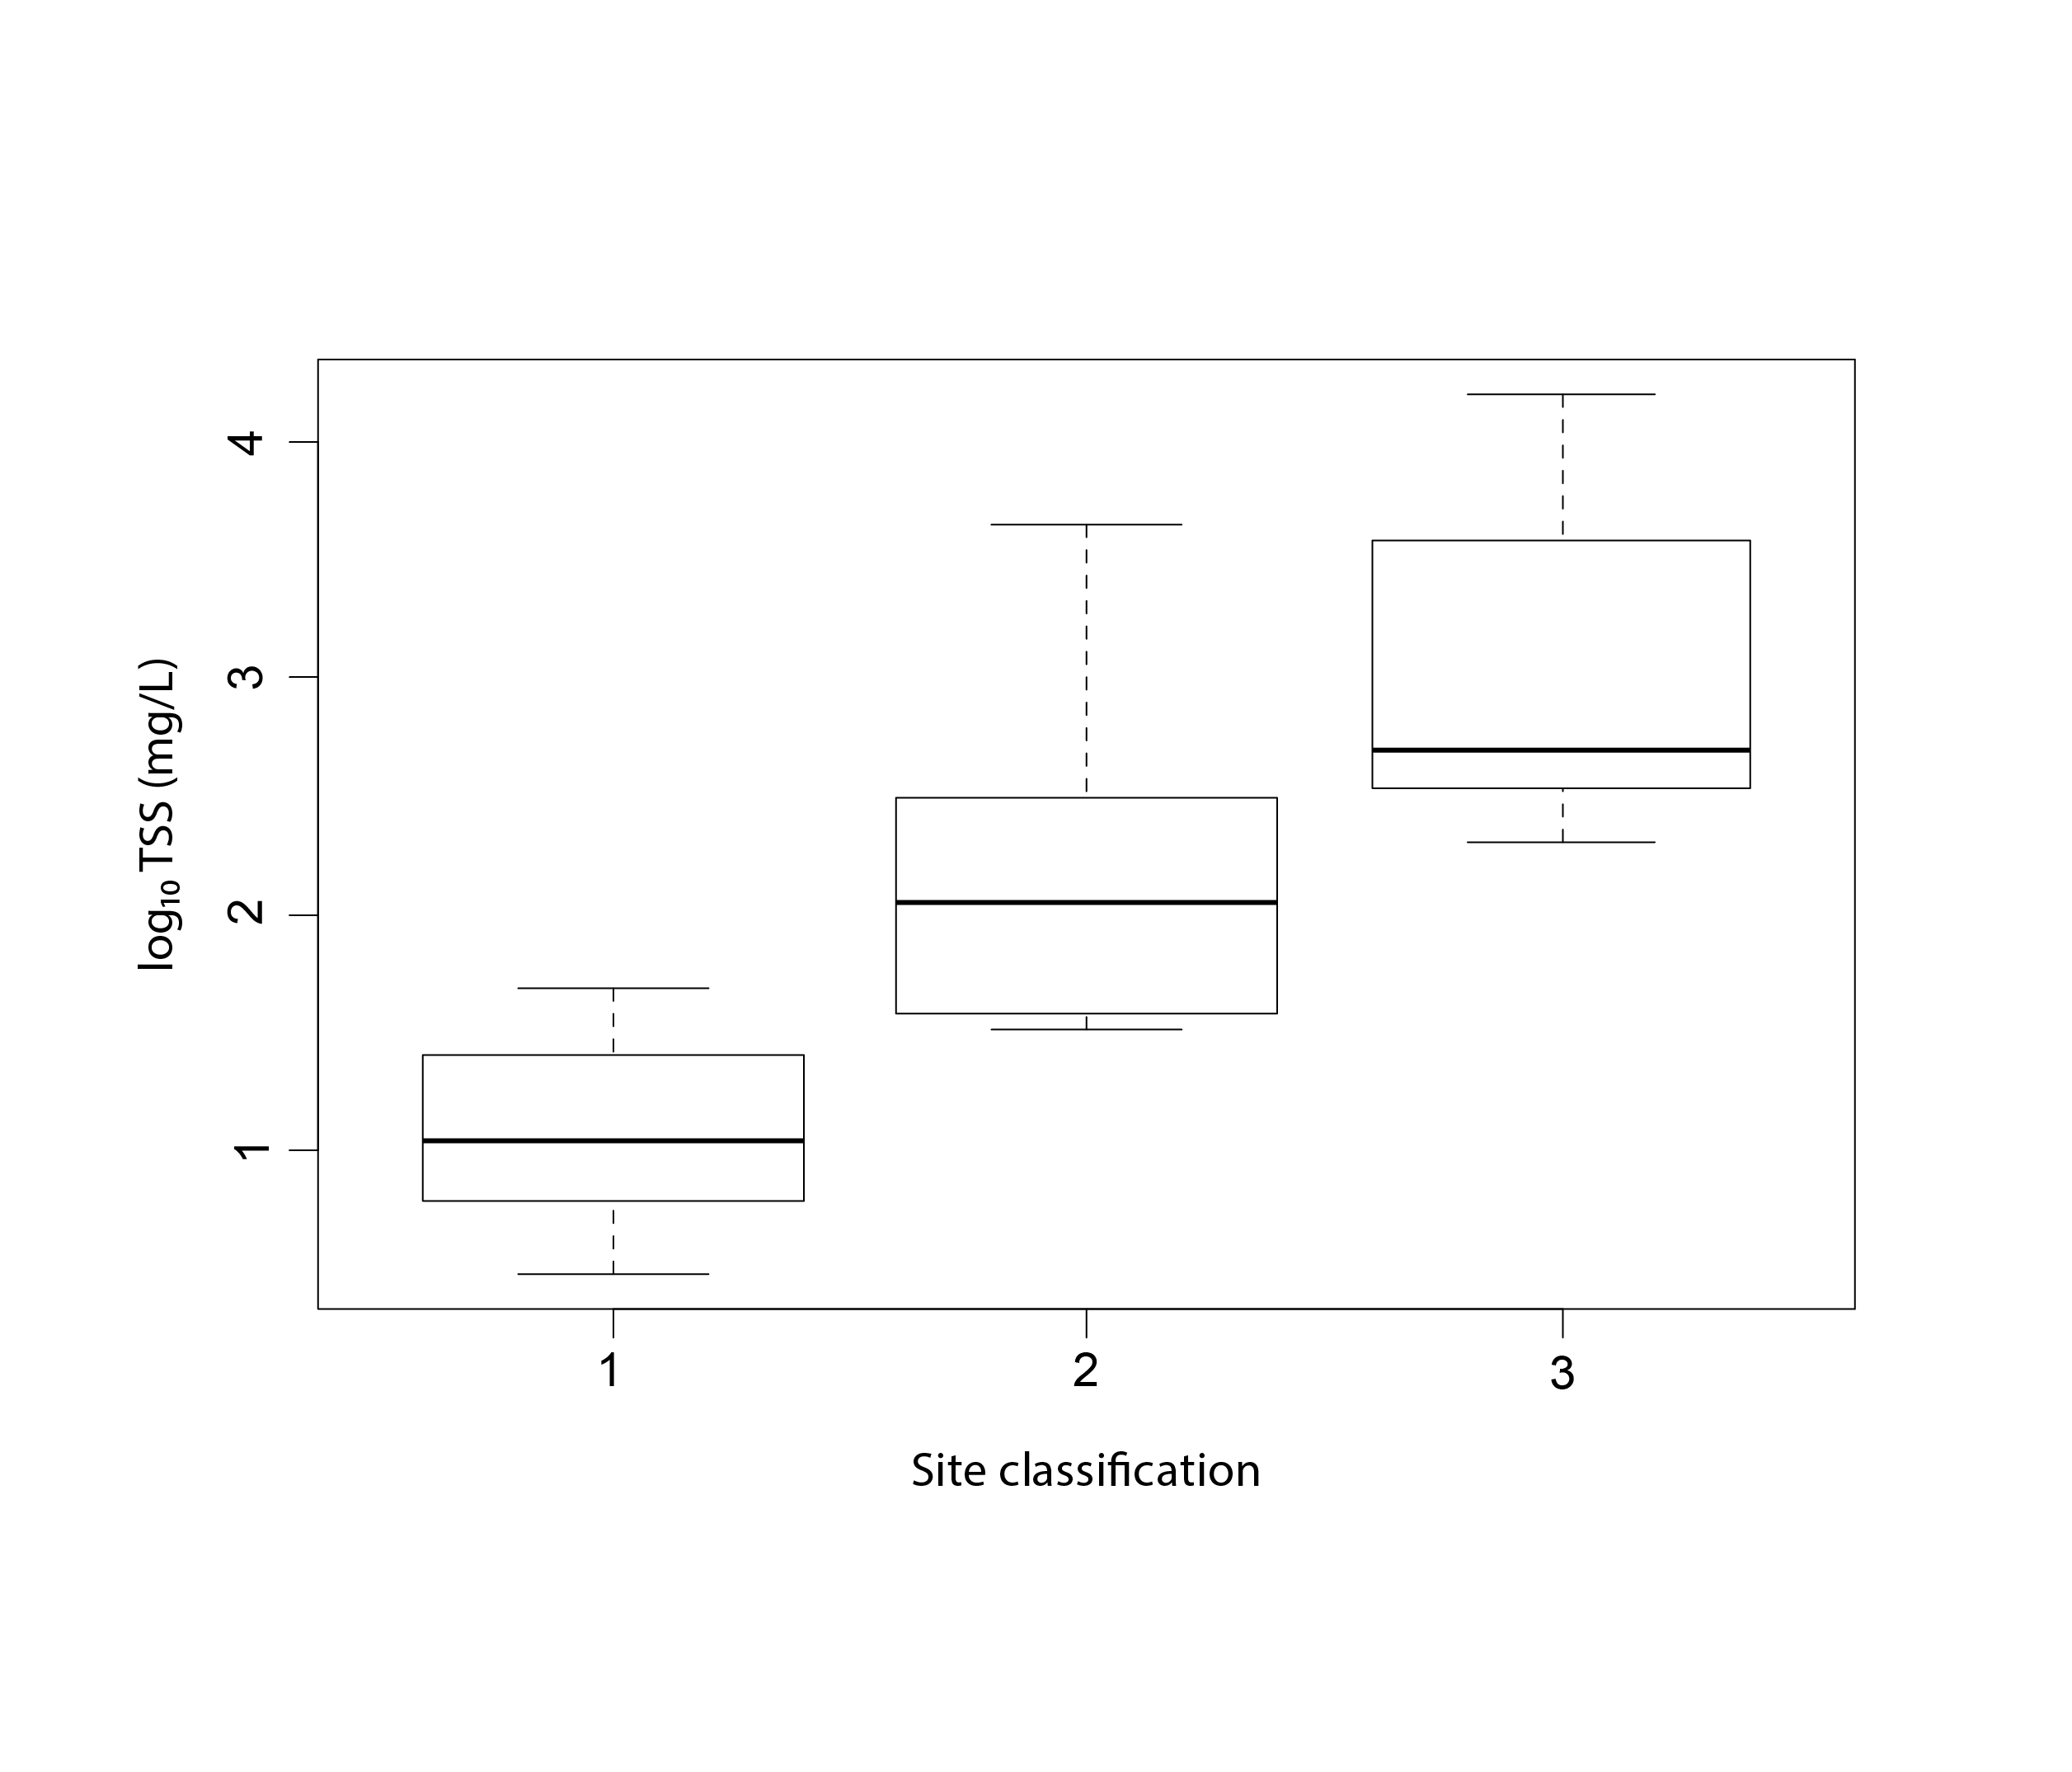
Figure 3-4 Effects of permafrost thaw slumping on Arctic rivers, including (upper) a photo of thaw slump outflow entering a stream on the Peel Plateau, Northwest Territories, Canada, and (lower) log10-transformed total suspended solids (TSS) in (1) undisturbed, (2) 1-2 disturbance, and (3) > 2 disturbance stream sites, with letters indicating significant differences in mean TSS among disturbance classifications Plot reproduced from Chin et al. (2016). State of the Arctic Freshwater Biodiversity Report - Chapter3 - Page 21 - Figure 3-4
-
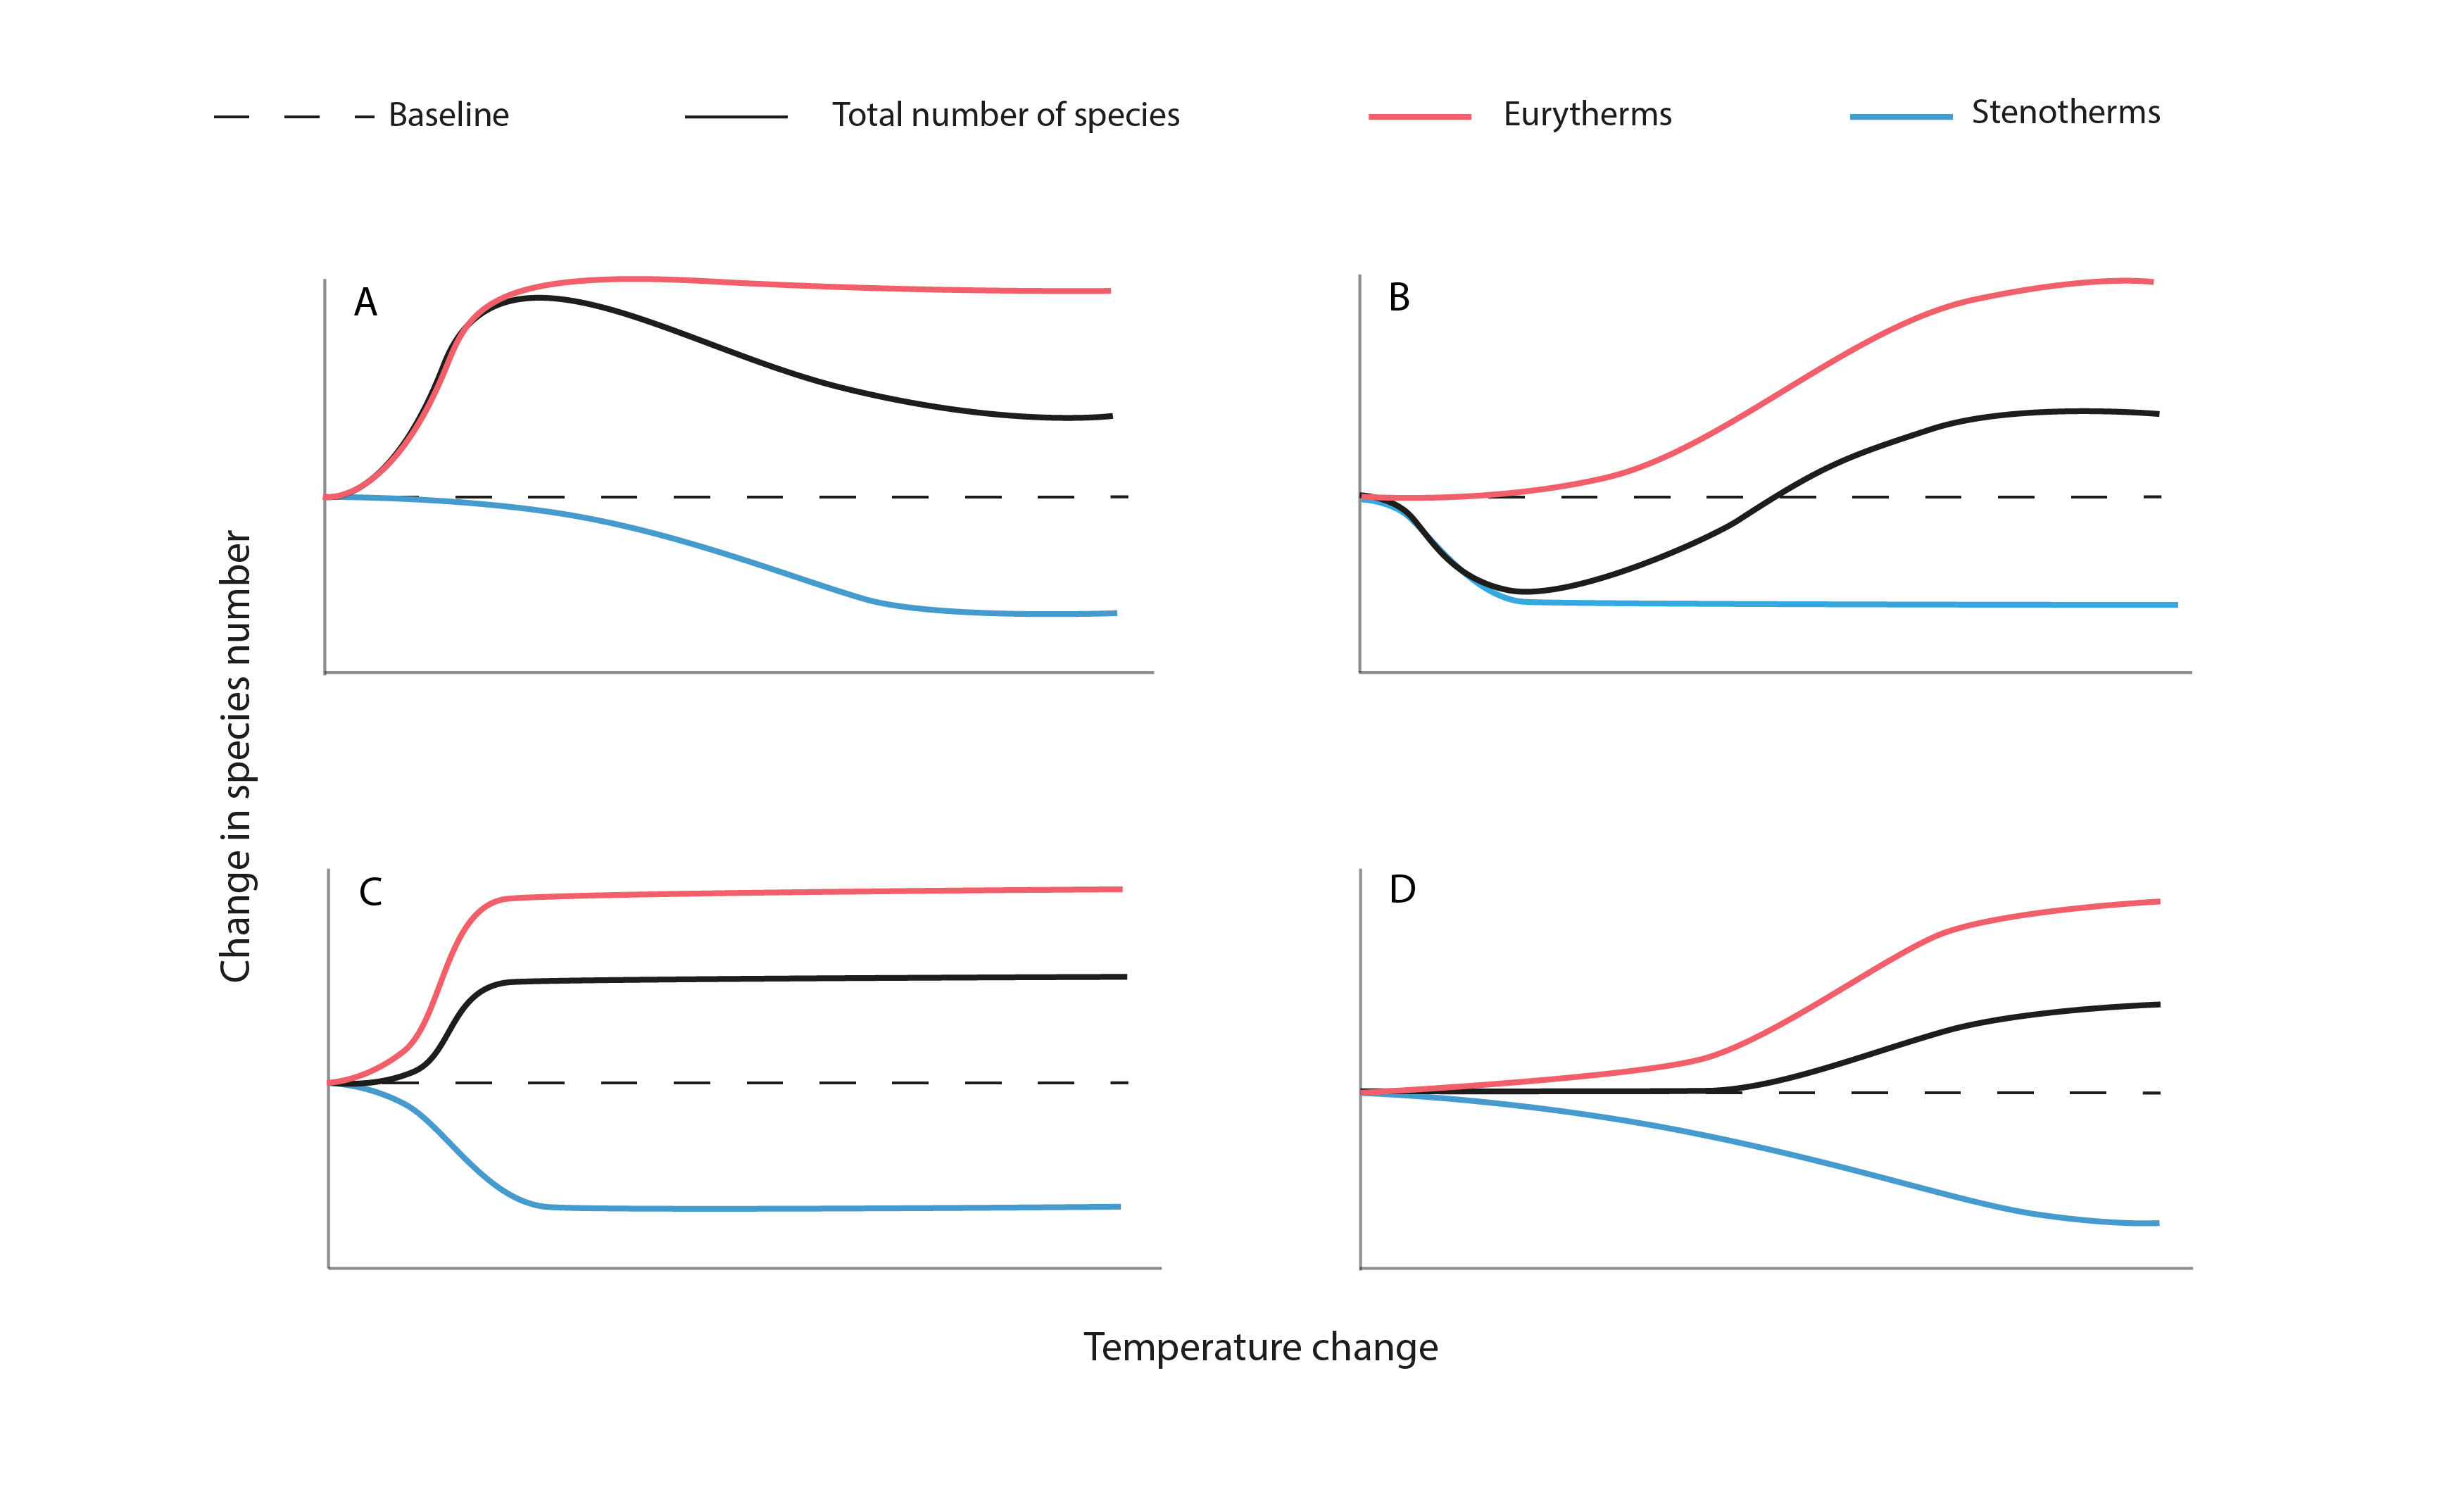
Figure 3-6. The hypothesized effects of rising mean water temperature on biodiversity (as total species number) of Arctic freshwater ecosystems. A pulsed increase in gamma biodiversity (a) results from the combination of high eurythermal invasion and establishment and low stenothermic loss with increasing water temperature. A pulsed decrease in gamma biodiversity (b) results from the combination of low eurythermal invasion and establishment and high stenothermic loss. Rapid increases (c) and slow increases (d) in species diversity occur, respectively, with high eurythermal invasion and establishment coupled with high stenothermic loss or low eurythermal invasion and establishment and low stenothermic loss as temperatures increase. For simplification, barriers to dispersal have been assumed to be limited in these models. State of the Arctic Freshwater Biodiversity Report - Chapter 3 - Page 23 - Figure 3-6
-
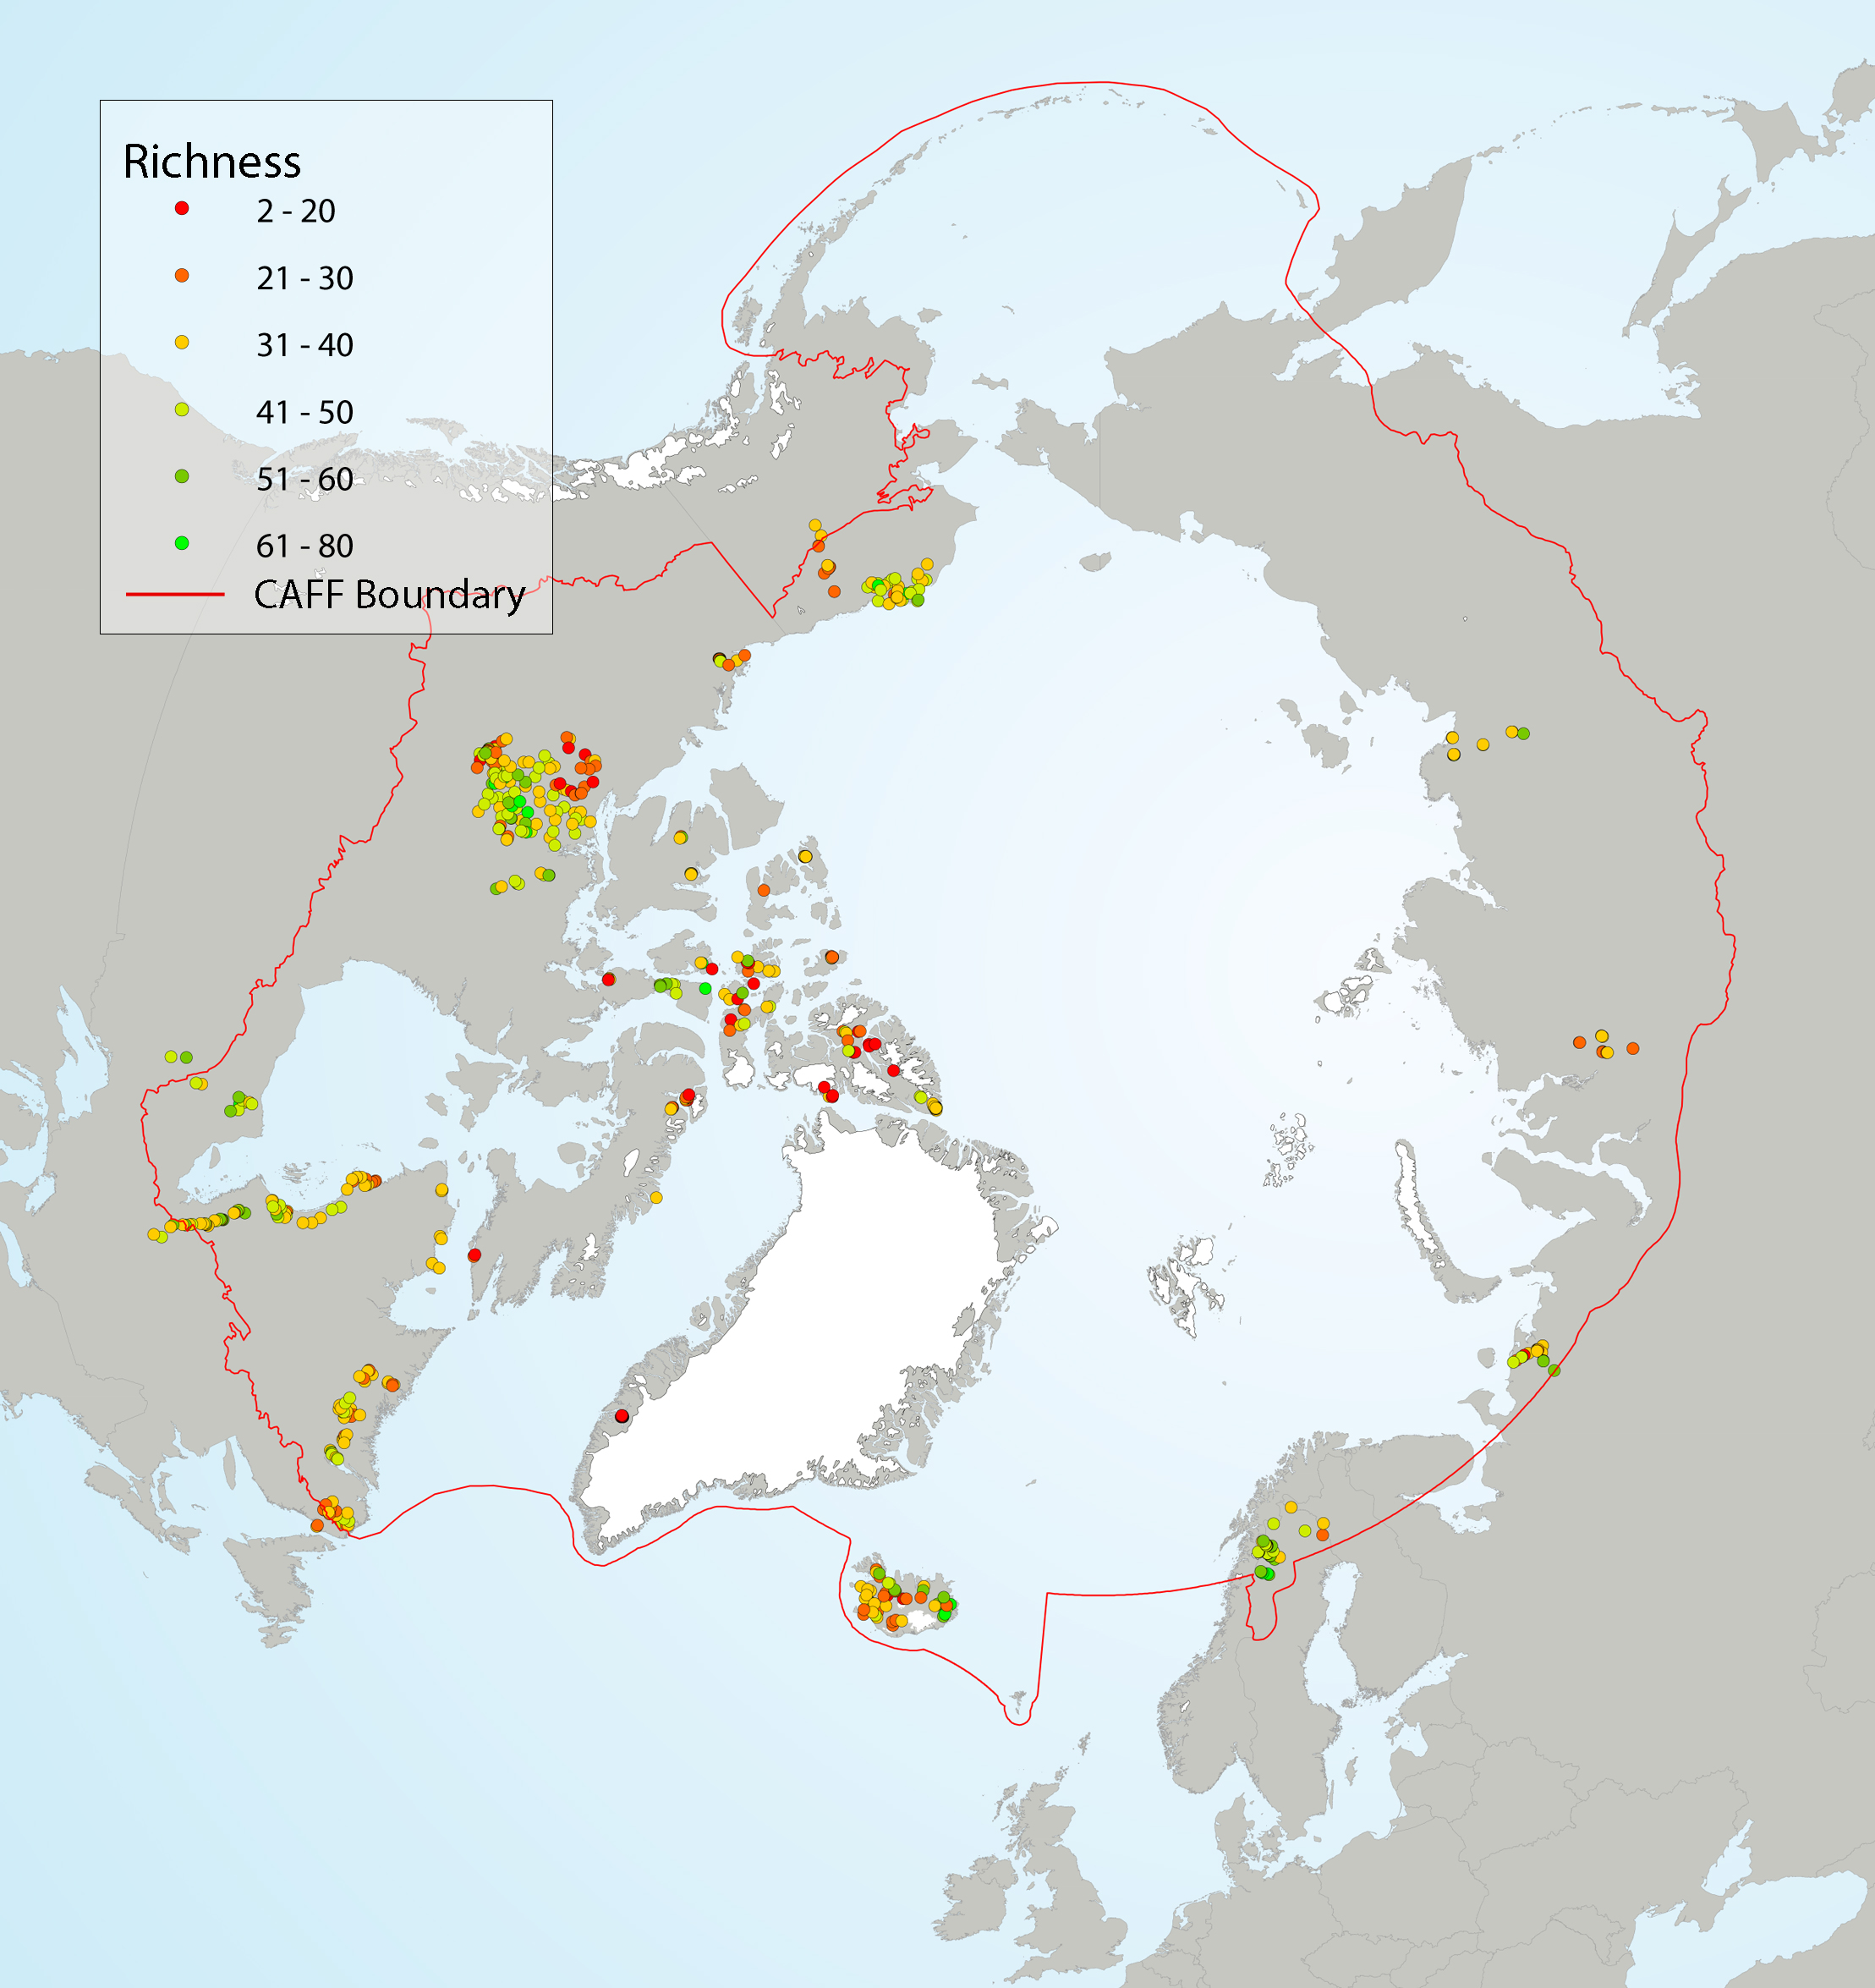
Figure 4 9 Local diatom species richness of Arctic lake surface sediments, showing (left) richness as a function of latitude, and (right) site-specific richness. A LOESS smoother (blue line) with a span of 0.75 and a 95% confidence interval (grey shading) was applied to the data (left) to better highlight the general trend. Coloured circles on the map indicate the species richness at the sampling sites. State of the Arctic Freshwater Biodiversity Report - Chapter 4 - Page 37 - Figure 4-9
-

Although the circumpolar countries endeavor to support monitoring programs that provide good coverage of Arctic and subarctic regions, this ideal is constrained by the high costs associated with repeated sampling of a large set of lakes and rivers in areas that often are very remote. Consequently, freshwater monitoring has sparse, spatial coverage in large parts of the Arctic, with only Fennoscandia and Iceland having extensive monitoring coverage of lakes and streams Figure 6-2 Current state of monitoring for river FECs in each Arctic country State of the Arctic Freshwater Biodiversity Report - Chapter 6 - Page 94 - Figure 6-2
-
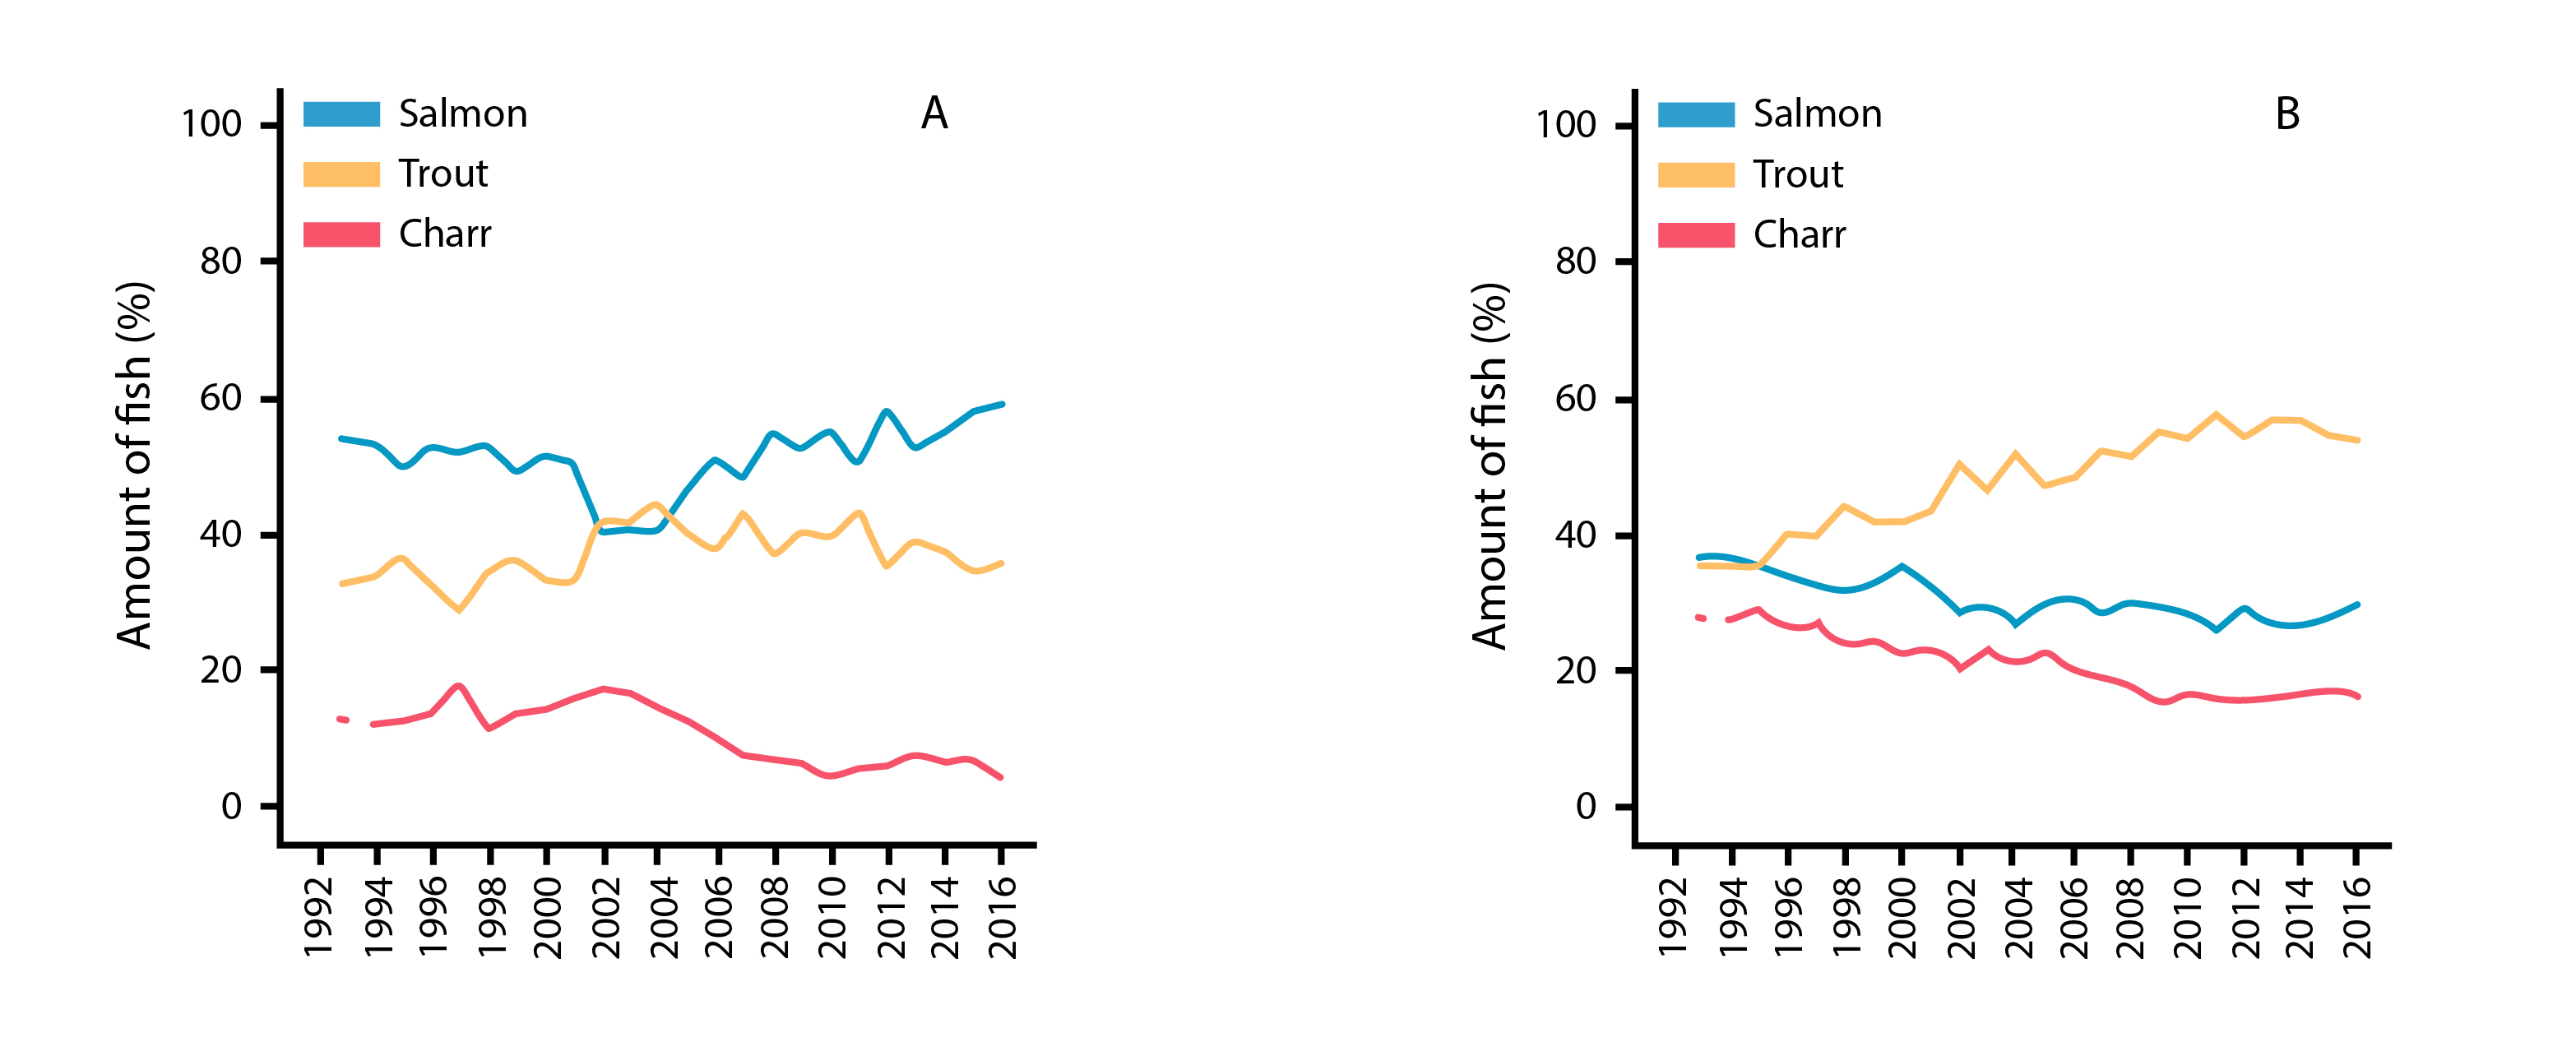
Temporal patterns in % abundance of Atlantic salmon, brown trout, and anadromous Arctic charr from catch statistics in northern Norway rivers monitored from 1993 to 2016, including basins dominated by (a) rivers and (b) lakes. State of the Arctic Freshwater Biodiversity Report - Chapter 4 - Page 81- Figure 4-42
-
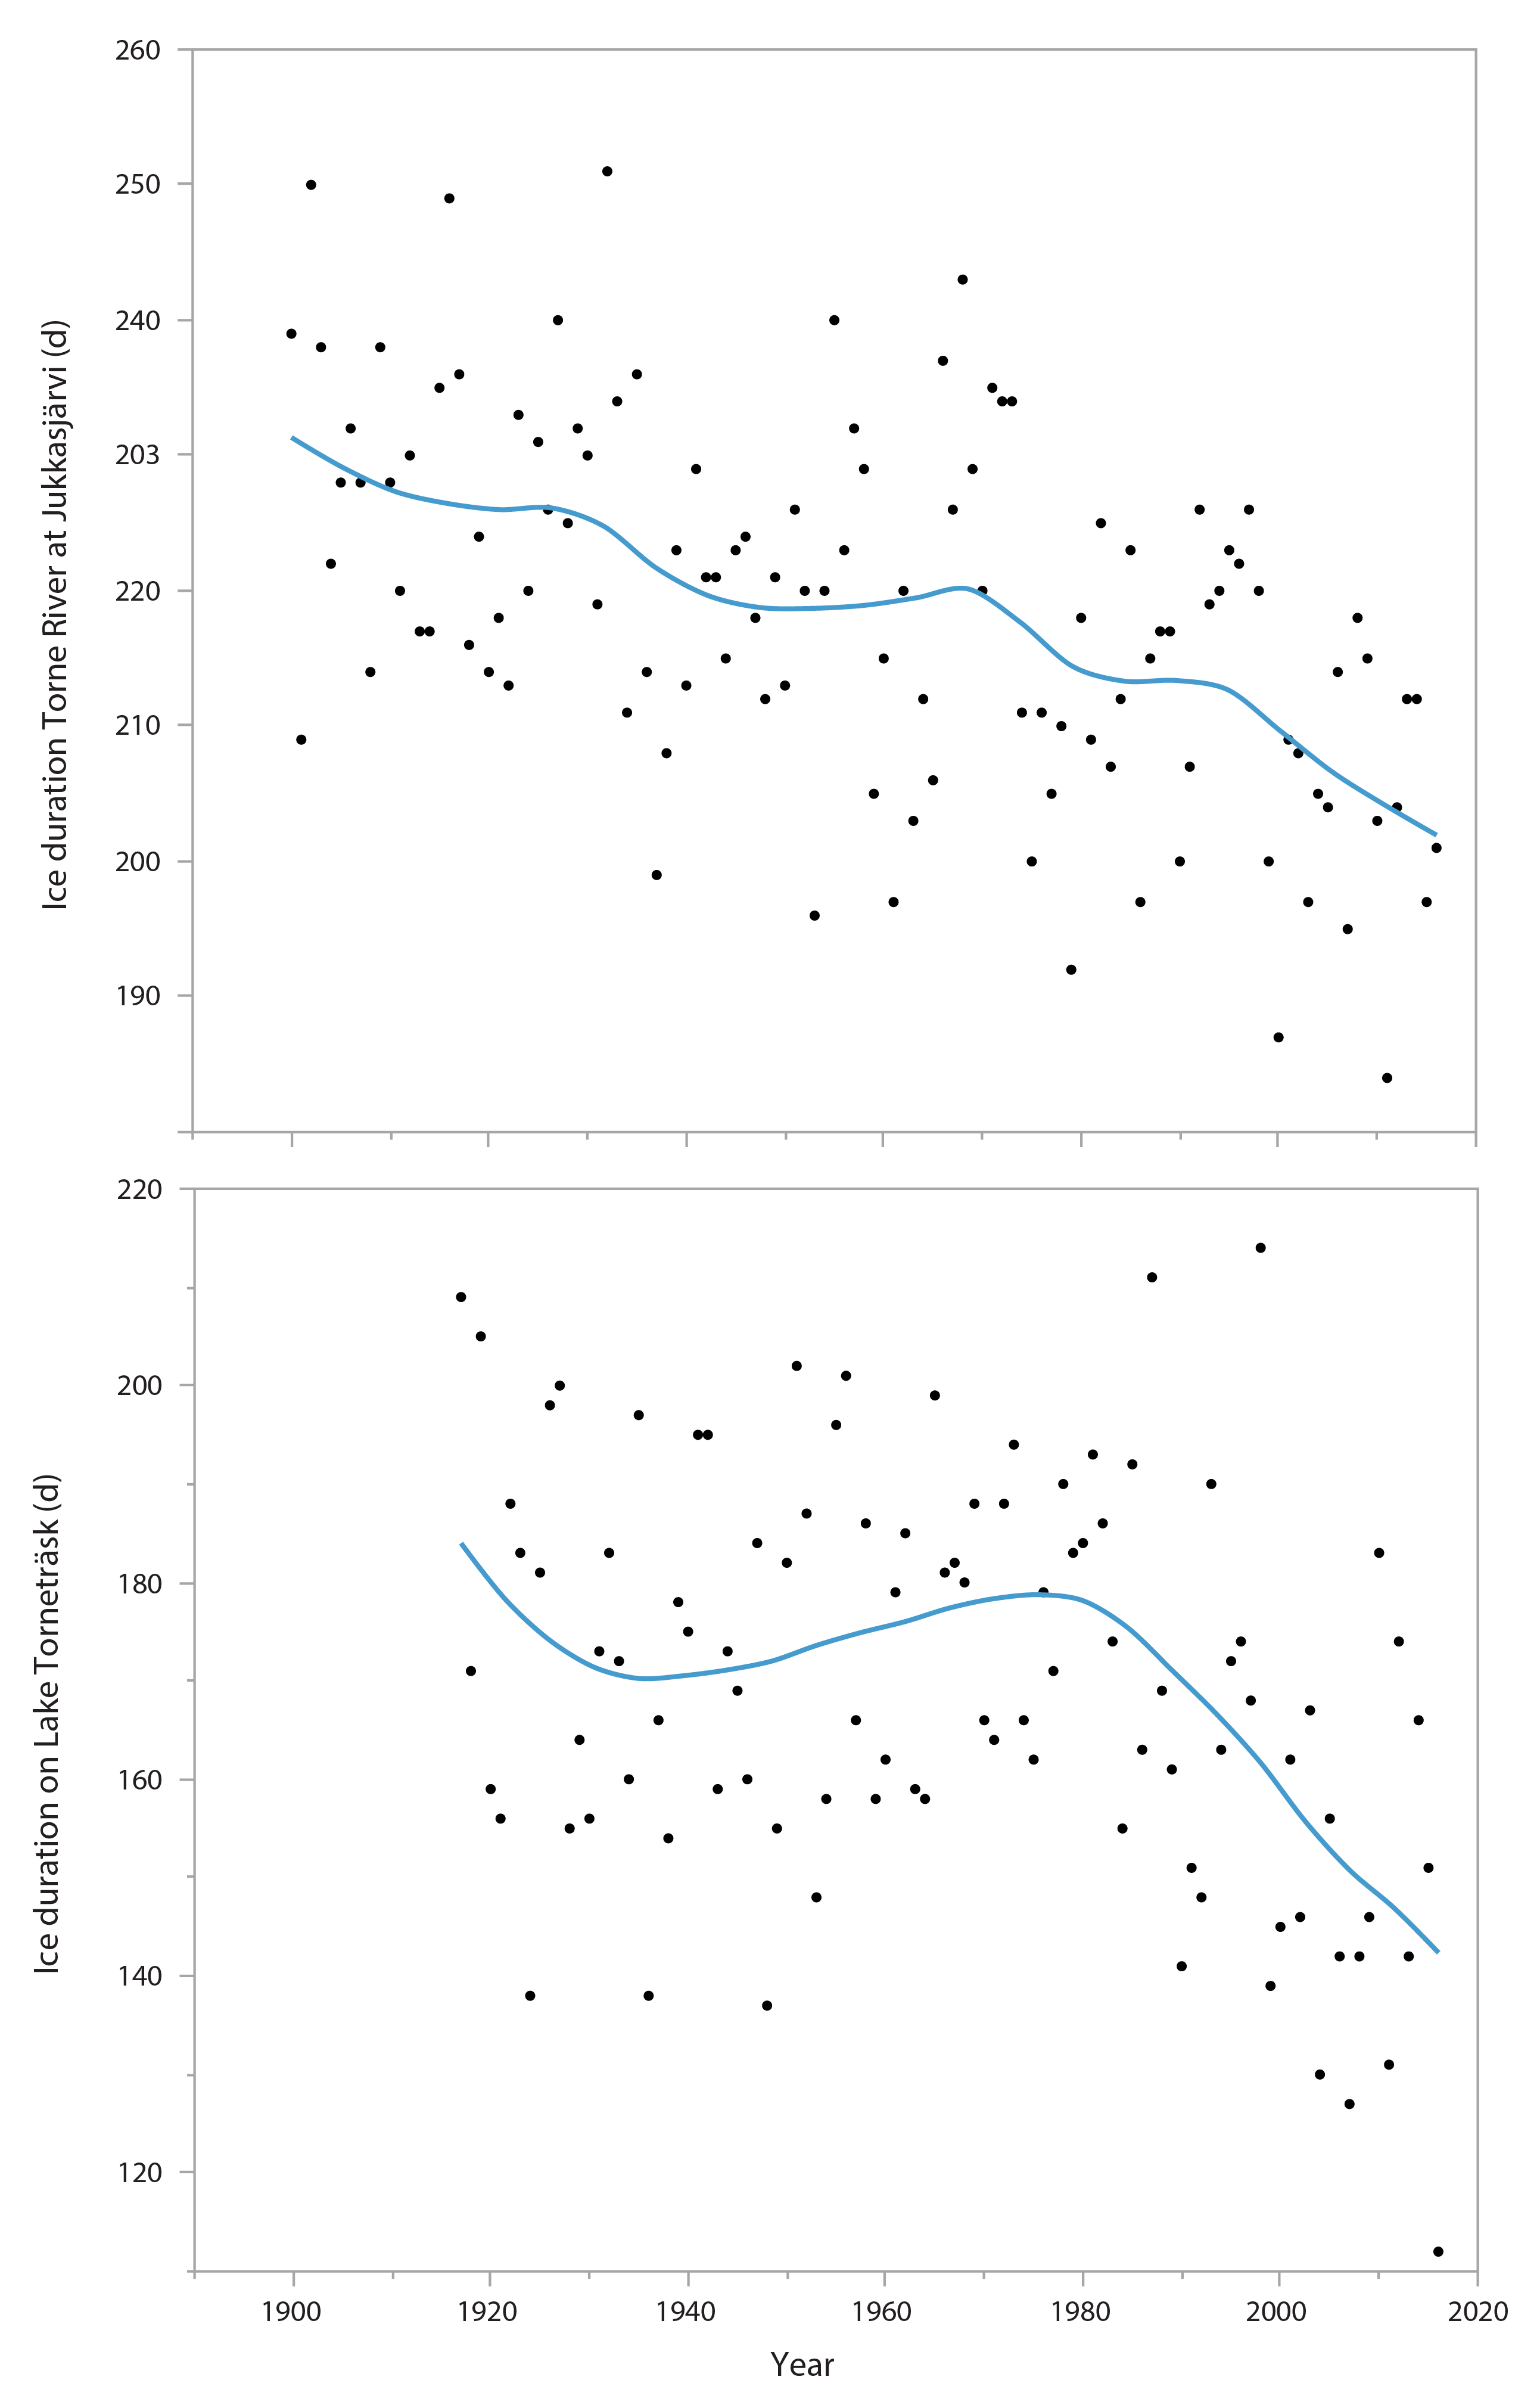
Figure 3-1 Long-term trends in ice duration (as days) in the River Torne (upper plot) and Lake Torneträsk (lower plot) at 68° north on the Scandinavian peninsula. Lines show smooth fit. Data source: Swedish Meteorological and Hydrological Institute. State of the Arctic Freshwater Biodiversity Report - Chapter 3 - Page 19 - Figure 3-1