 CAFF - Arctic Biodiversity Data Service (ABDS)
Lake
Type of resources
Available actions
Topics
Keywords
Contact for the resource
Provided by
Formats
Representation types
Update frequencies
status
-
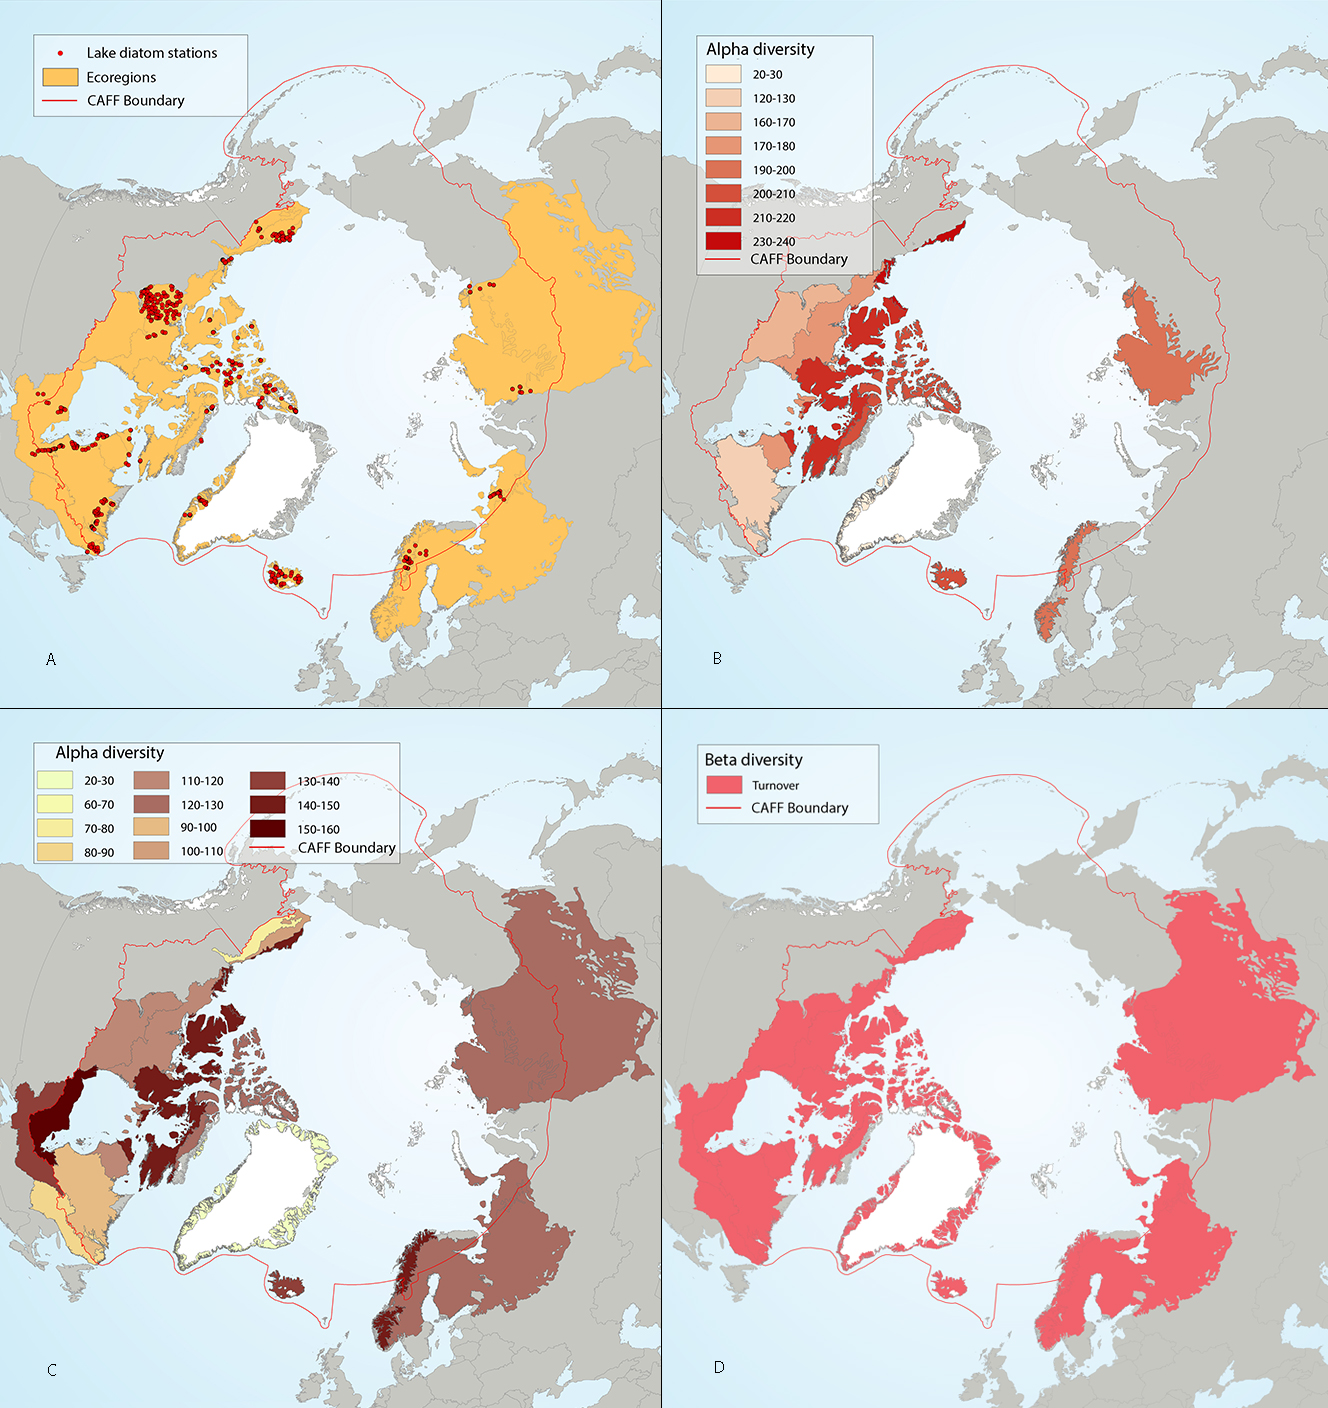
Figure 4-7 Circumpolar assessment of lake diatoms, indicating (a) the location of lake diatom stations, underlain by circumpolar ecoregions; (b) ecoregions with many lake diatom stations, colored on the basis of alpha diversity rarefied to 40 stations; (c) all ecoregions with lake diatom stations, colored on the basis of alpha diversity rarefied to 10 stations; (d) ecoregions with at least two stations in a hydrobasin, colored on the basis of the dominant component of beta diversity (i.e. species turnover, nestedness, approximately equal contribution, or no diversity) when averaged across hydrobasins in each ecoregio. State of the Arctic Freshwater Biodiversity Report - Chapter 4 - Page 35 - Figure 4-7
-
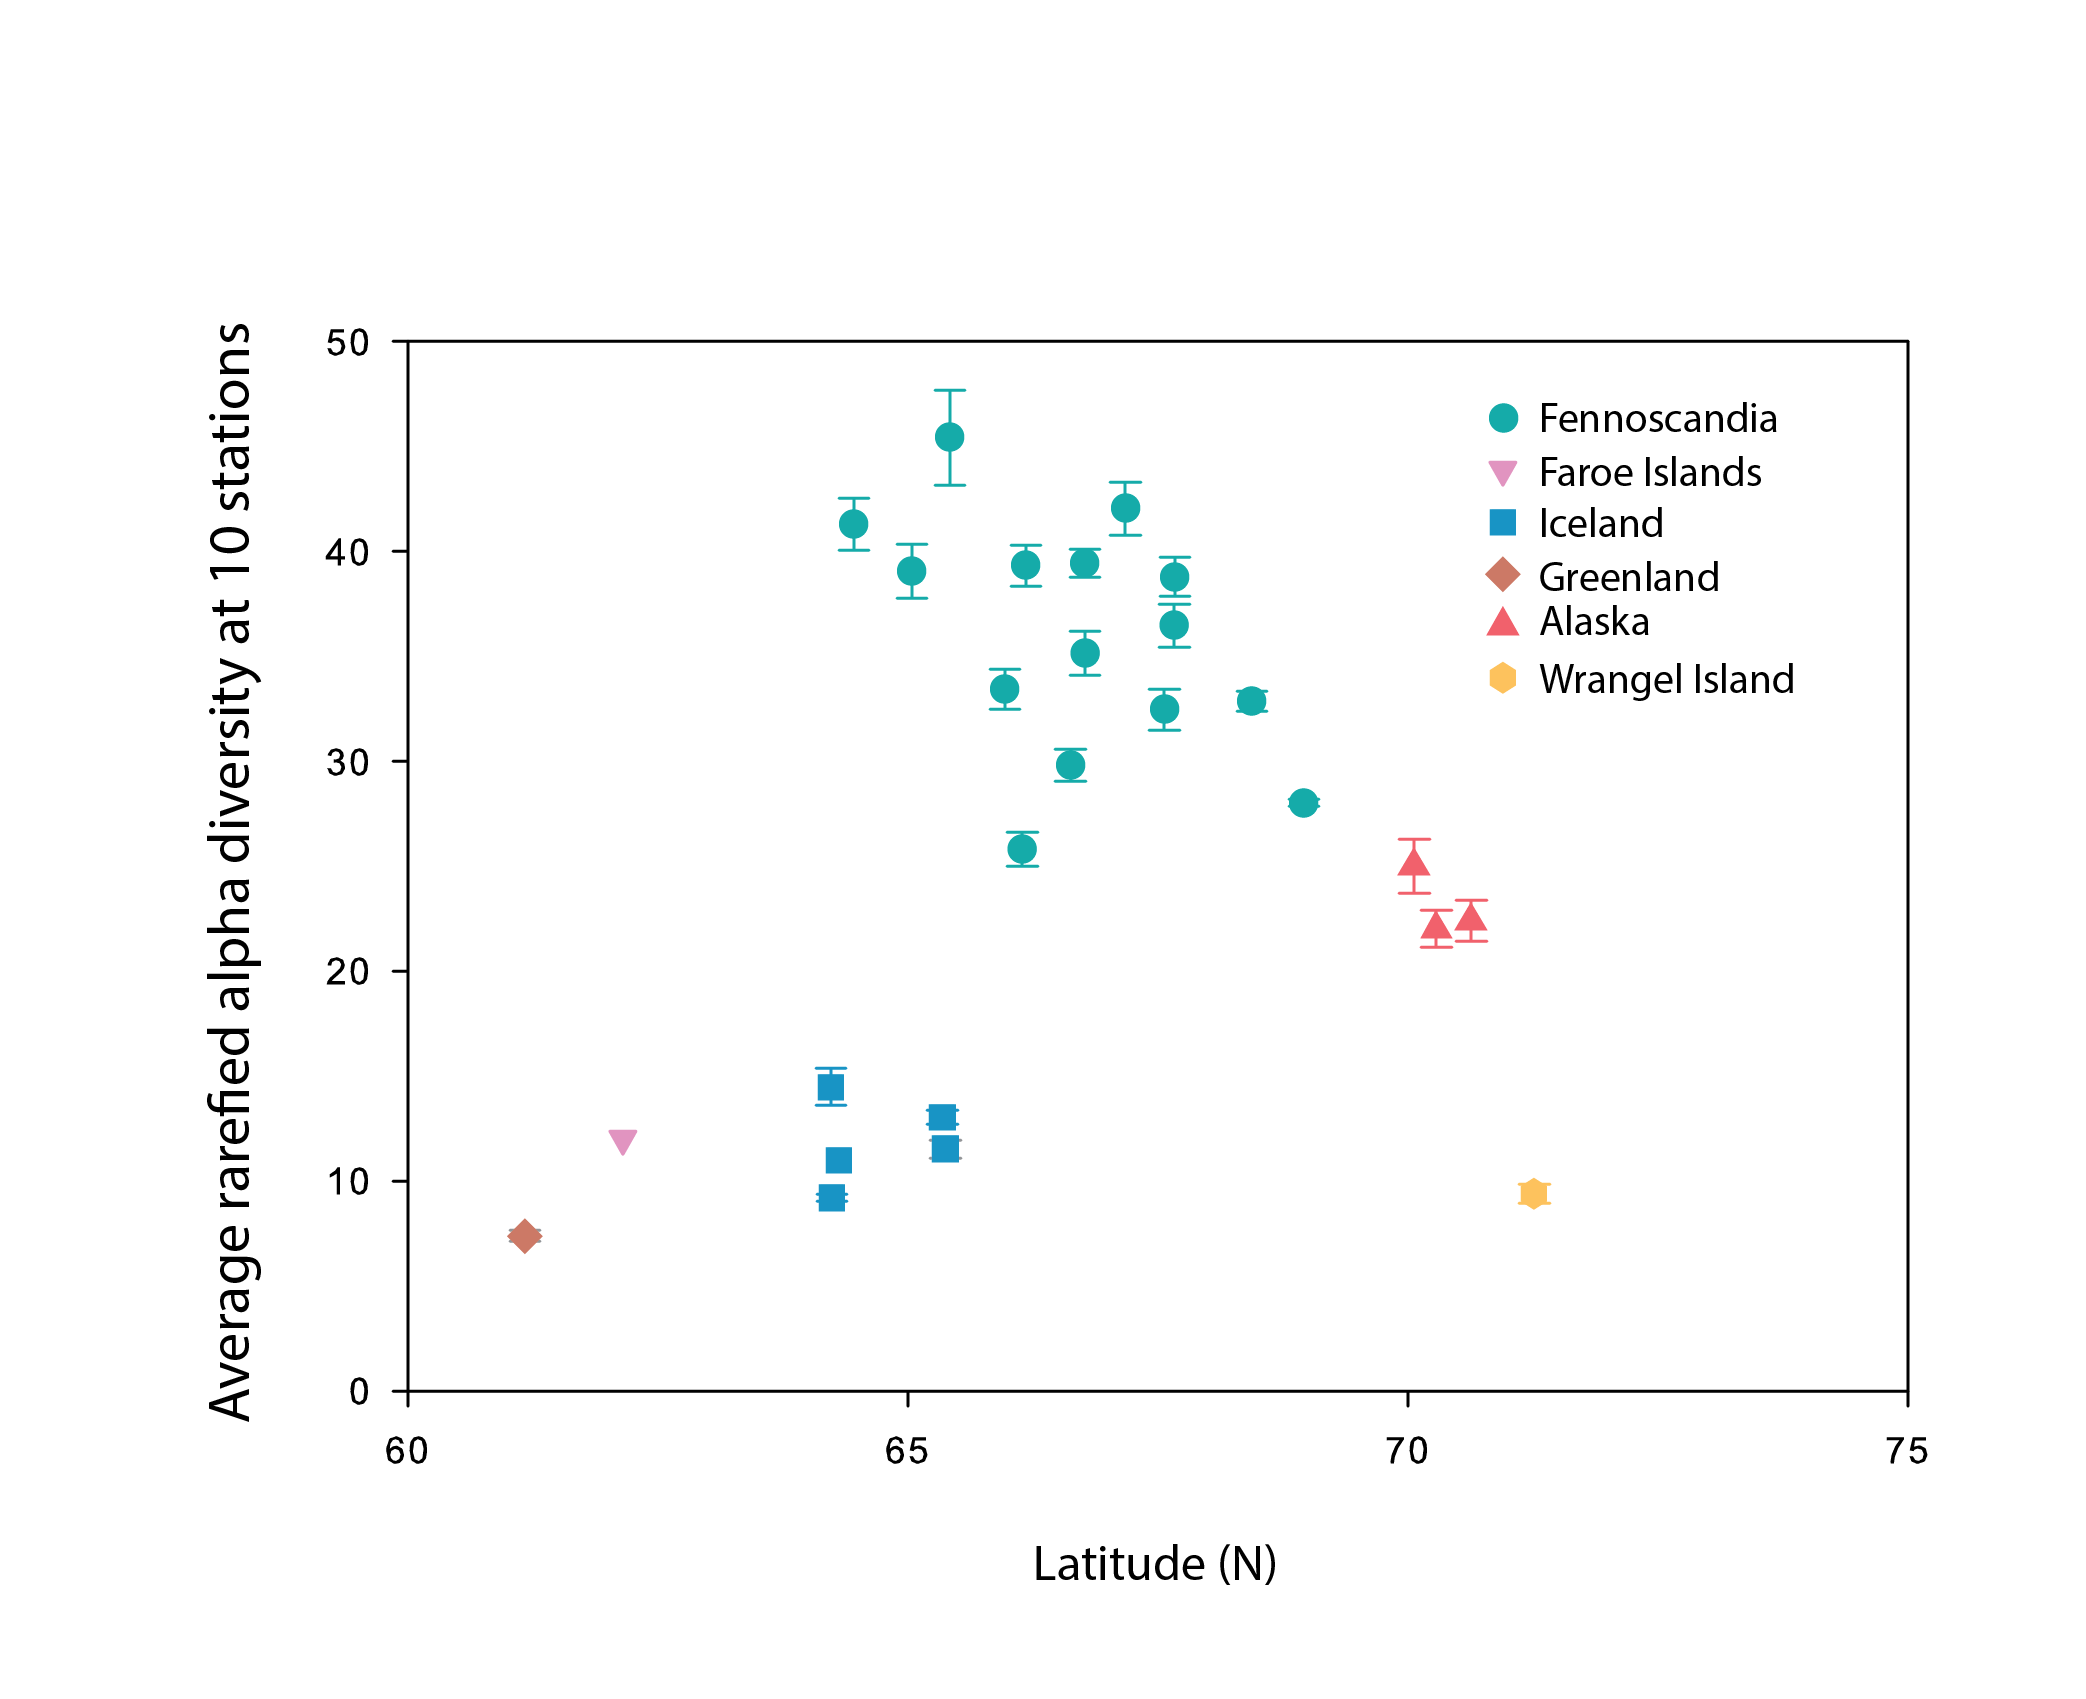
Alpha diversity (rarefied to 10 stations, with error bars indicating standard error) of littoral lake benthic macroinvertebrates plotted as a function of the average latitude of stations in each hydrobasin. Hydrobasins are coloured by country/region. State of the Arctic Freshwater Biodiversity Report - Chapter 4- Page 68 - Figure 4-31
-
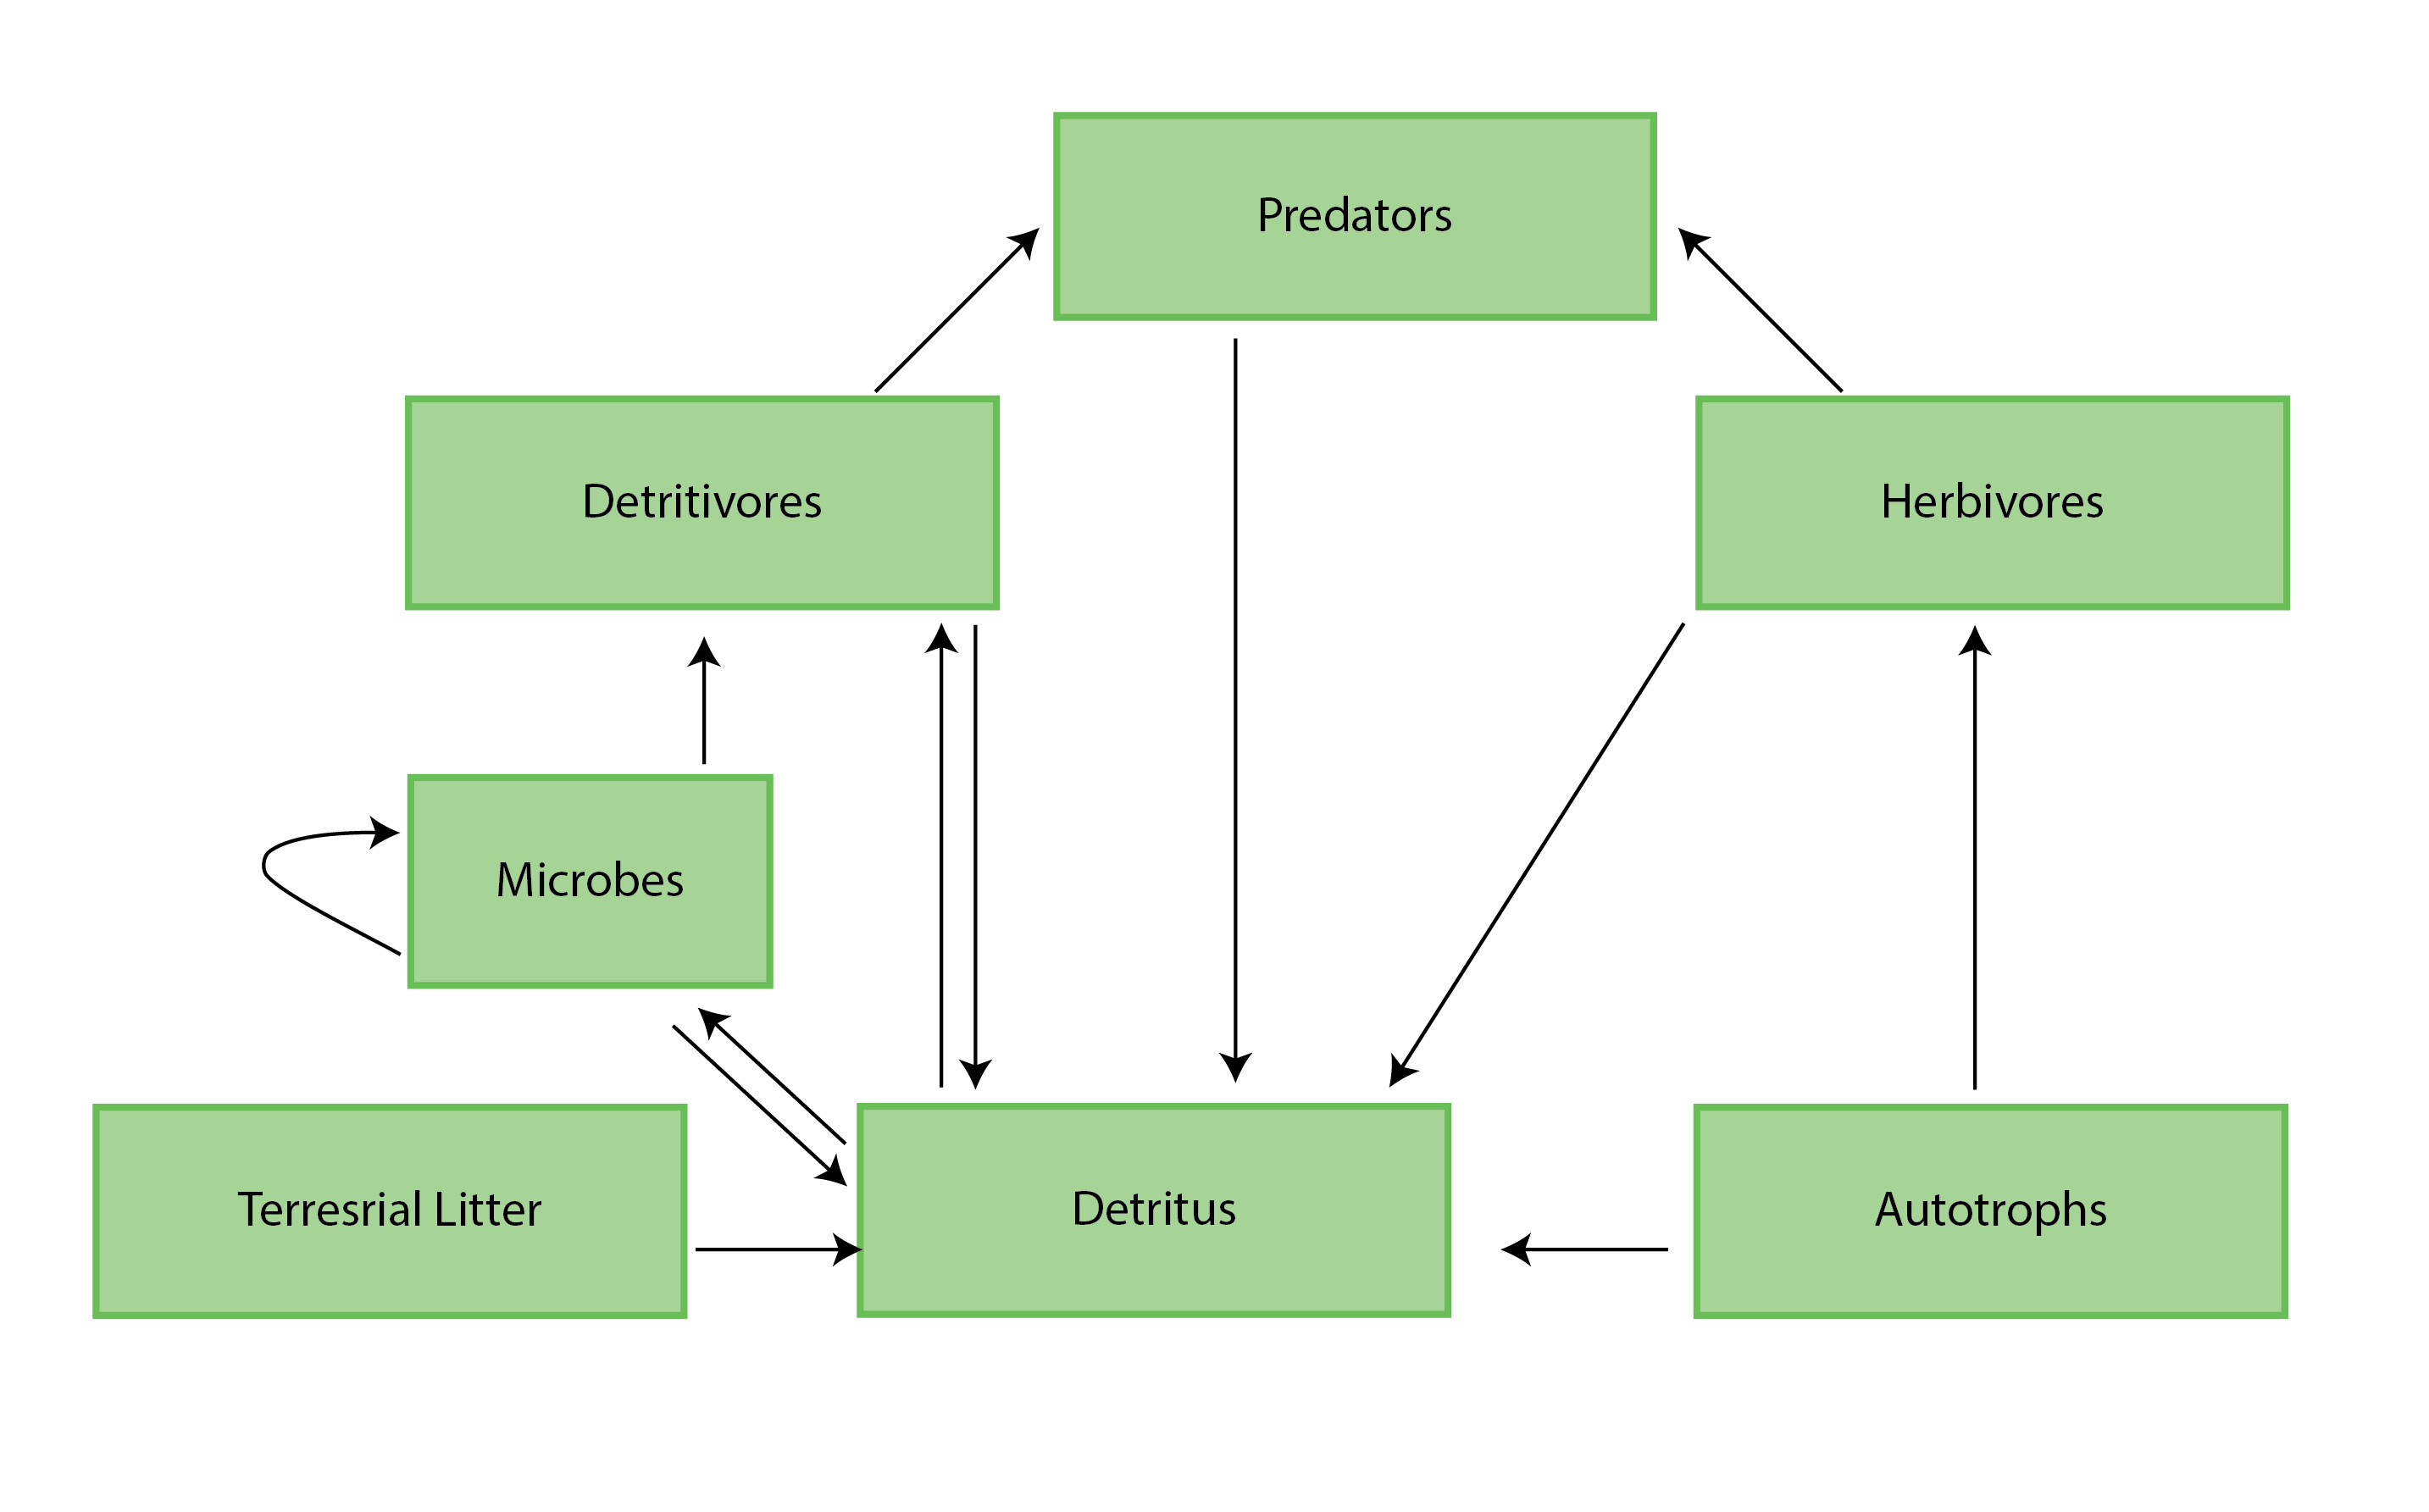
Figure 4-1 A generic food web diagram for a lake or river, indicating the basic trophic levels (boxes) and energy flow (arrows) between those levels. Reproduced from Culp et al. (2012a). State of the Arctic Freshwater Biodiversity Report - Chapter 4 - Page 25 - Figure 4-1
-
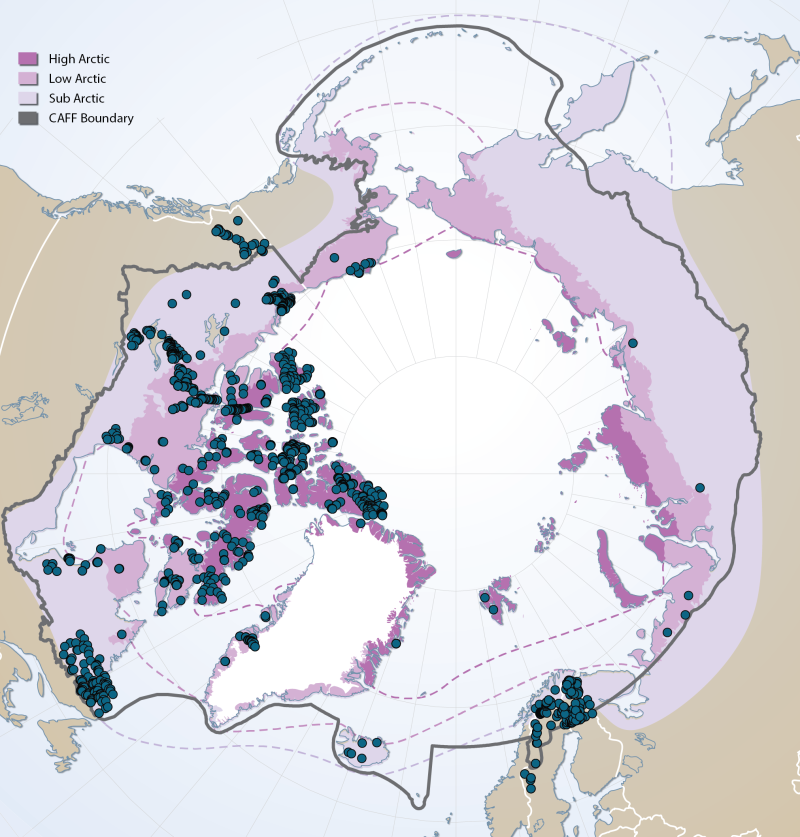
Sites of existing lake biotic and abiotic data as compiled by the Freshwater Expert Monitoring Group (FEMG) of the Circumpolar Biodiversity Monitoring Group (CBMP) Published in the CBMP Freshwater Brochure 2013 https://oaarchive.arctic-council.org/items/e76cce2c-4c87-4eb4-89d3-c88c3ae955d6