 CAFF - Arctic Biodiversity Data Service (ABDS)
phytoplankton
Type of resources
Available actions
Topics
Keywords
Contact for the resource
Provided by
Representation types
Update frequencies
status
-
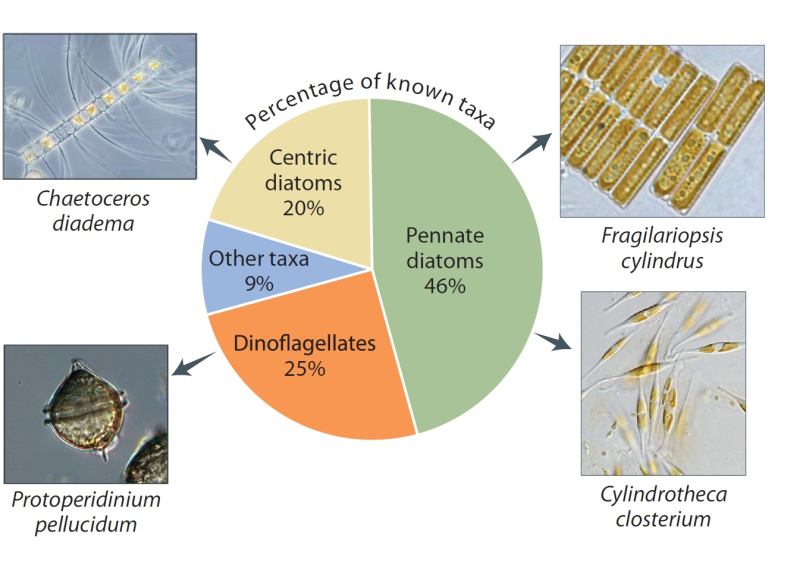
The number of species depends partly on what has been studied. Proportions vary somewhat around the Arctic, but diatoms and dinoflagellates are the most diverse groups everywhere. The greatest sampling effort has been in the Laptev Sea, Hudson Bay, and the Norwegian sector of the Barents Sea. Species shown are among the most commonly recorded. Published in the Life Linked to Ice released in 2013, page 26. Life Linked to Ice: A guide to sea-ice-associated biodiversity in this time of rapid change. CAFF Assessment Series No. 10. Conservation of Arctic Flora and Fauna, Iceland. ISBN: 978-9935-431-25-7.
-
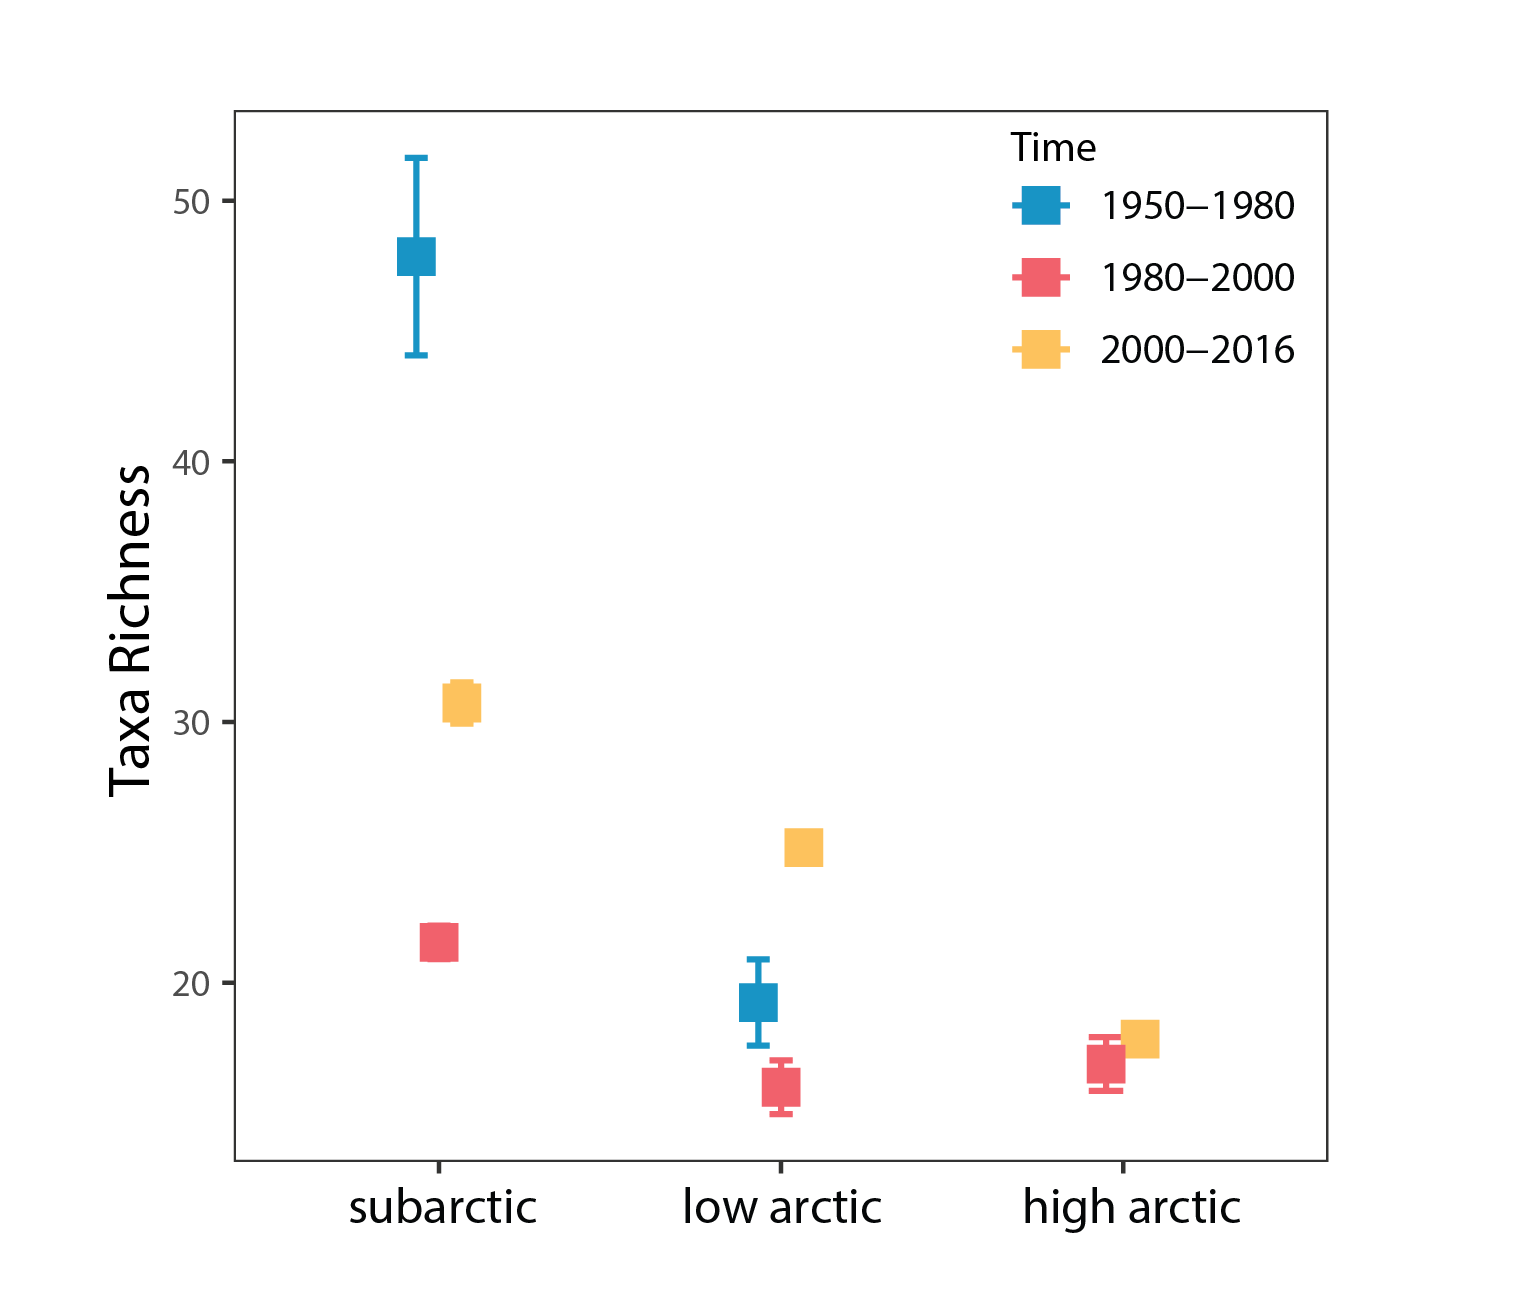
Phytoplankton species richness averaged by time periods ±SE in each Arctic region. State of the Arctic Freshwater Biodiversity Report - Chapter 4 - Page 49 - Figure 4-20
-
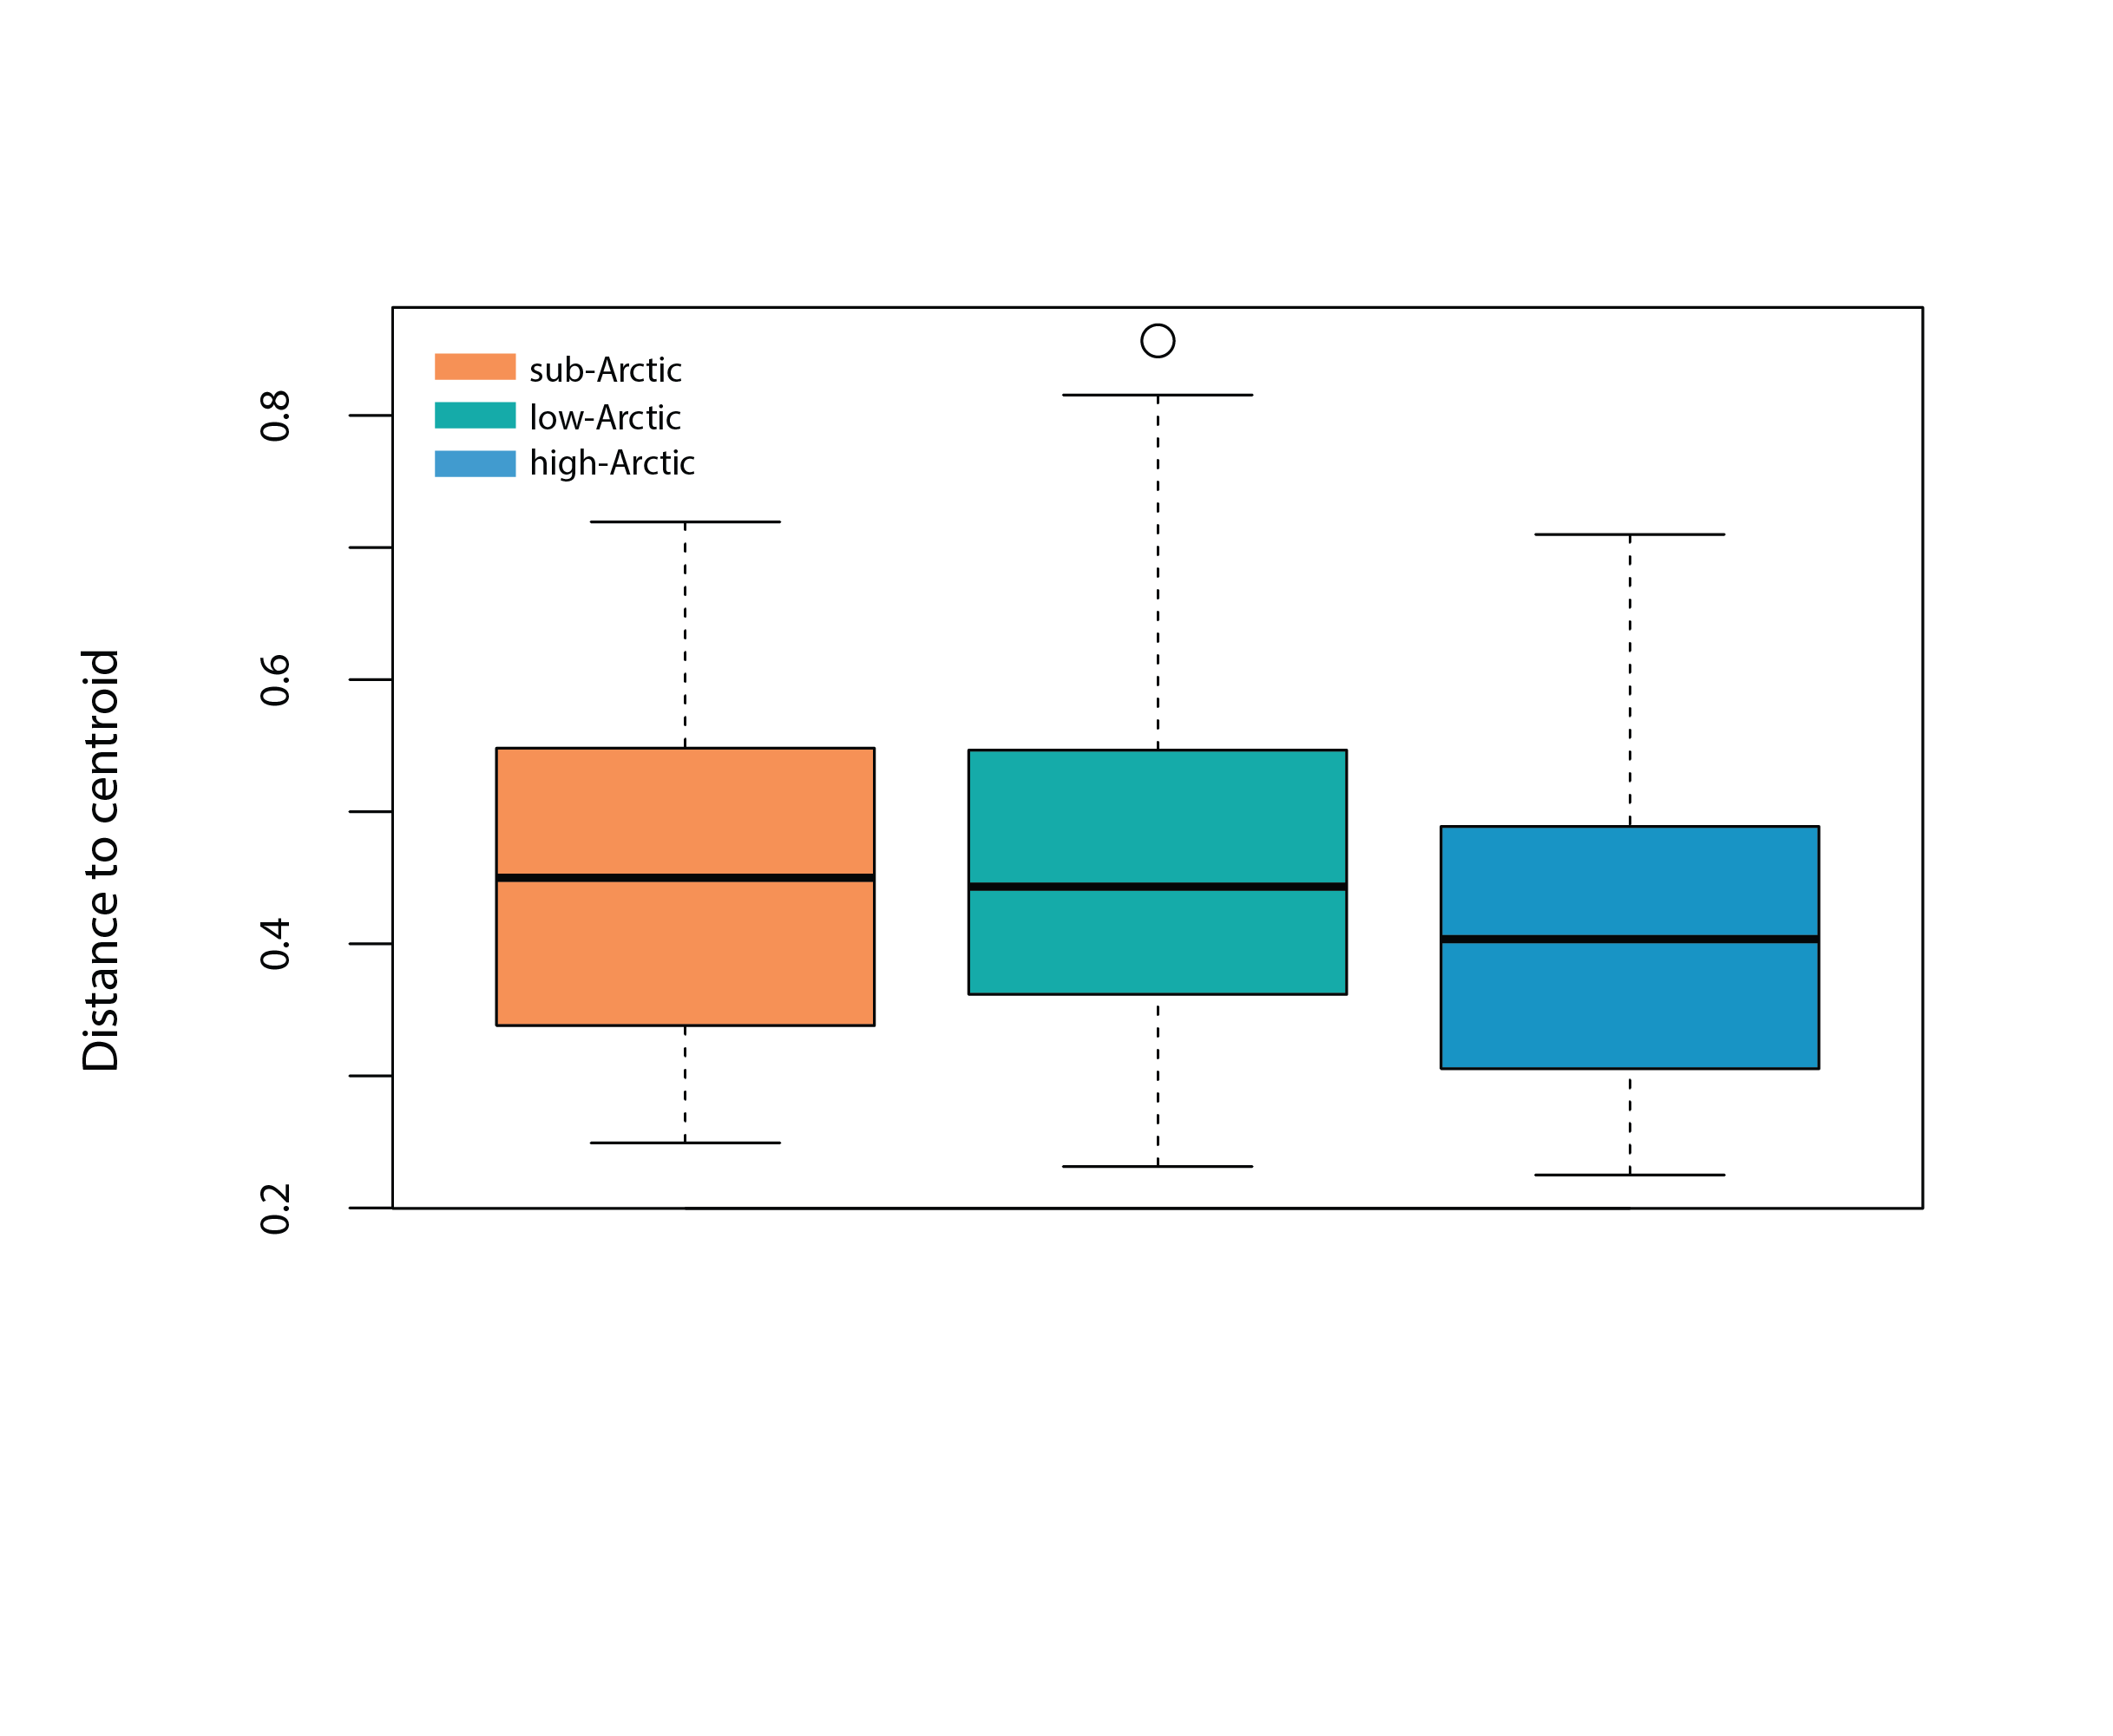
Box plot represents the homogeneity of assemblages in high Arctic (n=190), low Arctic (n=370) and sub-Arctic lakes (n=1151), i.e., the distance of individual lake phytoplankton assemblages to the group centroid in multivariate space. The mean distance to the centroid for each of the regions can be seen as an estimated of beta diversity, with increasing distance equating to greater differences among assemblages. State of the Arctic Freshwater Biodiversity Report - Chapter 4 - Page 48 - Figure 4-18
-
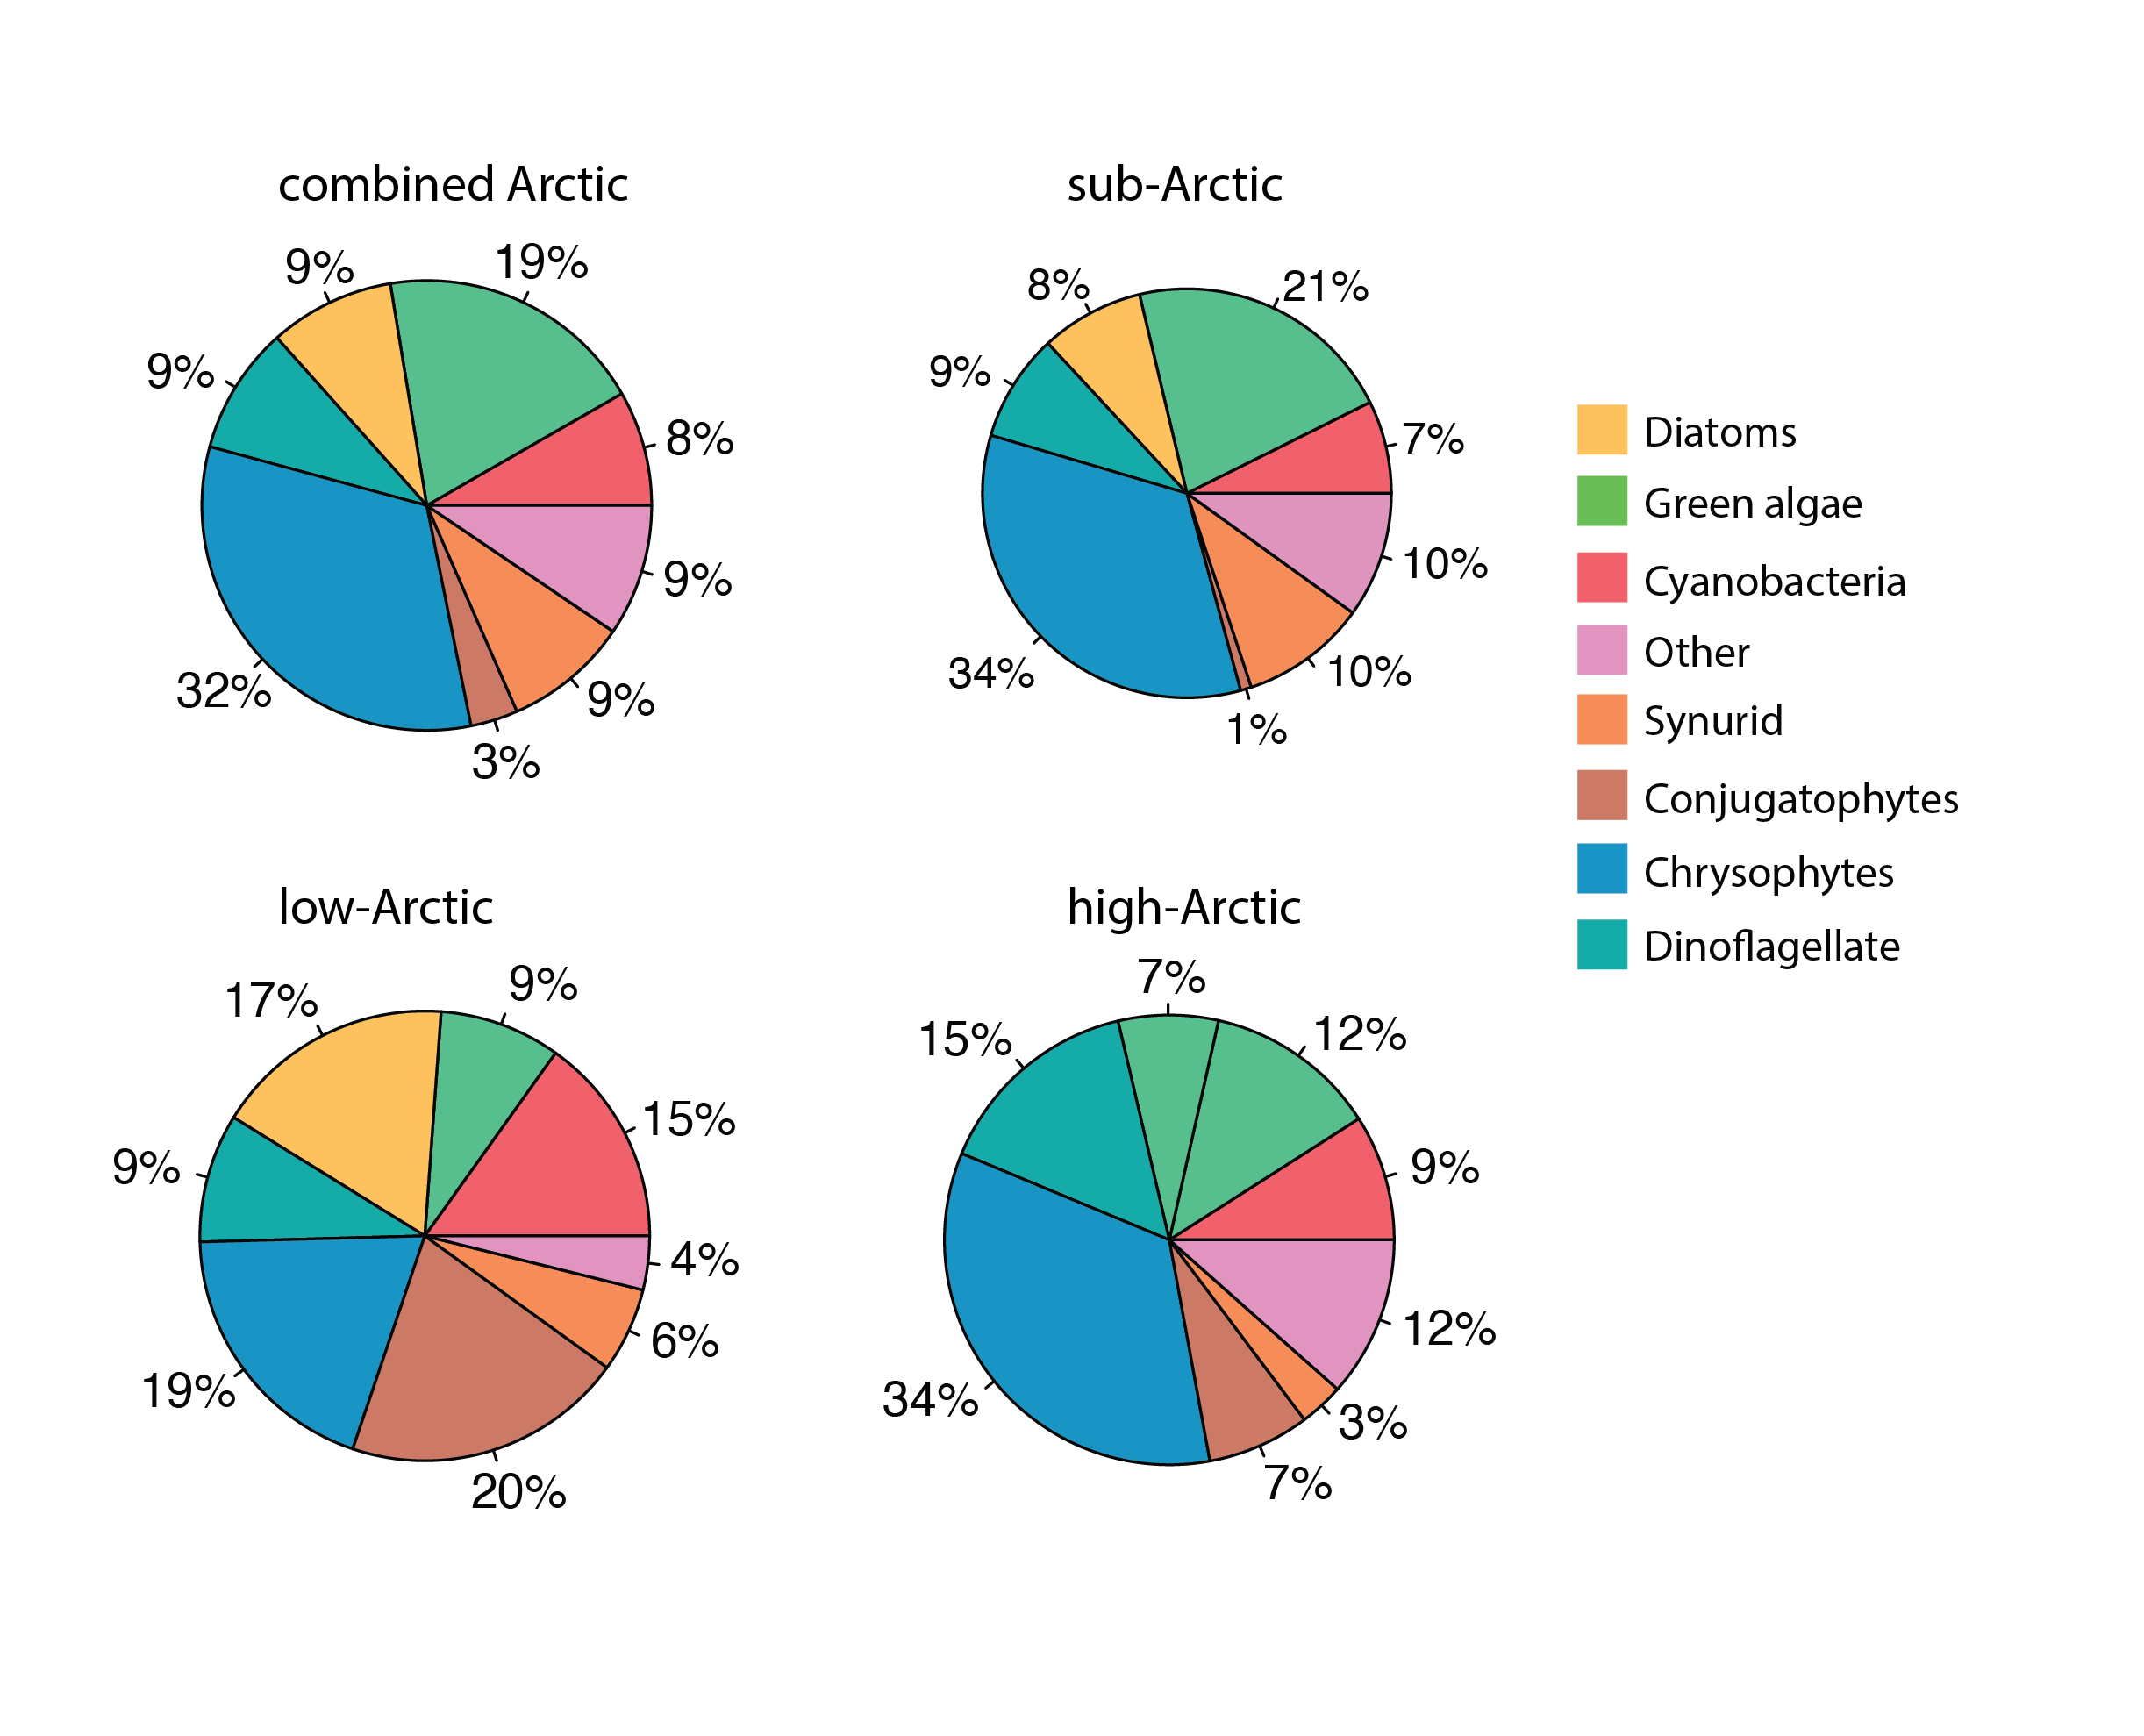
Phytoplankton percent composition by dominant classes across the three Arctic regions, using relative presence across stations calculated from from presence – absence data. State of the Arctic Freshwater Biodiversity Report - Chapter 4 - Page 48 - Figure 4-19
-
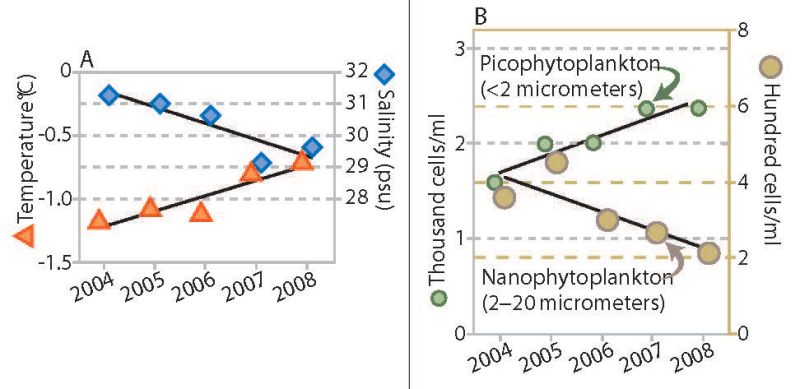
Trends in water temperature and salinity (A) and density of phytoplankton of two size ranges (B), Canada Basin, 2004 to 2008. Stratification of the water column increased throughout the Canada Basin over a recent five-year period, accompanied by a change in phytoplankton communities. The upper ocean layer showed trends of increased temperature and decreased salinity (Figure 18A), which combine to make this layer progressively less dense. The layer of water below this did not change in density over this period (not shown). The larger size class of phytoplankton (which would include diatoms) decreased in abundance, while the smaller types of plankton increased (Figure 18B). In addition to the trends shown, nutrient content in the upper ocean water layer decreased. Abundance of microbes (bacteria and similar organisms) that subsist on organic matter increased. Total phytoplankton biomass, however, remained unchanged. If this trend towards smaller species of phytoplankton and microbes is sustained, it may lead to reduced production of zooplankton, an impact that would be transmitted through the food web to birds, fish and mammals. Published in the Life Linked to Ice released in 2013, page 30. Life Linked to Ice: A guide to sea-ice-associated biodiversity in this time of rapid change. CAFF Assessment Series No. 10. Conservation of Arctic Flora and Fauna, Iceland. ISBN: 978-9935-431-25-7.
-
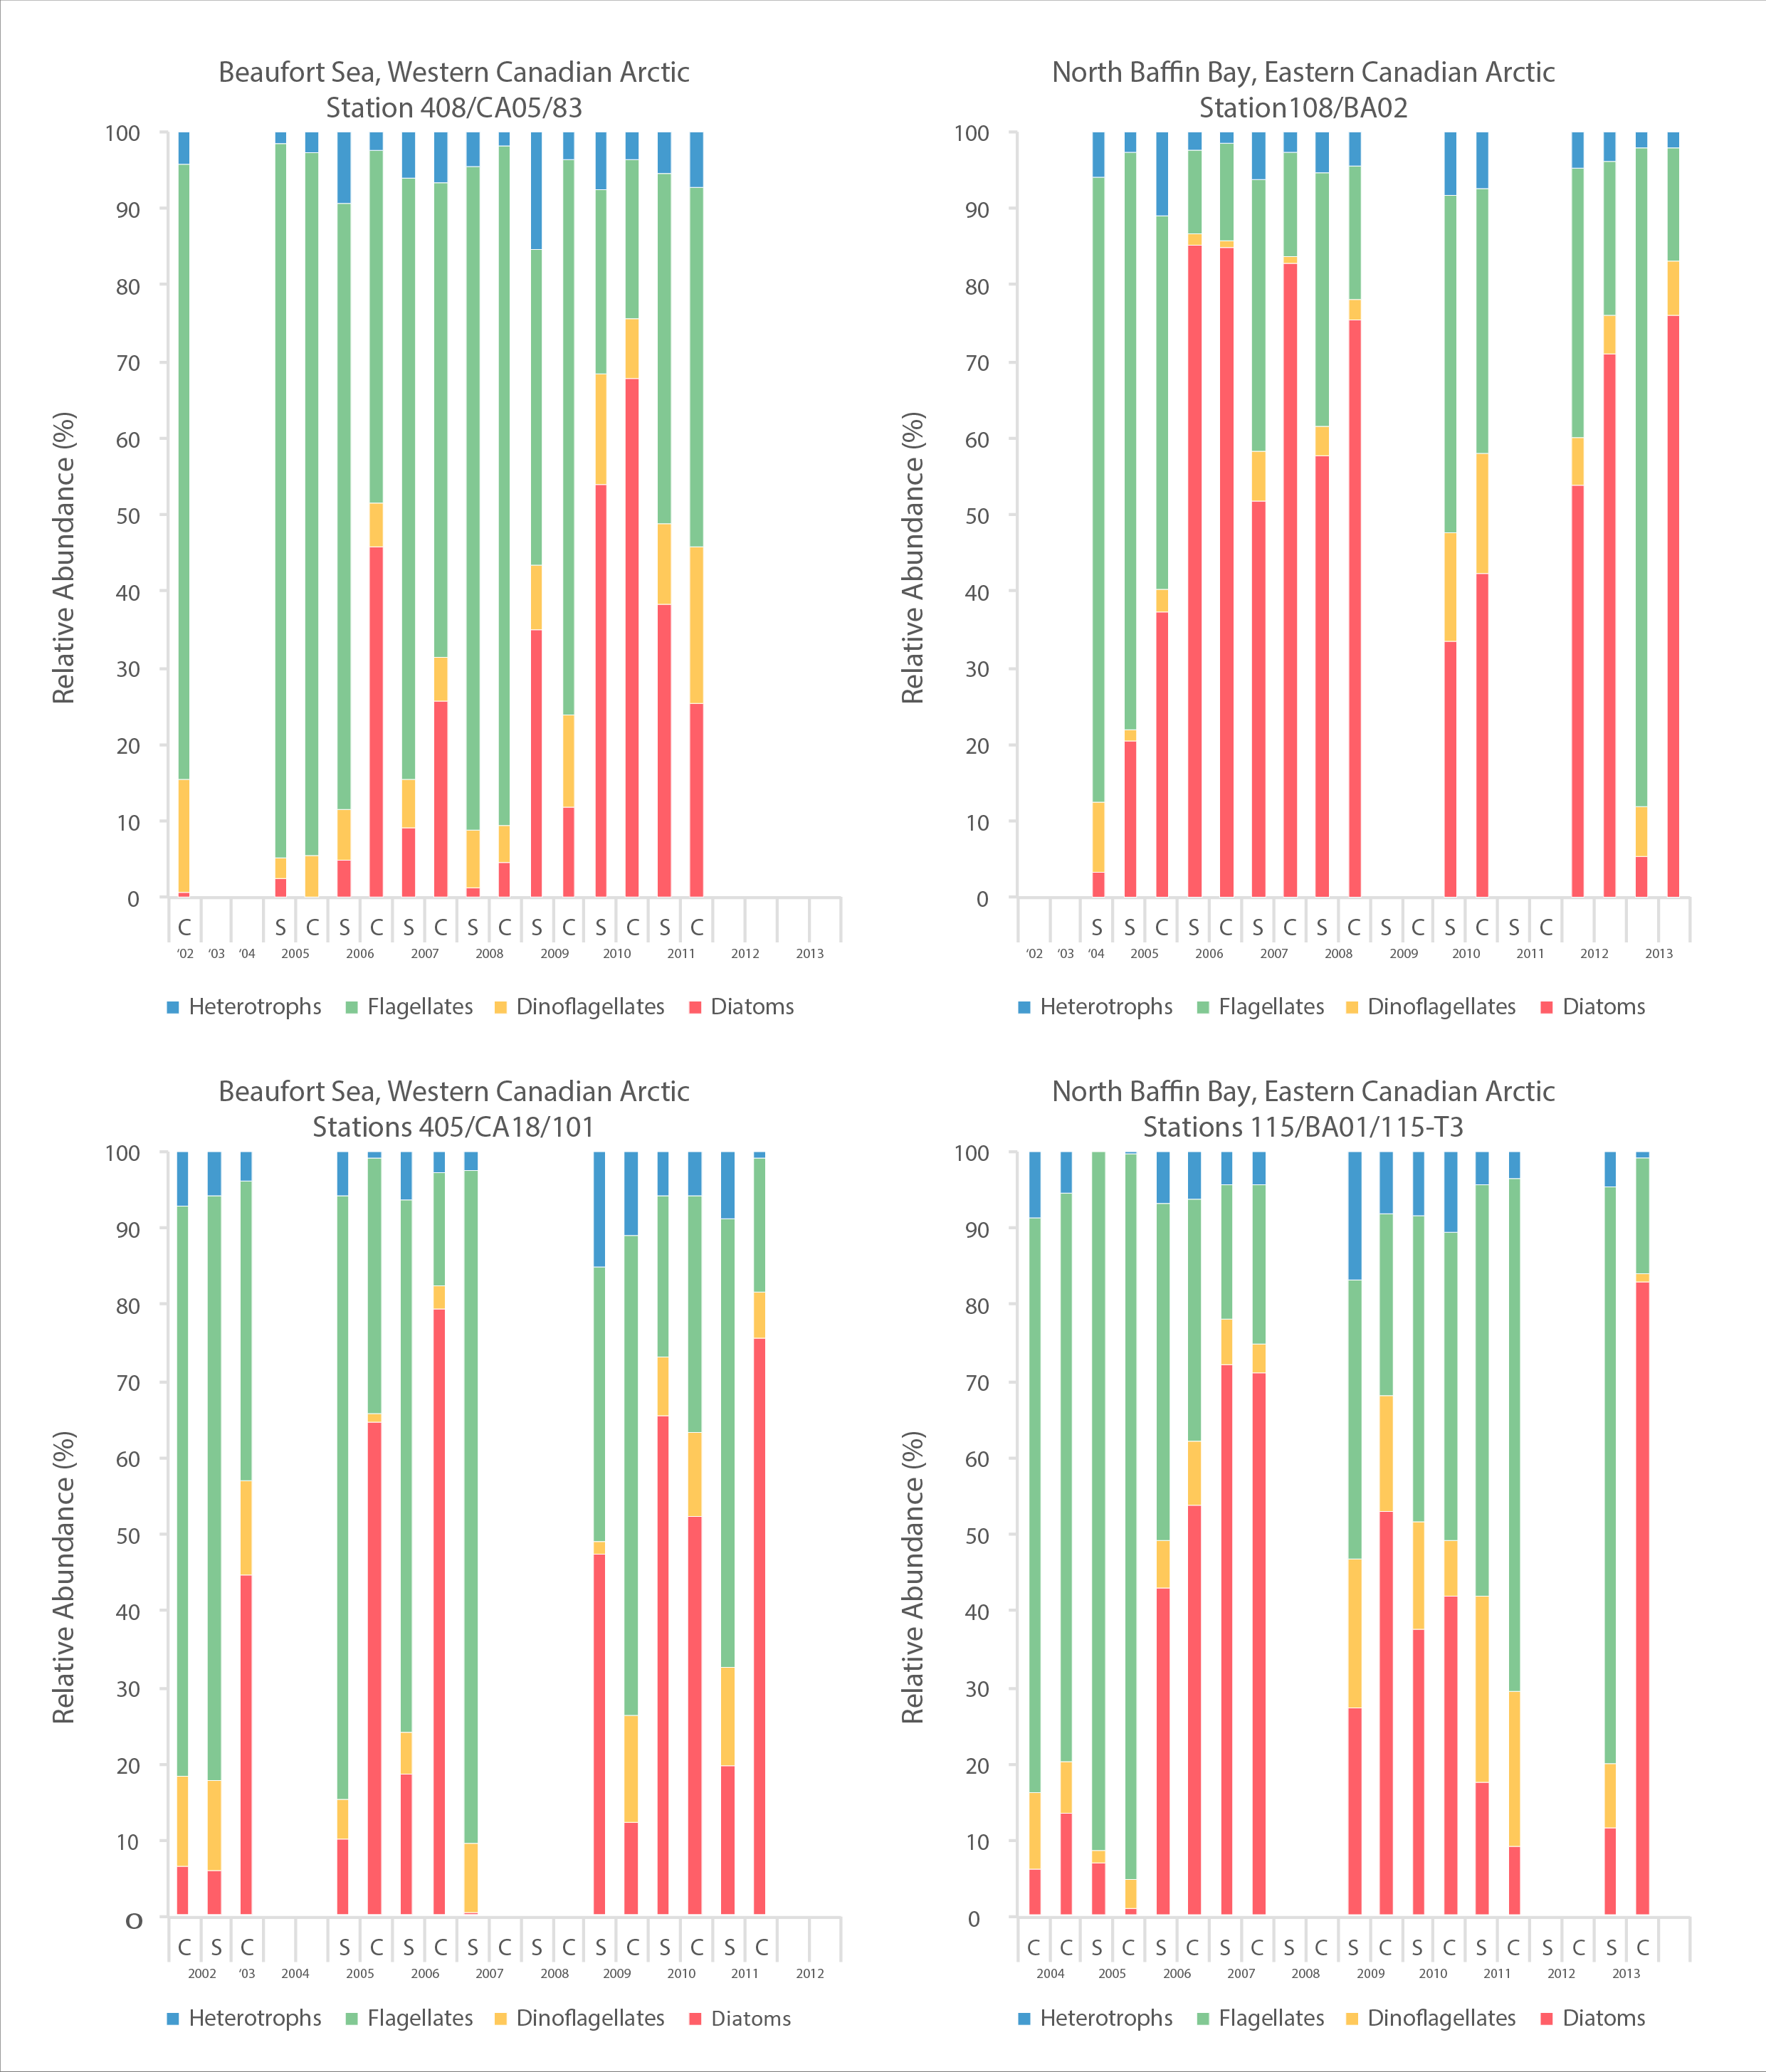
A time series of cell abundances, as determined by microscopy, of major phytoplankton groups from 2002-2013 for four sites, two in an east-west transect in Amundsen Gulf, Beaufort Sea and two in an east-west transect in northern Baffin Bay. STATE OF THE ARCTIC MARINE BIODIVERSITY REPORT - <a href="https://arcticbiodiversity.is/findings/plankton" target="_blank">Chapter 3</a> - Page 73 - Figure 3.2.4 A time series of cell abundances, as determined by microscopy, of major phytoplankton groups from 2002-2013 for four sites, 2 in the Beaufort Sea and 2 in northern Baffin Bay. Cell abundances are given as cells per liter. On most sampling dates, there is data from surface water and from the subsurface chlorophyll maximum (Cmax in the spreadsheet). Some additional information is included in the column headings, such as the percent of light at the sample depth; however, this should not be included in the figure. You may or may not want to include a map element in this figure, and rough coordinates of the sampling sites are included. The second sheet of the excel file presents the same data but at a finer scale of taxonomic resolution. It is the first sheet that should be used.