 CAFF - Arctic Biodiversity Data Service (ABDS)
diatoms
Type of resources
Available actions
Topics
Keywords
Contact for the resource
Provided by
Representation types
Update frequencies
status
-
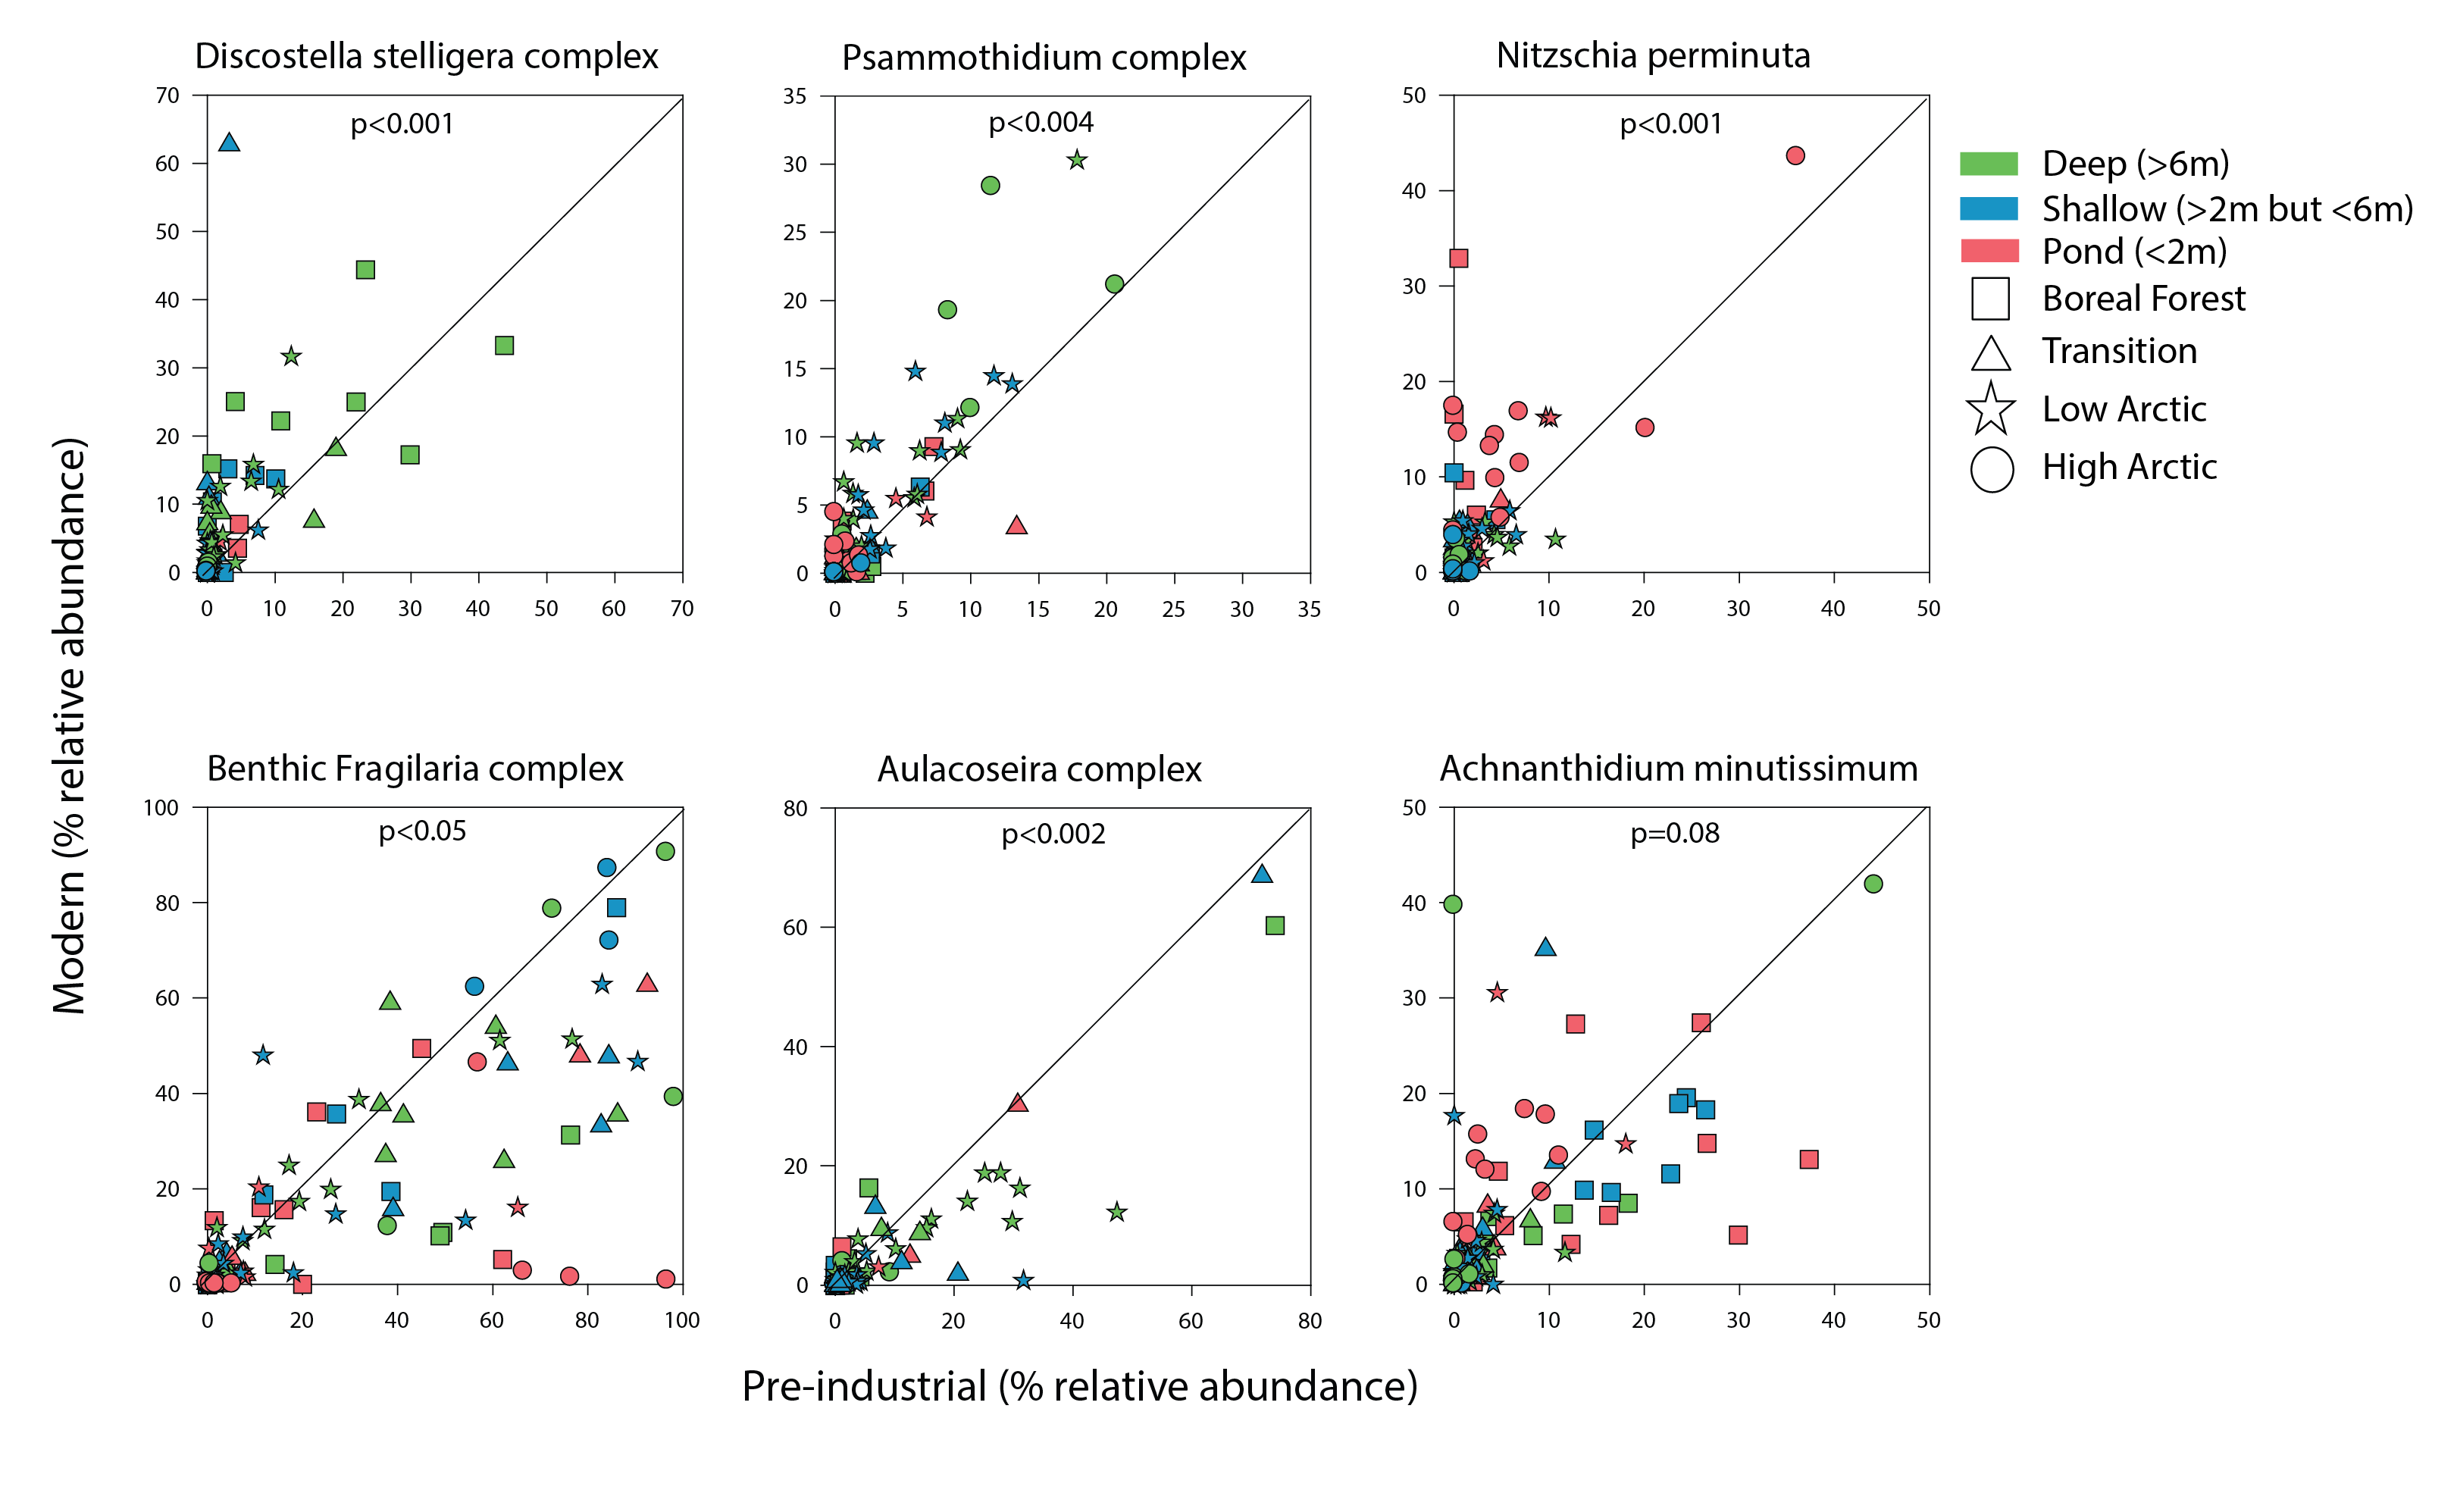
Figure 4 15 Comparison of the relative abundance of select diatom taxonomic groups between core bottoms (pre-industrial sediments; x- axis) and core tops (modern sediments; y-axis) with a 1:1 line to indicate whether there were higher abundances in fossil samples (below red line) or modern samples (above red line). State of the Arctic Freshwater Biodiversity Report - Chapter 2 - Page 15 - Figure 2-1
-
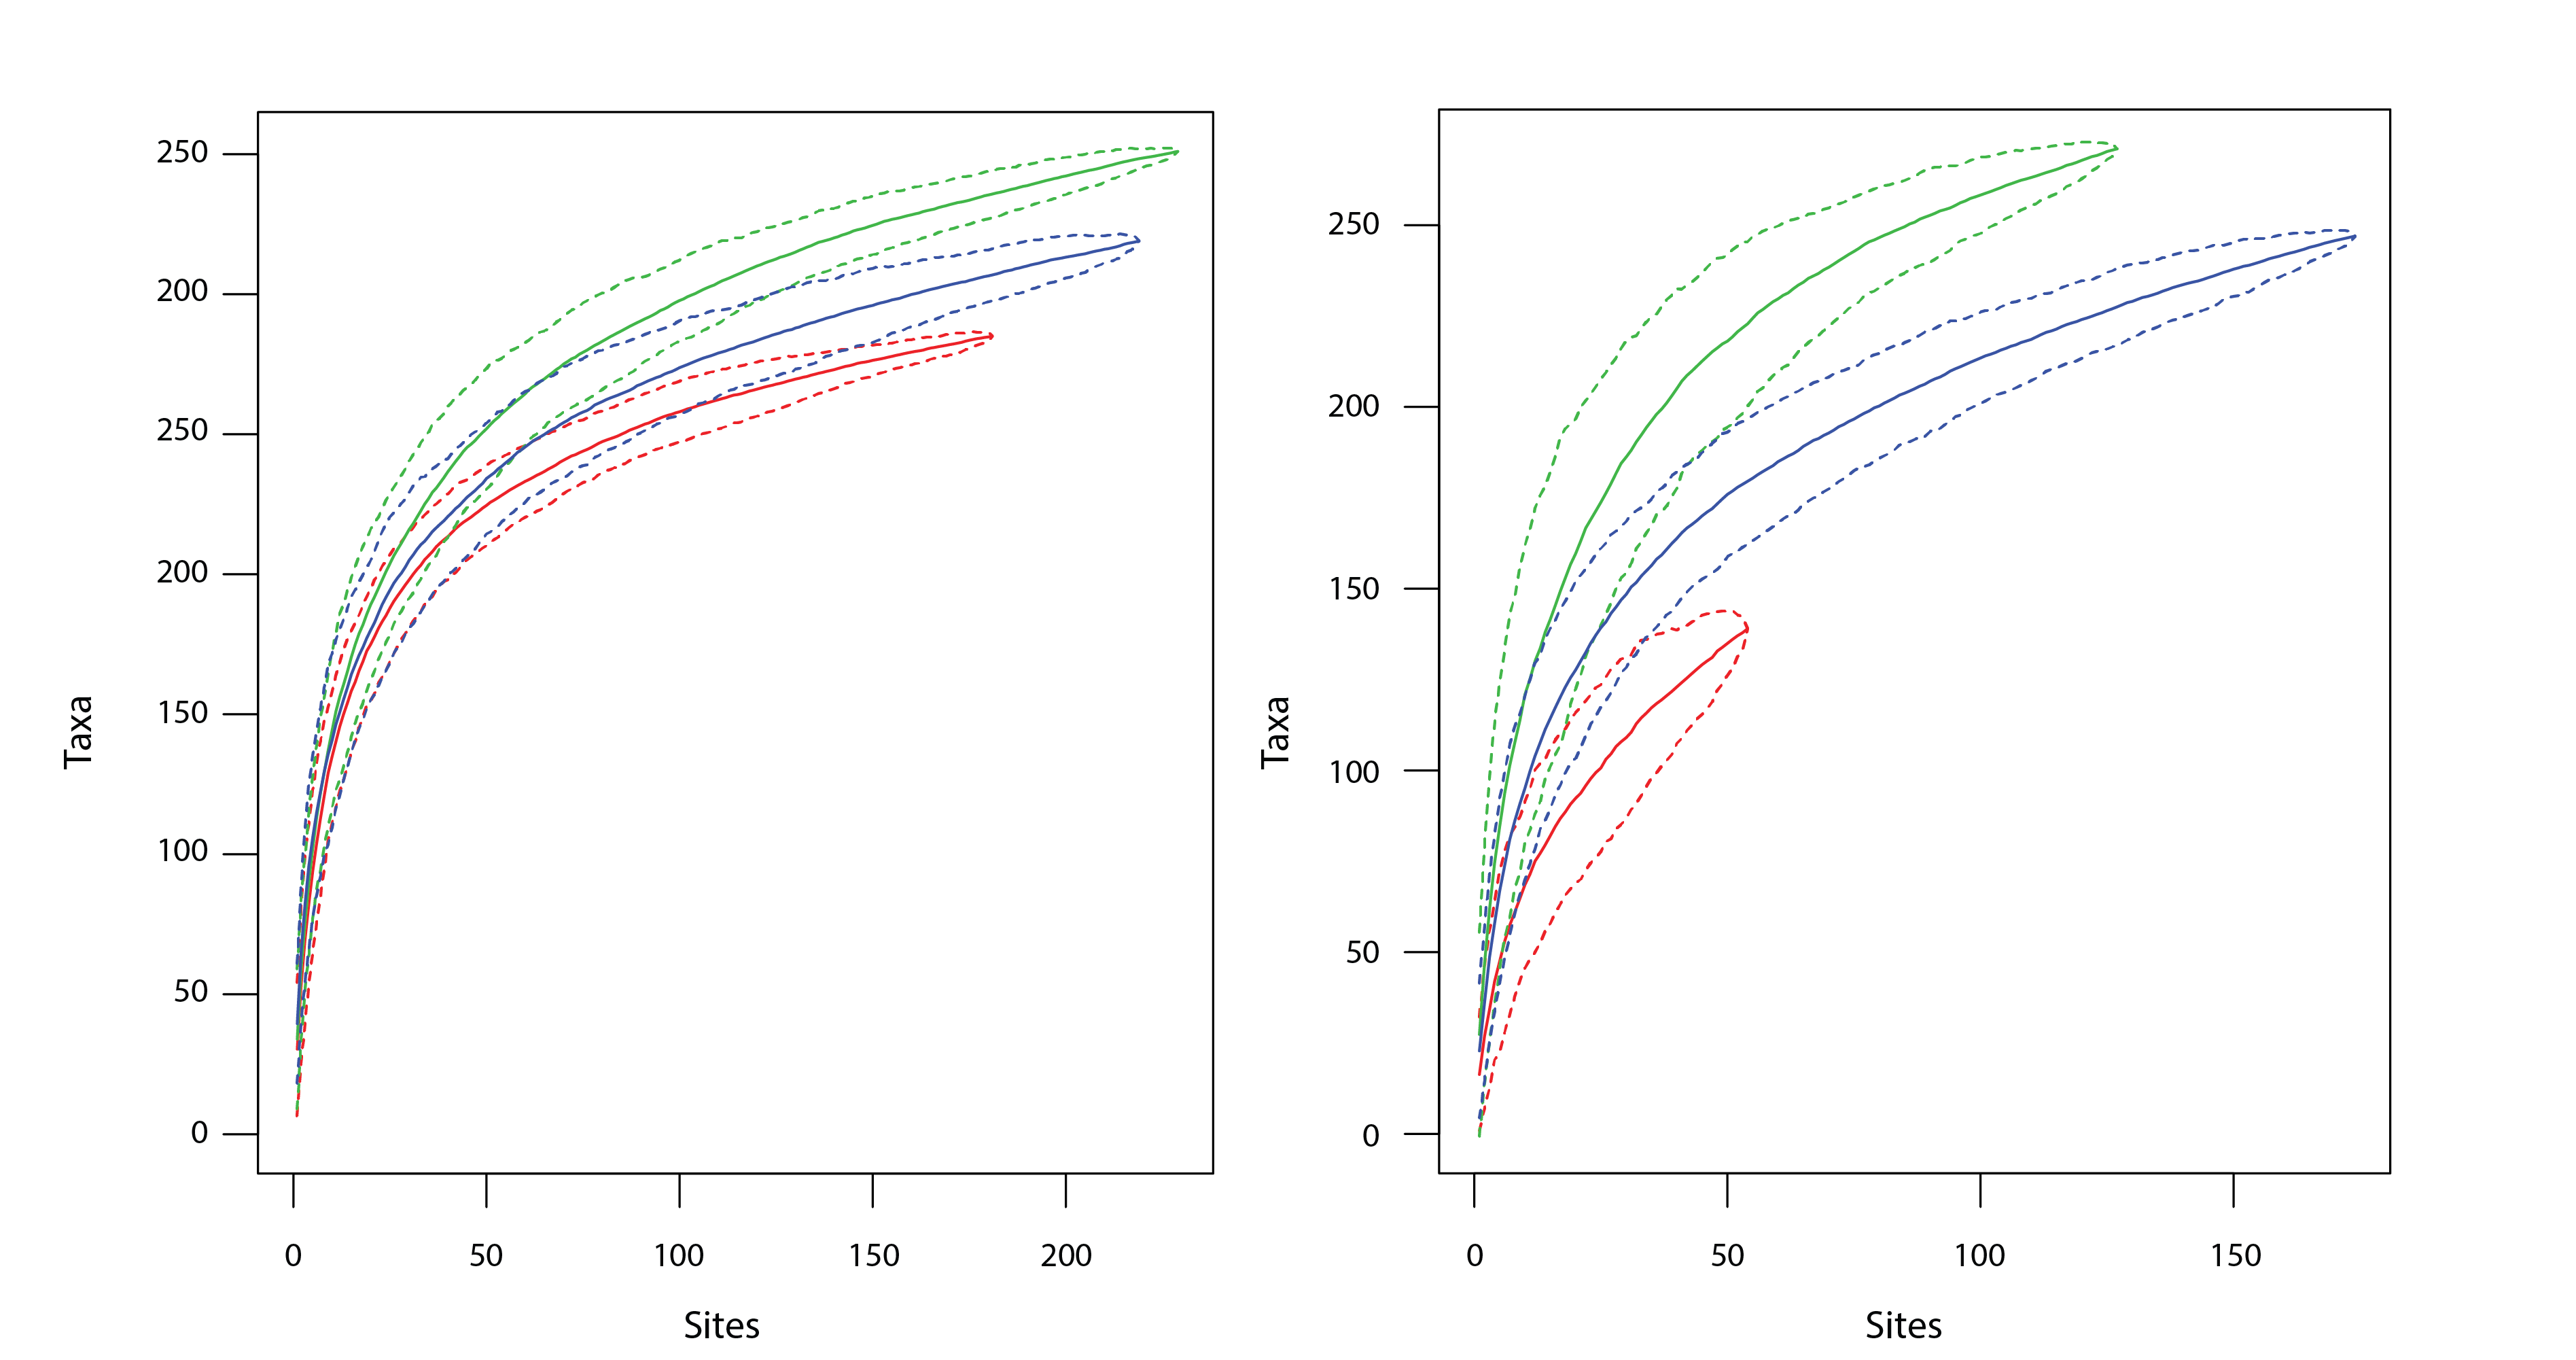
Taxa accumulation curves for (left) lake surface sediment samples, and (right) stream scrapes across the sub-Arctic (blue), Low Arctic (green) and High Arctic (red) ABA Arctic zones. Dashed lines represent the bounds of the 95% confidence interval of the estimate. State of the Arctic Freshwater Biodiversity Report - Chapter 4 - Page 38 - Figure 4-11
-
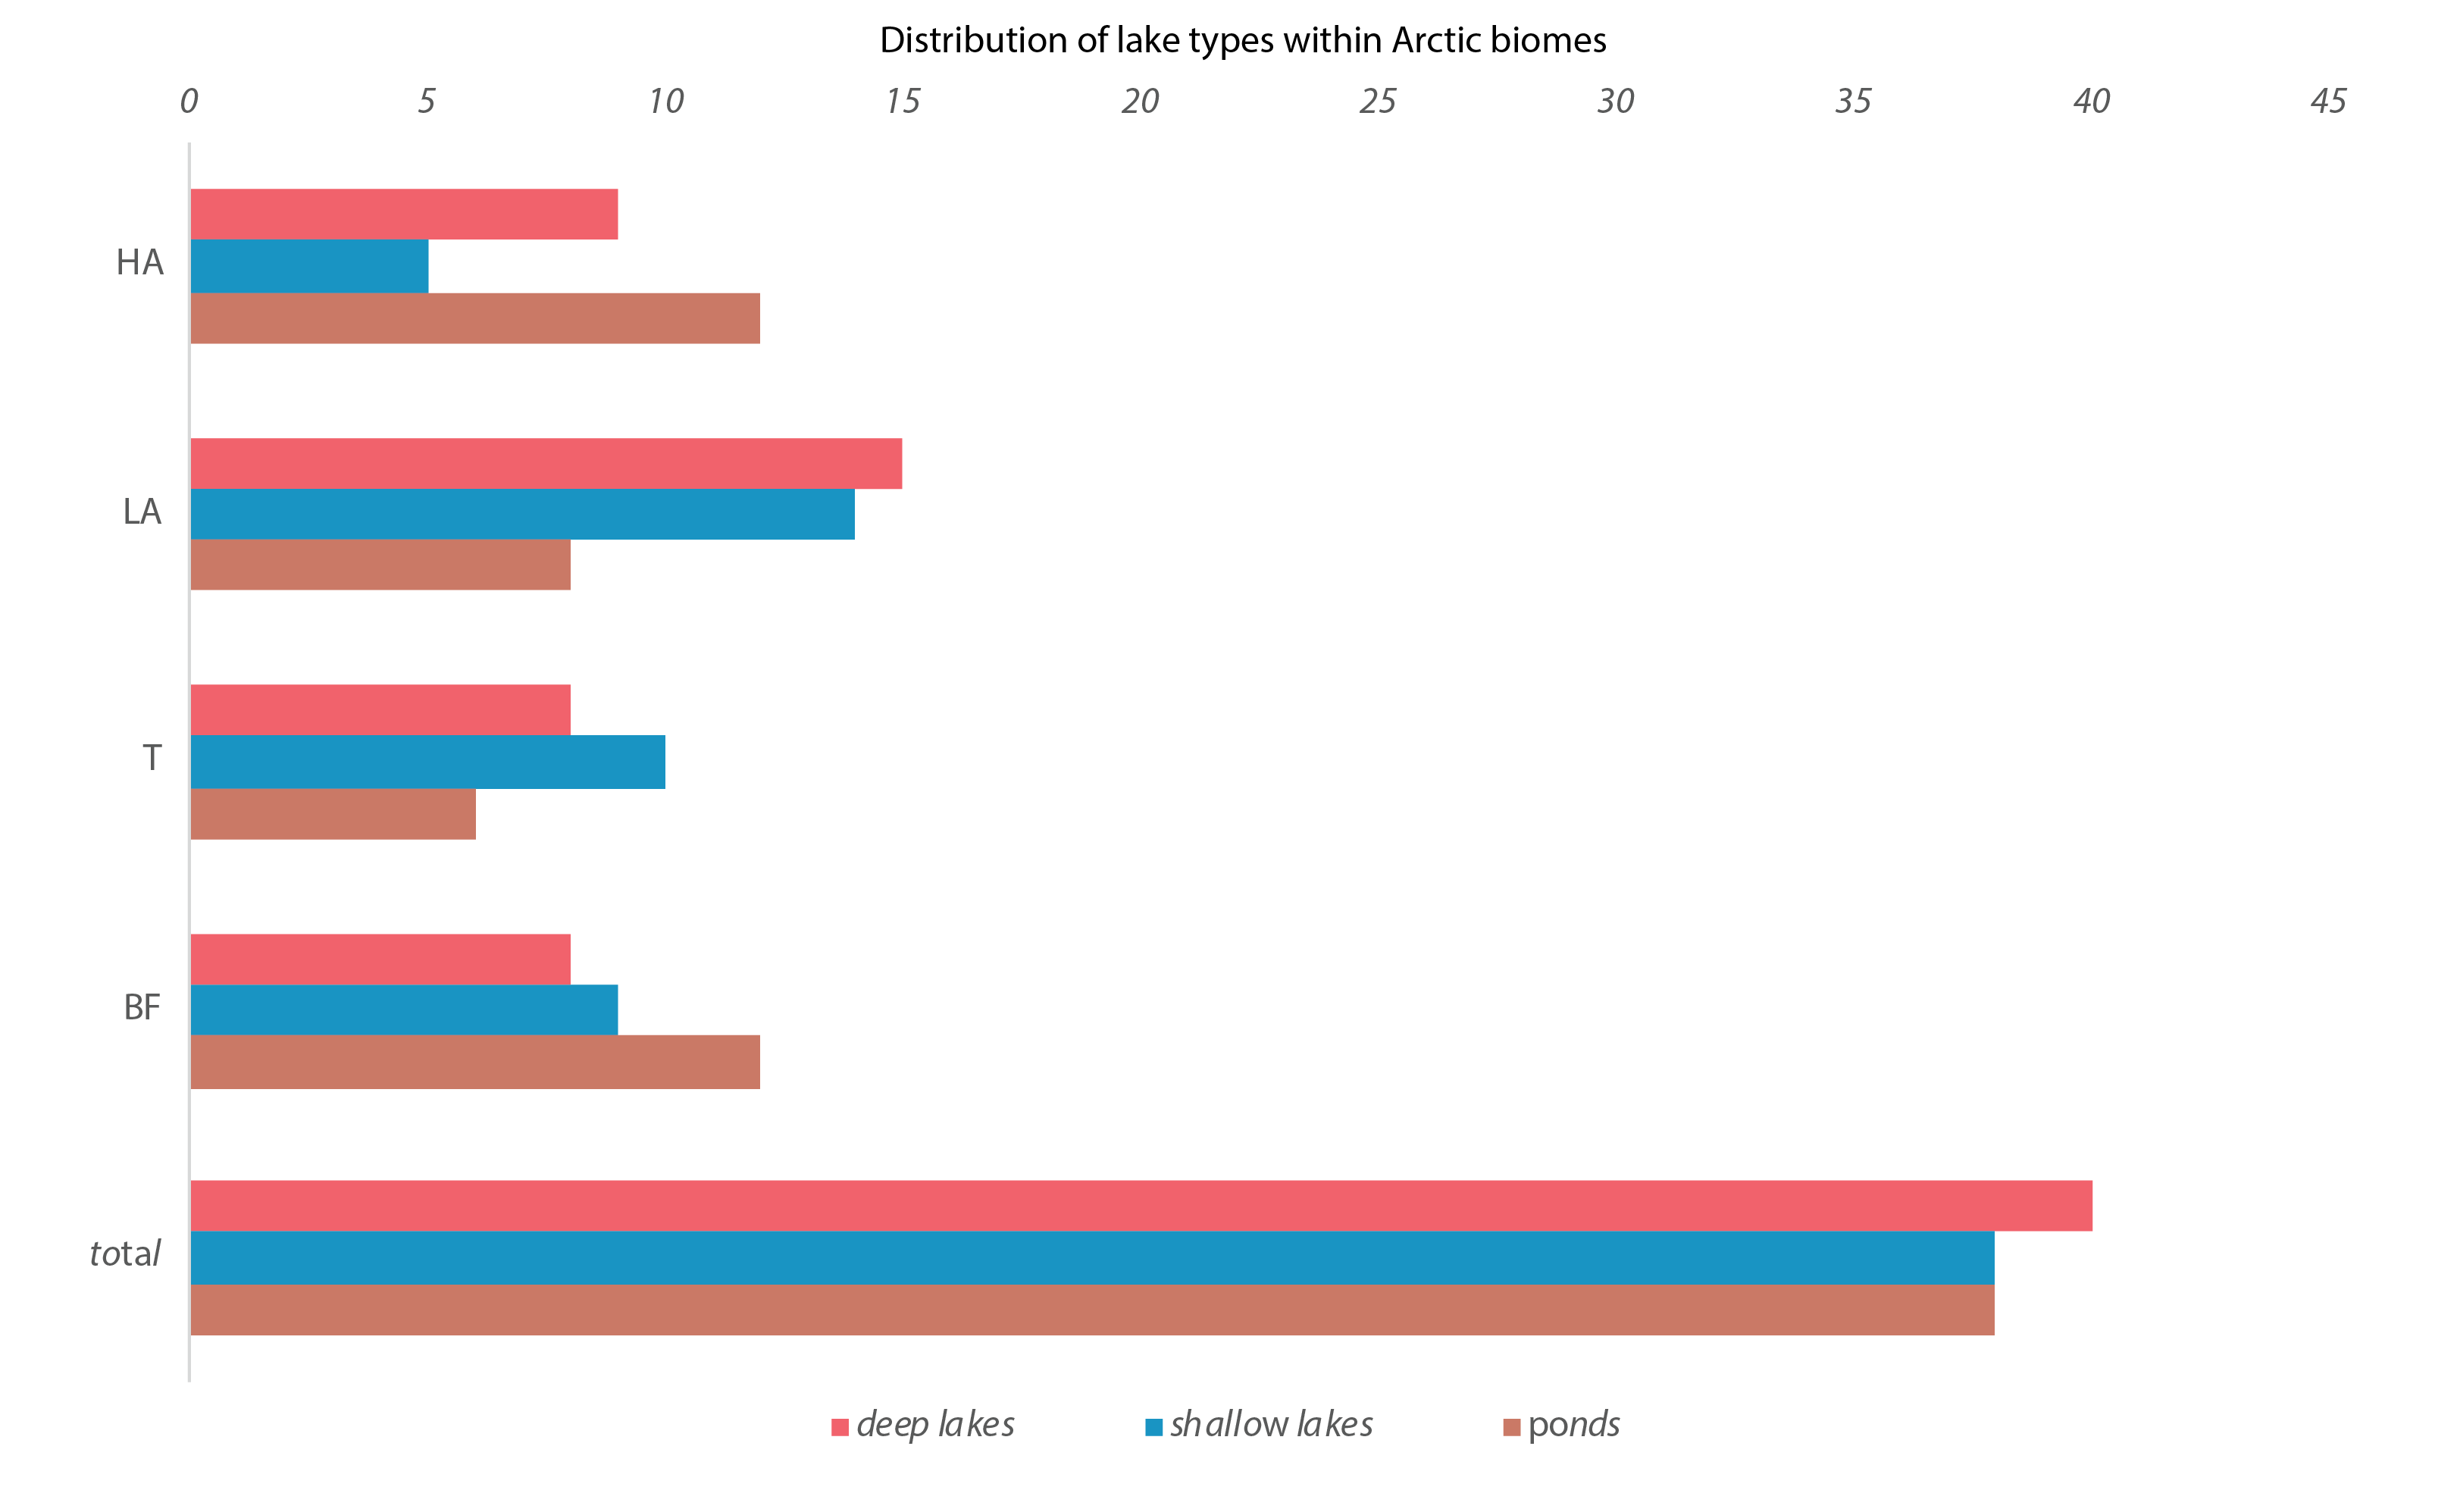
Figure 4-13 Number of deep lakes (red), shallow lakes (blue), and ponds (brown) in each geographical zone (BF, T, LA, HA). BF = Boreal Forest, T =Transition Zone, LA = Low Arctic, HA = High Arctic. State of the Arctic Freshwater Biodiversity Report - Chapter 4 - Page 40 - Figure 4-13
-
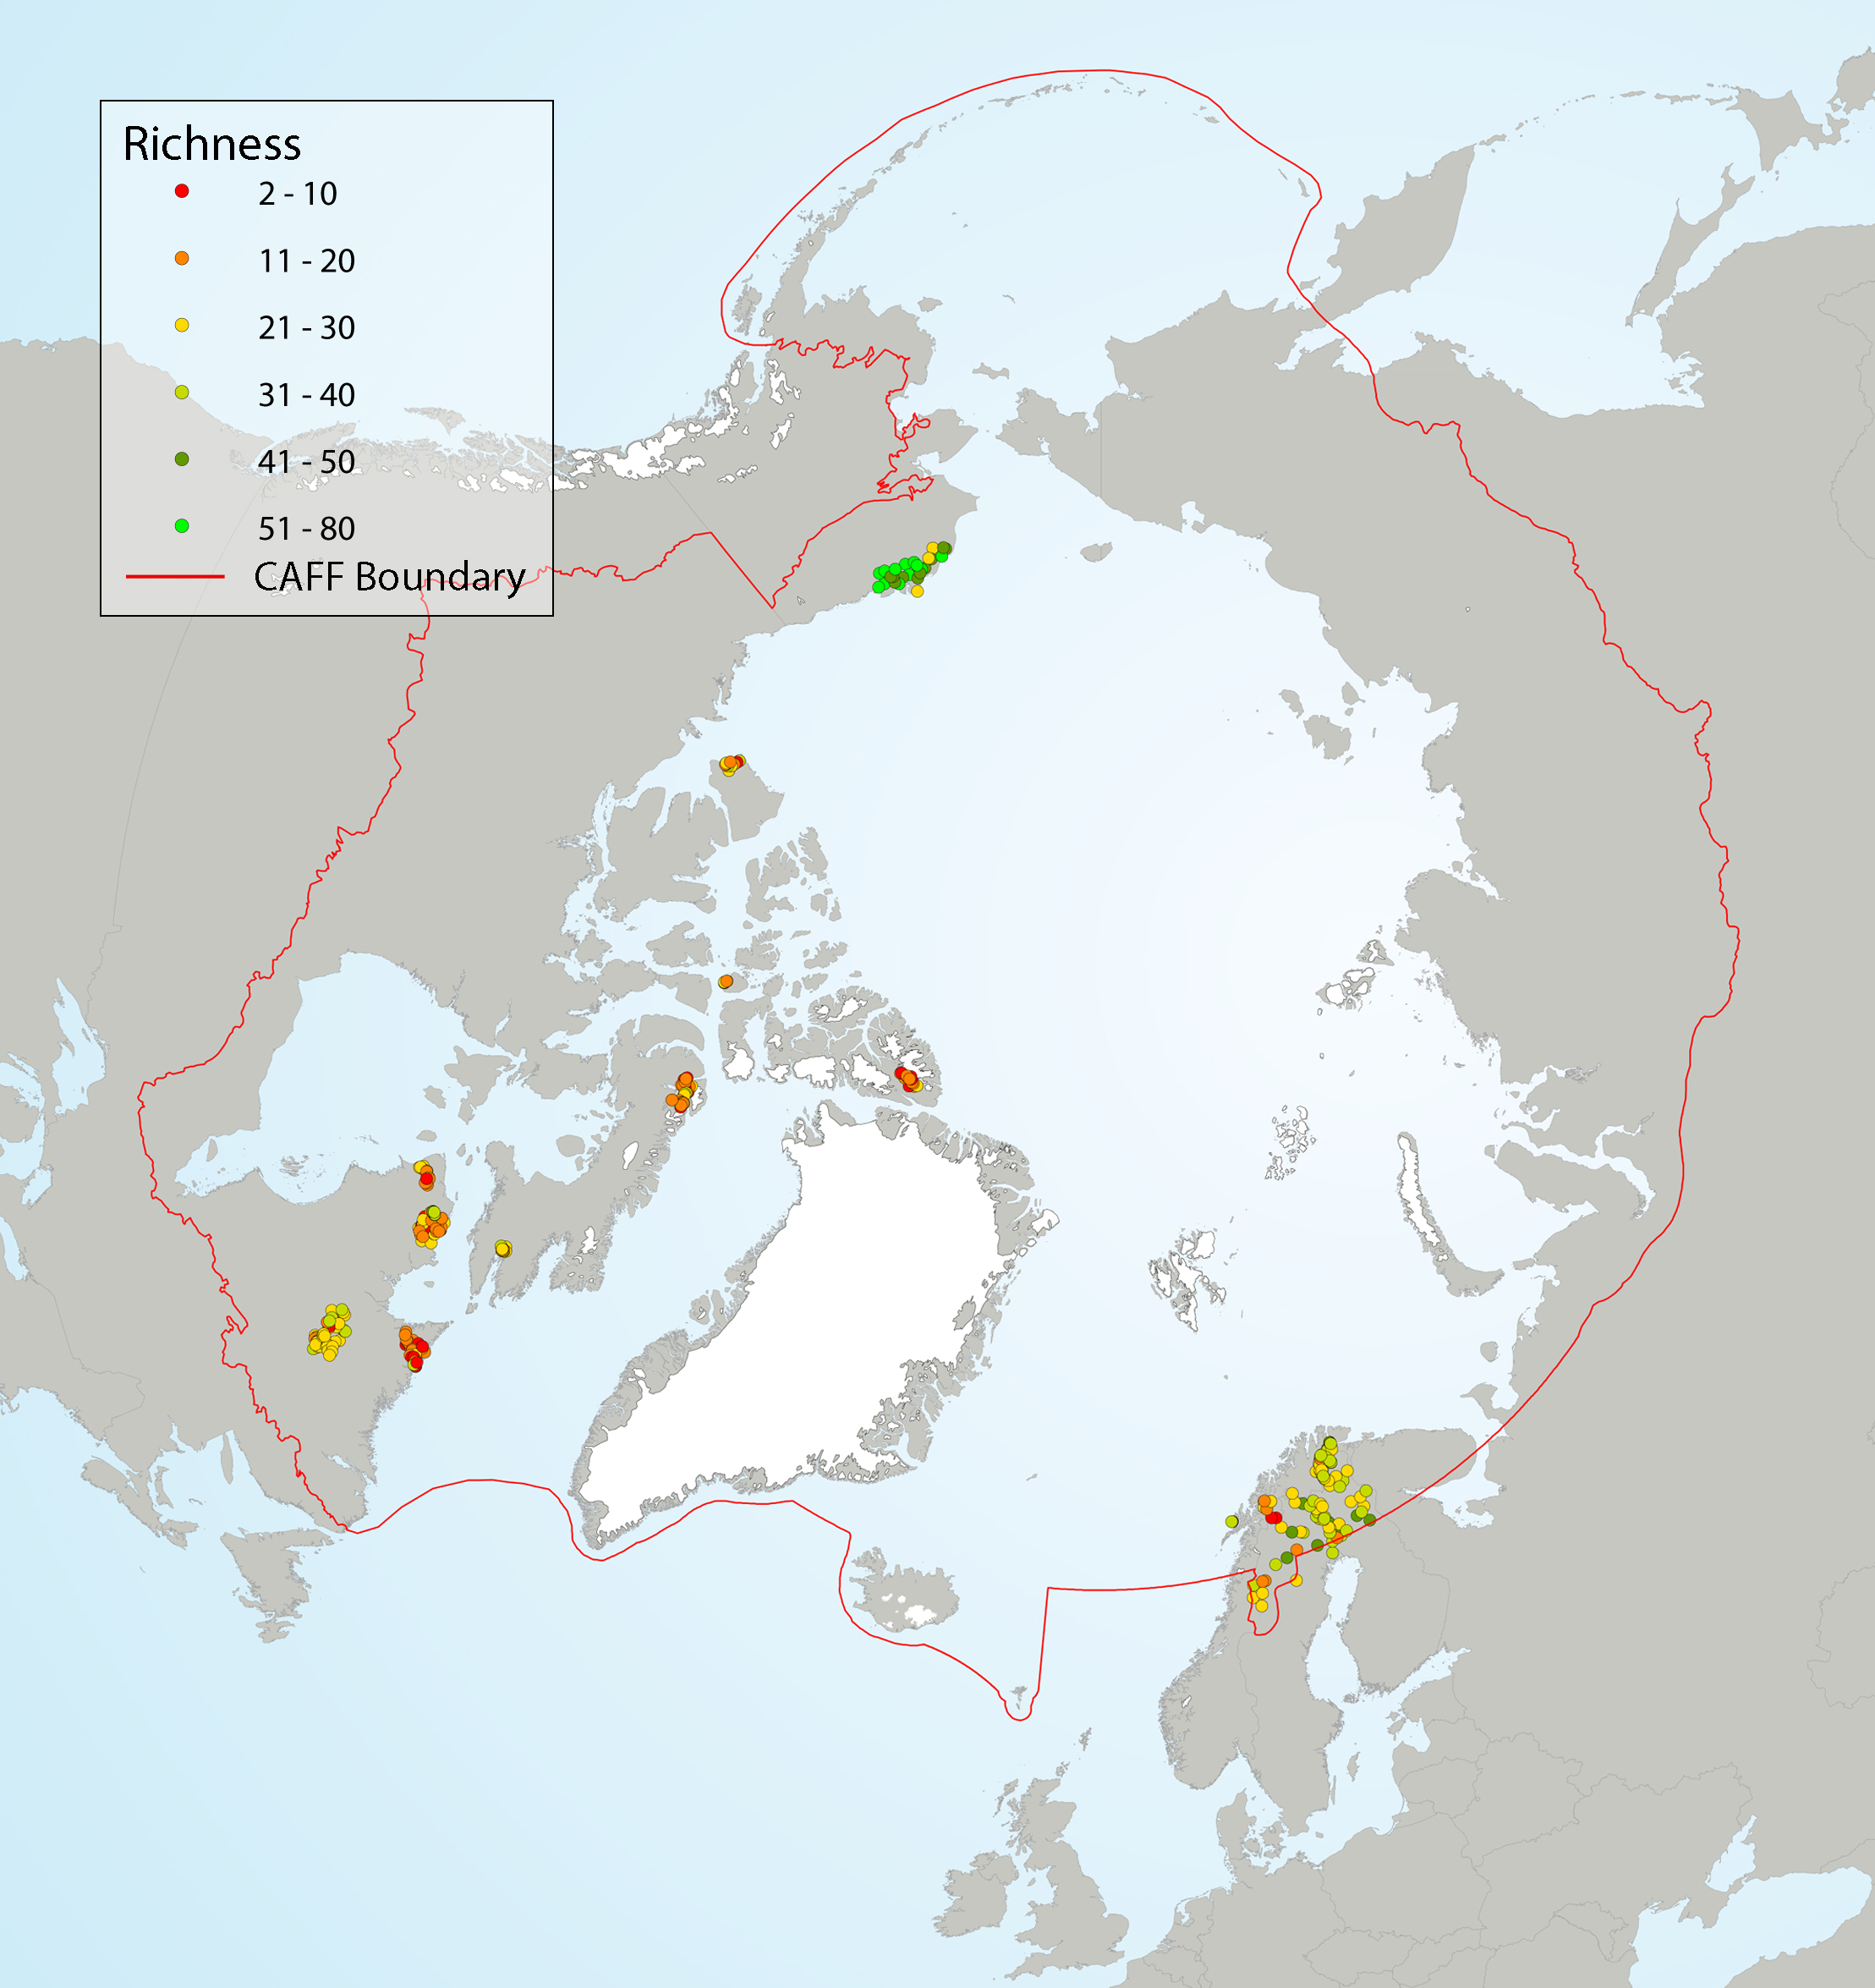
Local diatom species richness of Arctic diatom assemblages from stream scrapes, showing (left) richness as a function of latitude, and (right) site-specific richness. A LOESS smoother (blue line) with a span of 0.75 and a 95% confidence interval (grey shading) was applied to the data (left) to better highlight the general trend. Coloured circles on the map indicate species richness at the sampling sites. State of the Arctic Freshwater Biodiversity Report - Chapter 4 - Page 37 - Figure 4-10
-
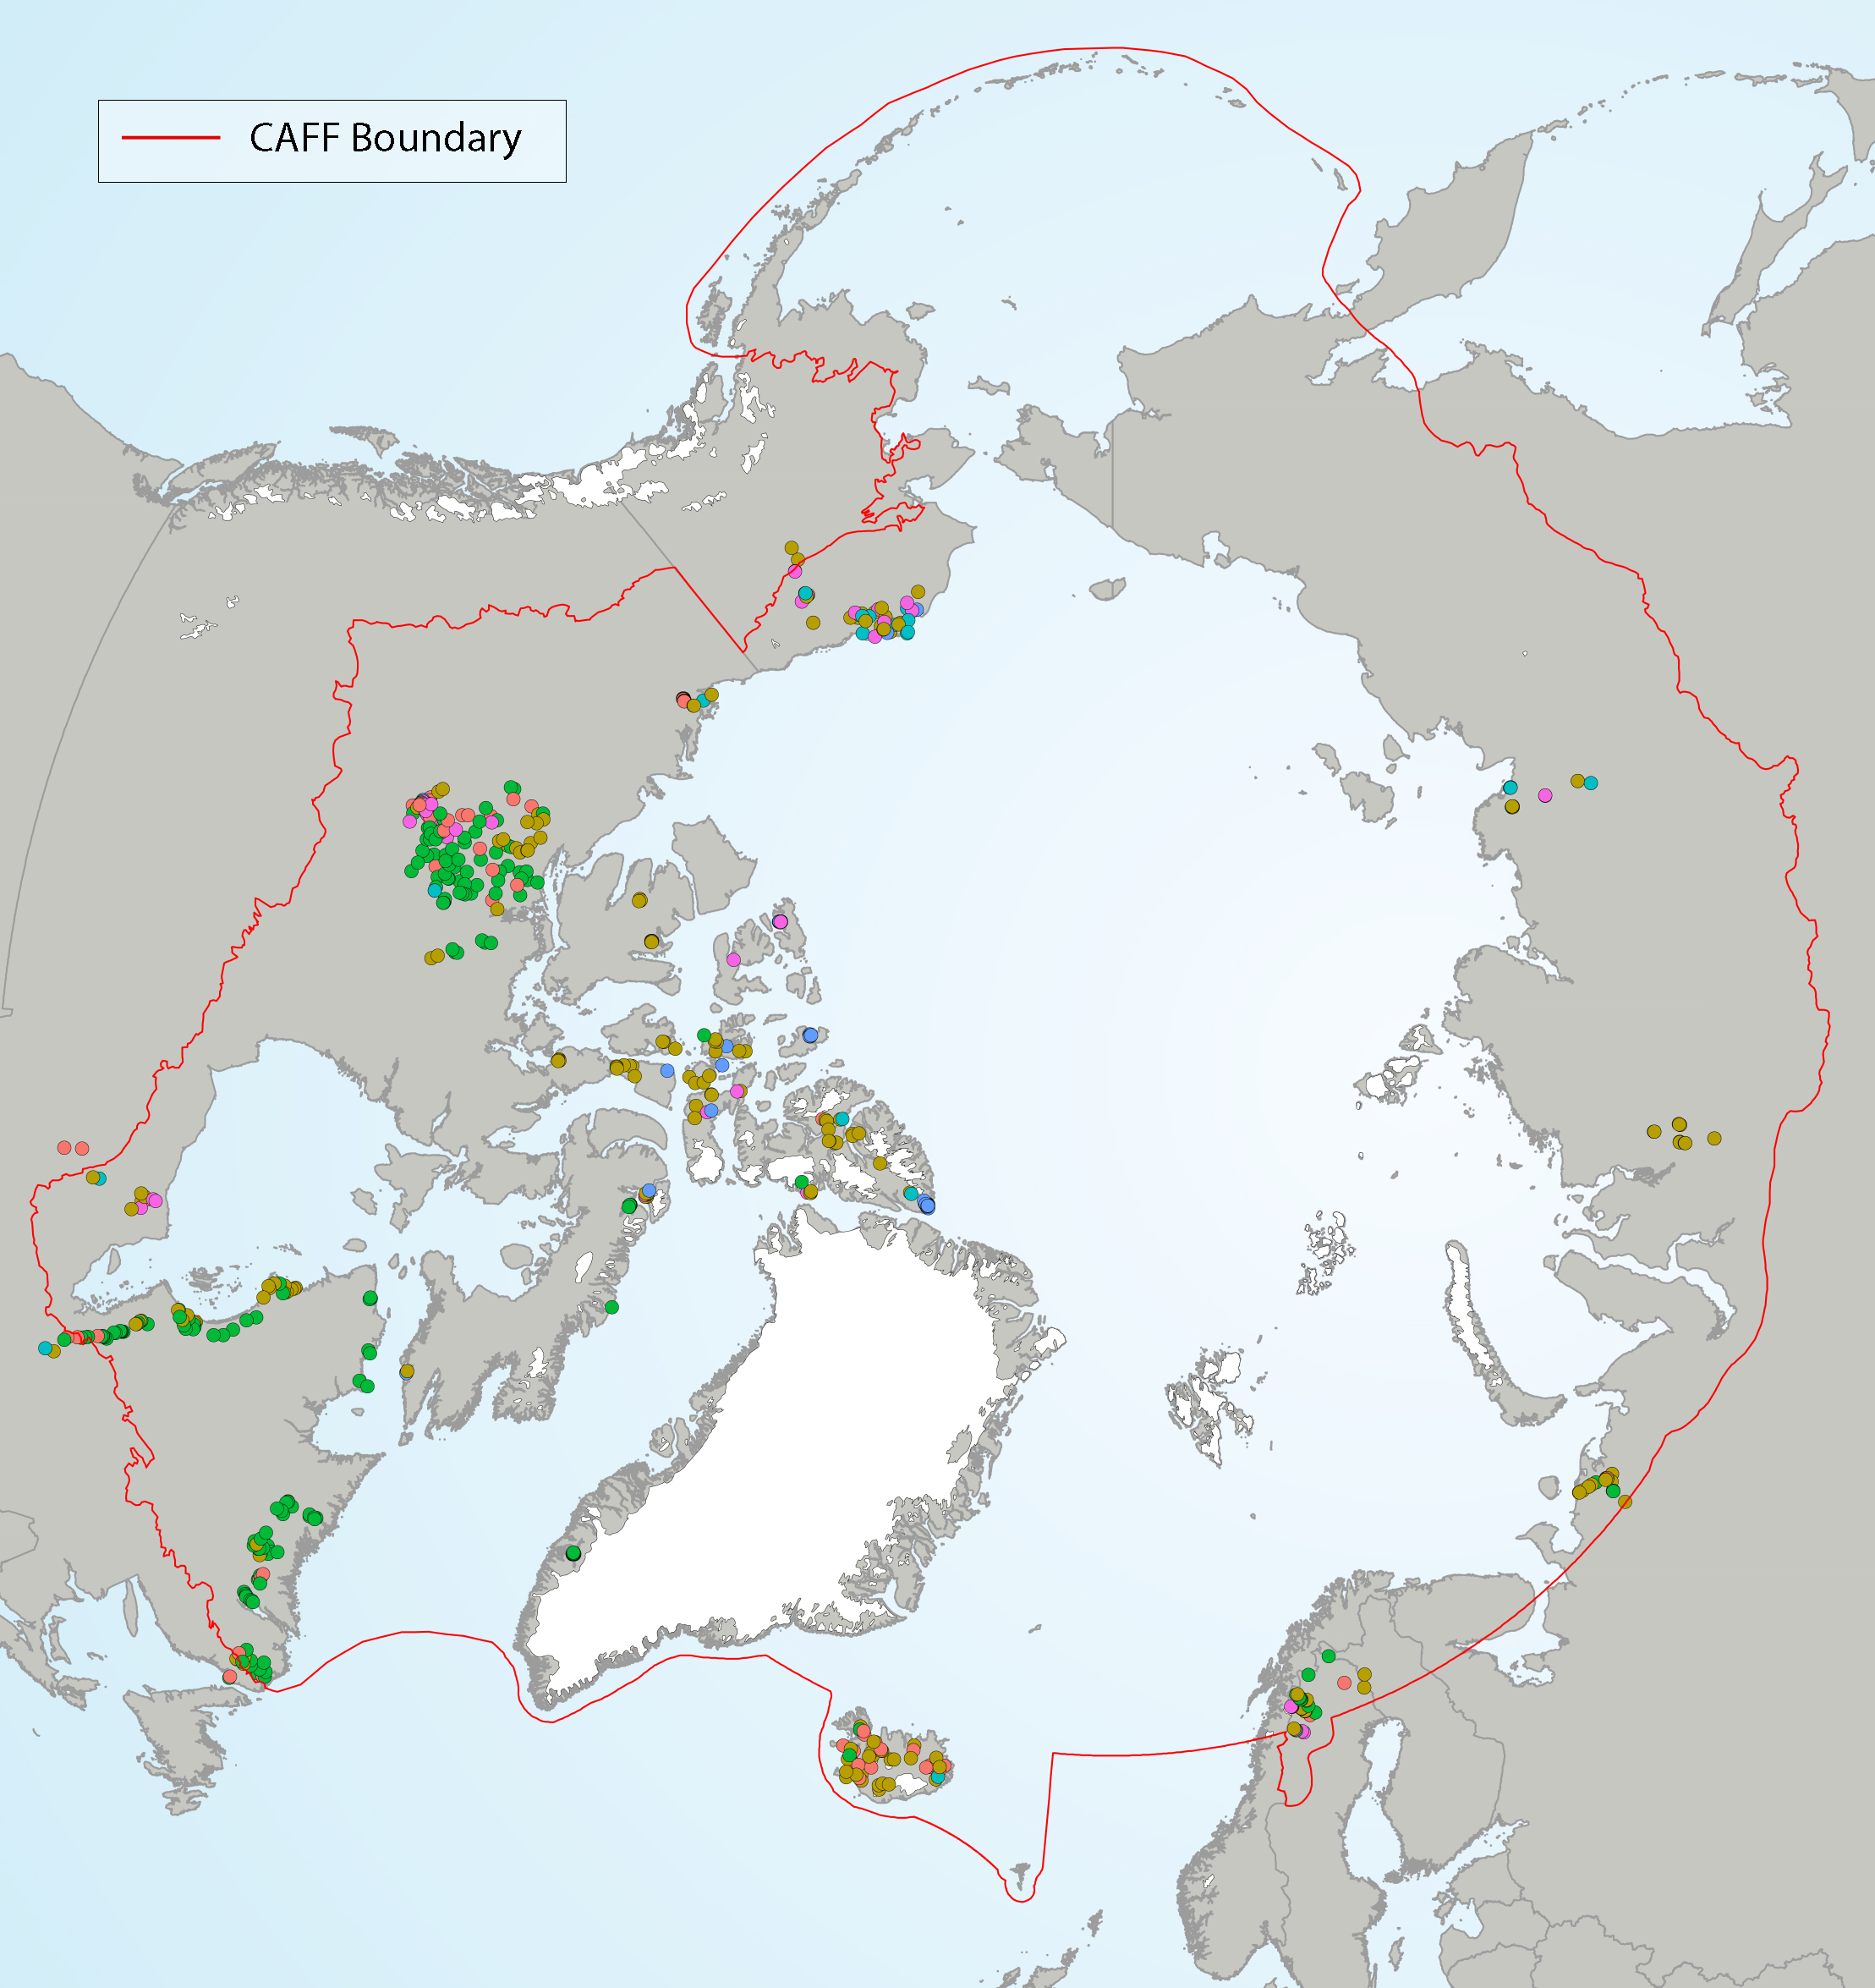
Figure 4 12 Diatom groups from Self Organizing Maps (SOMs) in lake top sediments, showing the geographical distribution of each group (with colors representing different SOM groups). State of the Arctic Freshwater Biodiversity Report - Chapter 4 - Page 39 - Figure 4-12
-
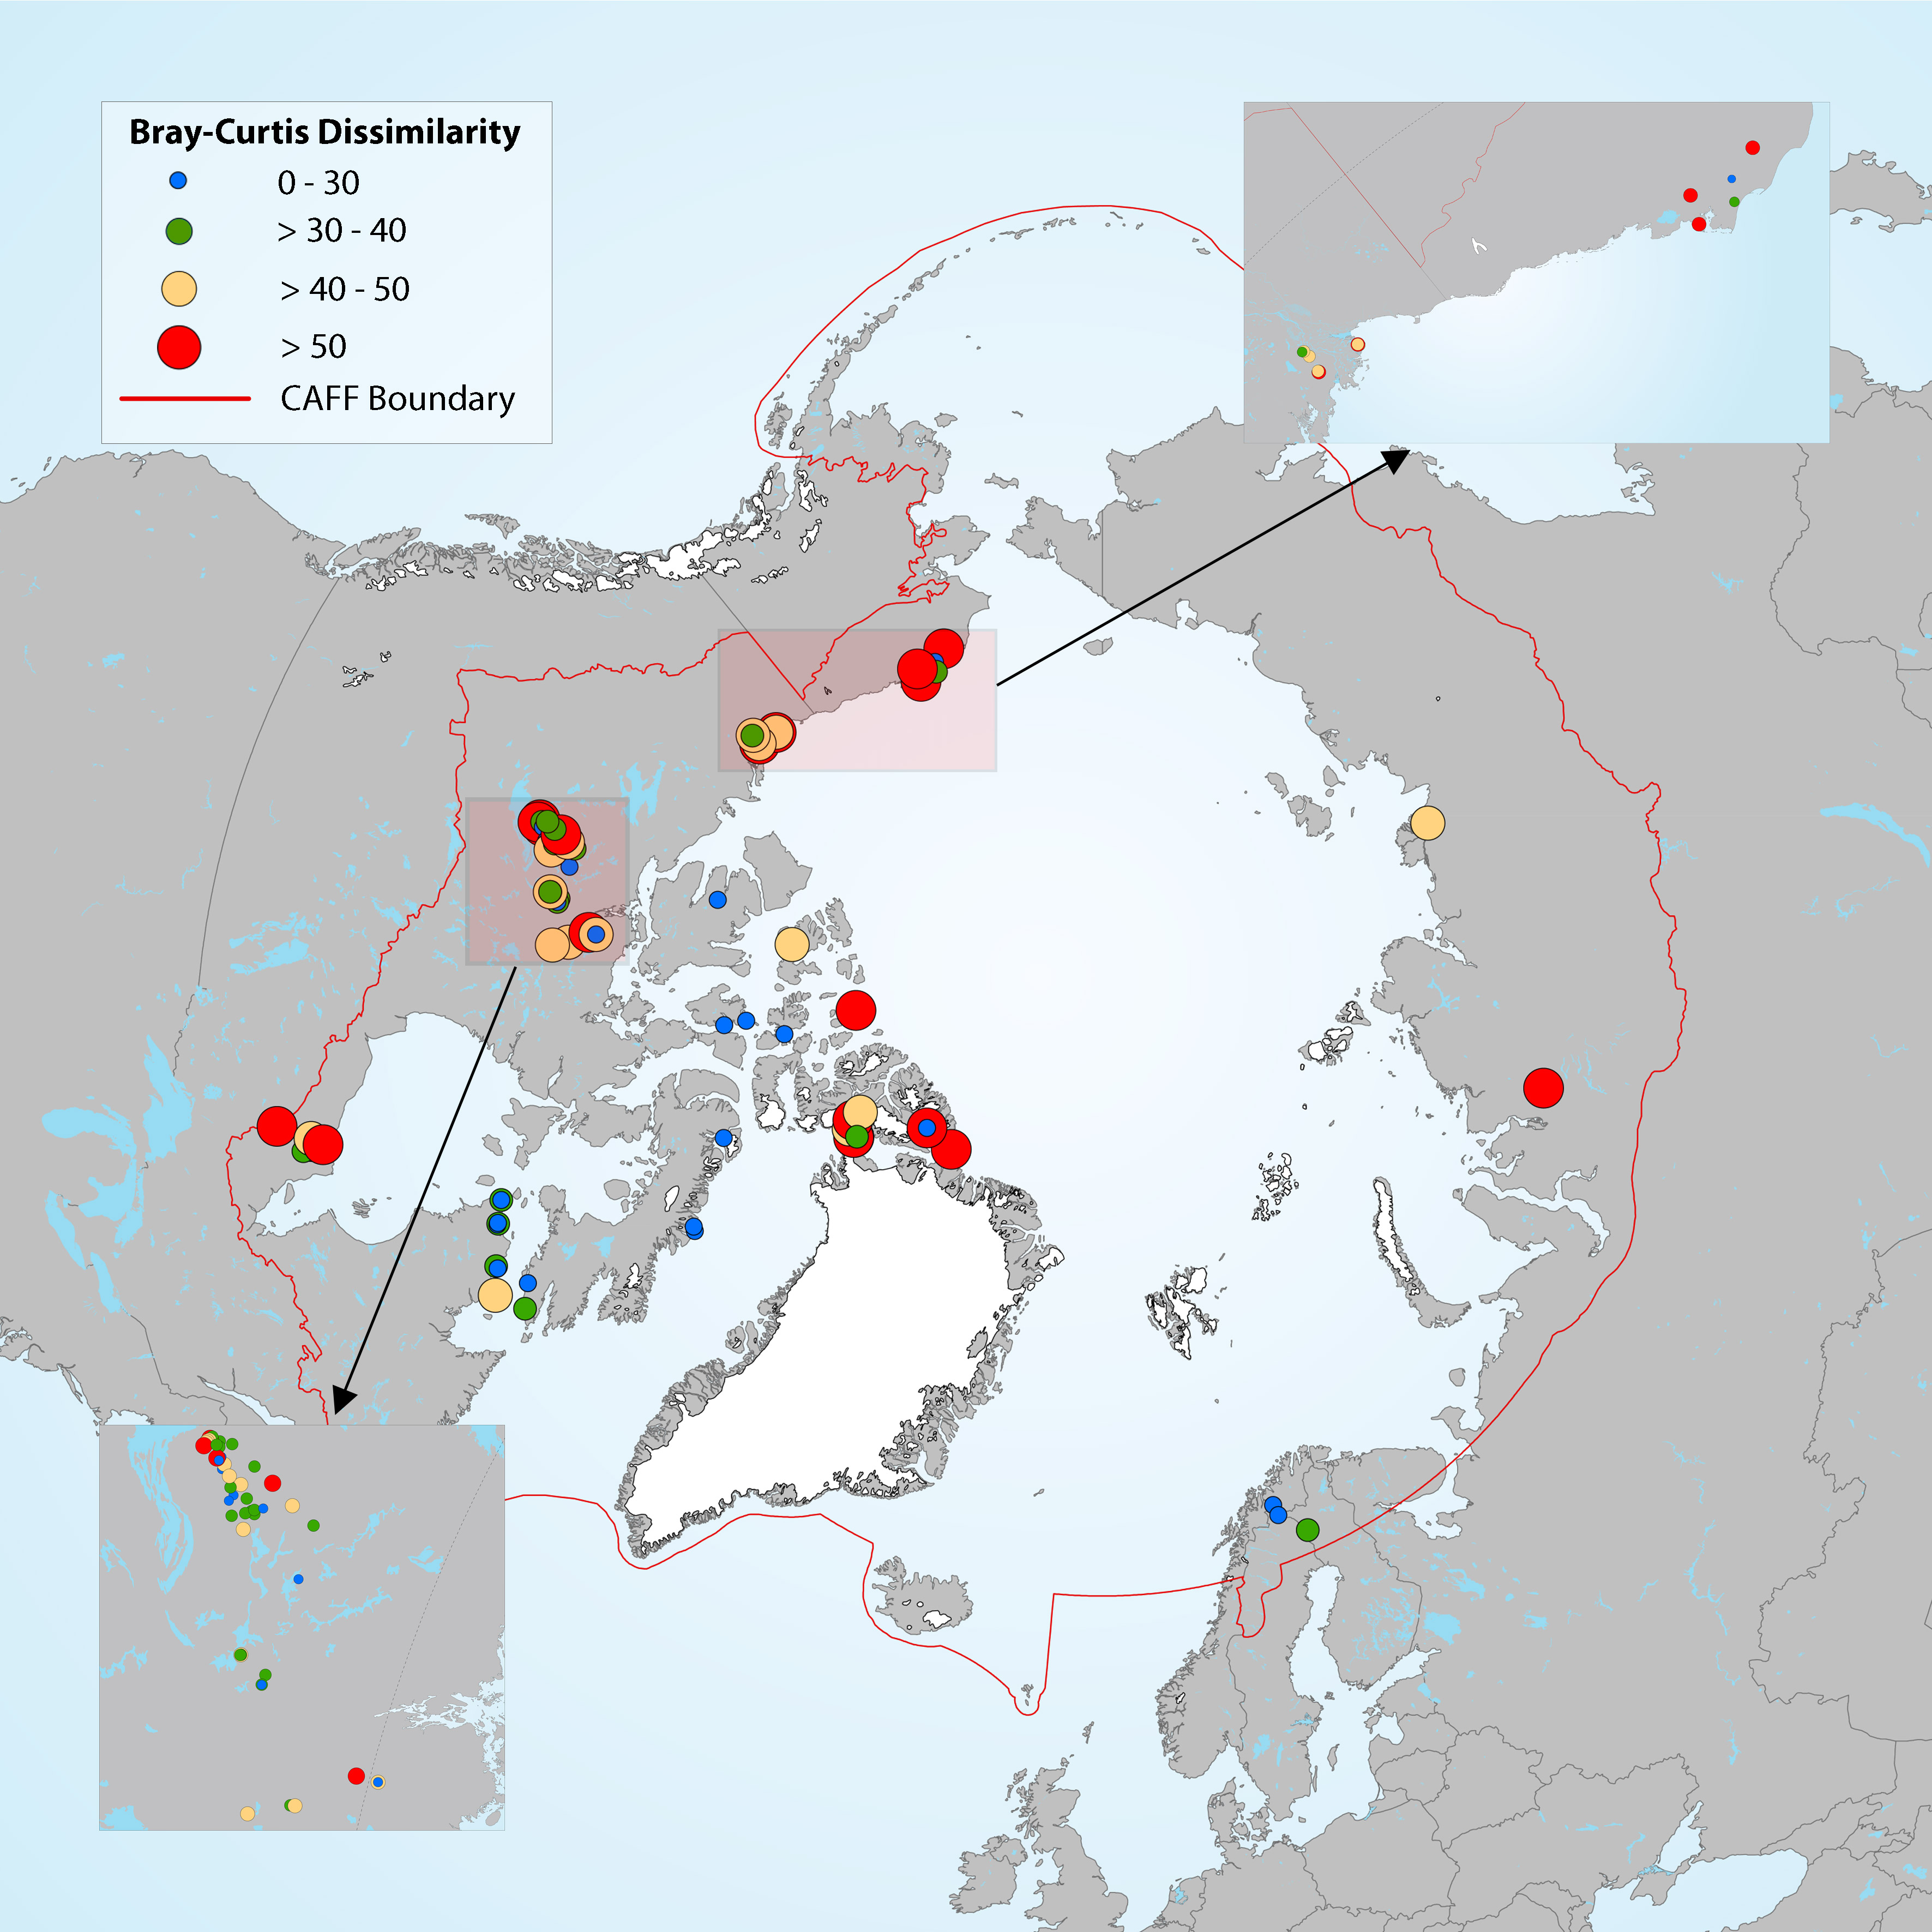
Estimation of diatom assemblage changes over a period of about 200 years (top versus bottom sediment cores). Figure 4-14 Map showing the magnitude of change in diatom assemblages between bottom (pre-industrial) and top (modern) section of the cores, estimated by Bray-Curtis (B-C) dissimilarity. Boundaries for the B-C dissimilarity categories are based on distribution quartiles (0-30%, 30-40%, 40- 50% and >50%), where the lowest values (blue dots) represent the lowest degree of change in diatom assemblage composition between top and bottom sediment core samples in each lake. State of the Arctic Freshwater Biodiversity Report - Chapter 4 - Page 41 - Figure 4-14
-
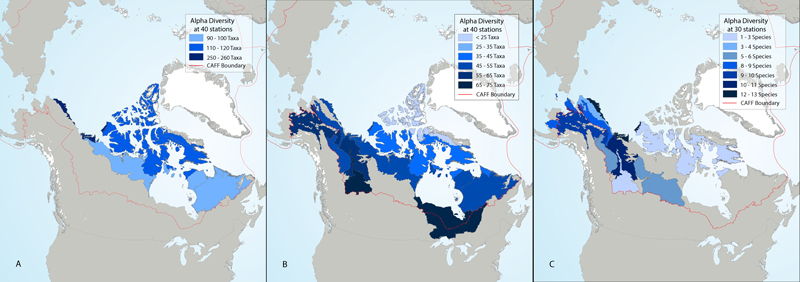
Rarefied alpha diversity of river (a) diatoms from benthic samples, (b) benthic macroinvertebrates, and (c) fish in ecoregions across North America. State of the Arctic Freshwater Biodiversity Report - Chapter 5- Page 84 - Figure 5-1
-
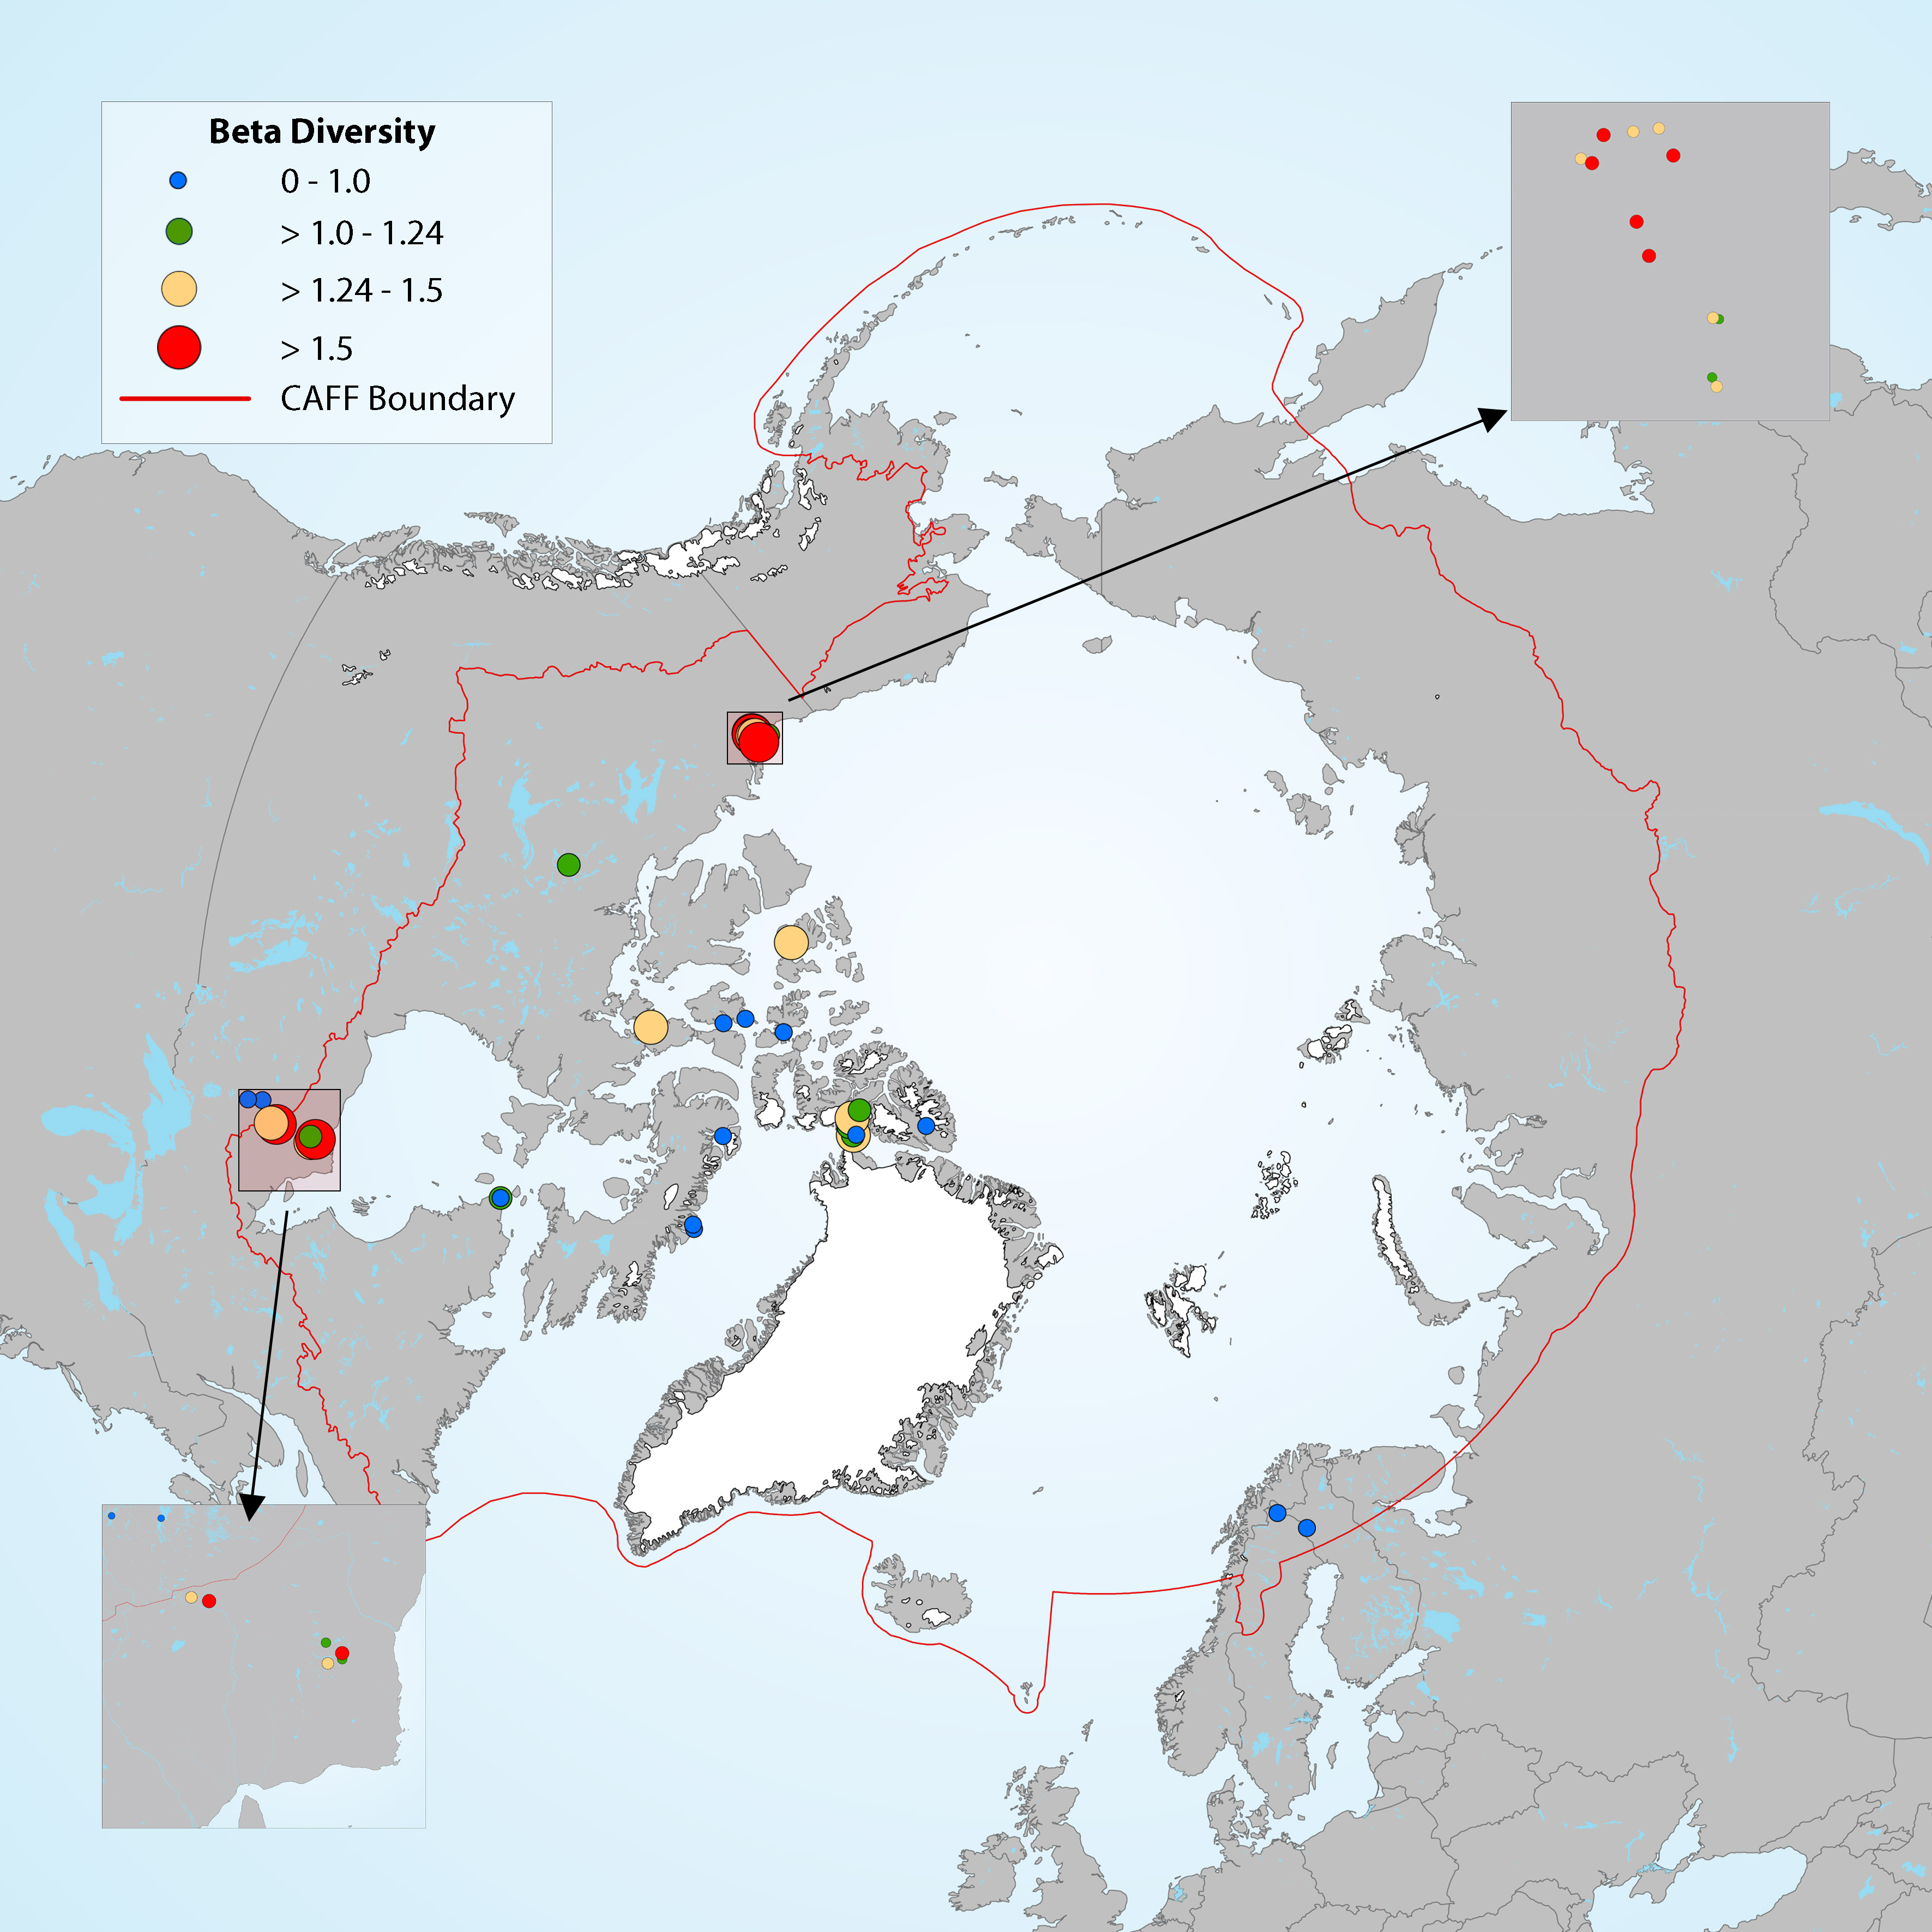
Figure 4-16 Map showing the magnitude of change in diatom assemblages for downcore samples, with beta diversity used as a measure of the compositional differences between samples at different depths along the core. Boundaries for the beta diversity categories are based on distribution quartiles (0-0.1, 0.1-1.24, 1.24-1.5, >1.5), where the lowest values (blue dots) represent the lowest degree of change in diatom assemblage composition along the length of the core in each lake. State of the Arctic Freshwater Biodiversity Report - Chapter 2 - Page 15 - Figure 2-1
-
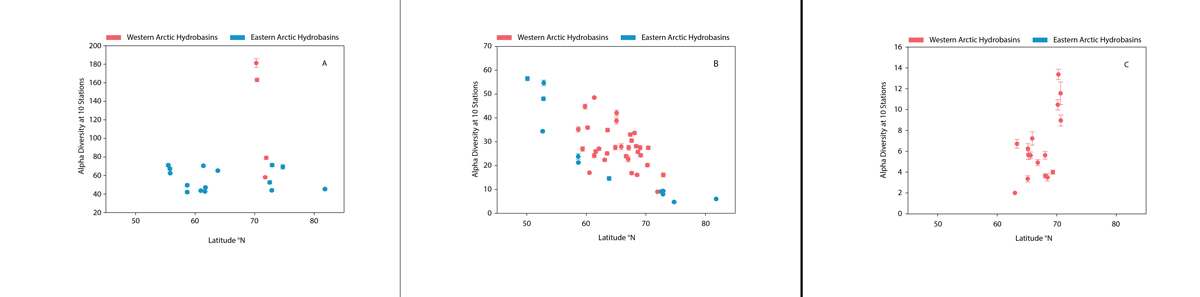
Alpha diversity (± standard error) of river (a) diatoms from benthic samples, (b) benthic macroinvertebrates, and (c) fish within hydrobasins in western and eastern North America plotted as a function of the average latitude in each hydrobasin. Alpha diversity is rarefied to 10 stations per hydrobasin, using size level 5 hydrobasins for all panels. State of the Arctic Freshwater Biodiversity Report - Chapter 5 - Page 85 - Figure 5-2
-
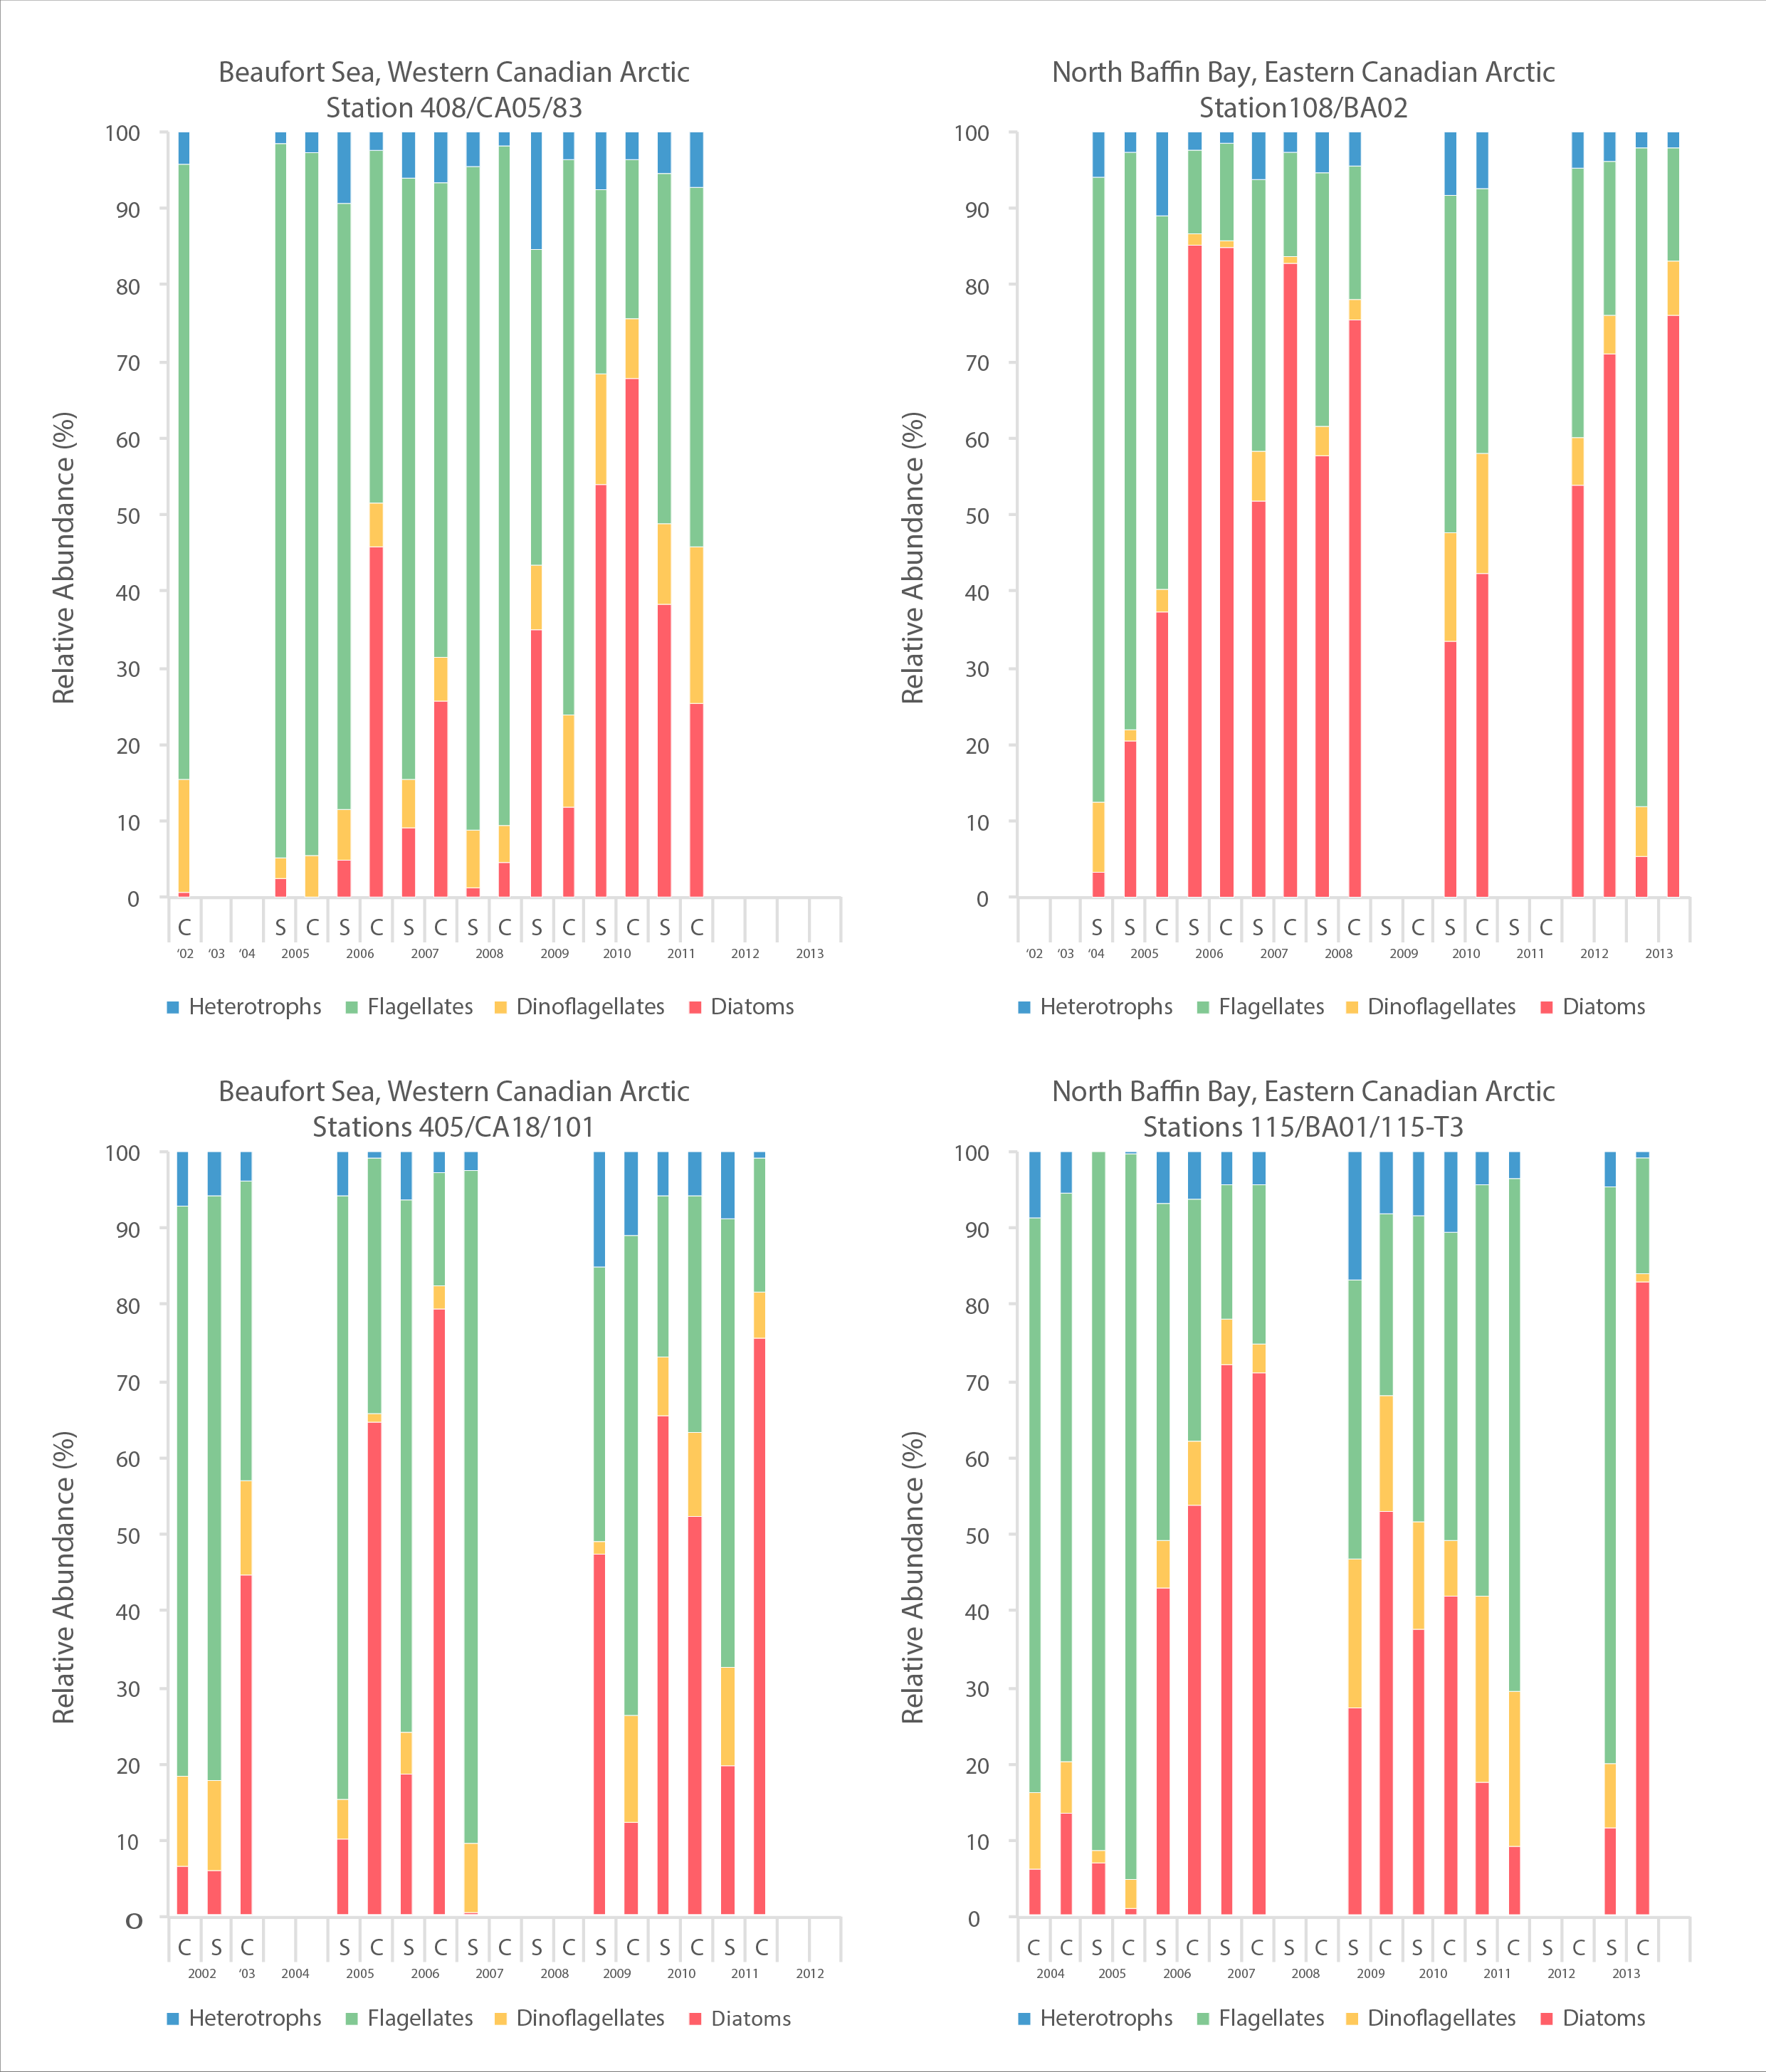
A time series of cell abundances, as determined by microscopy, of major phytoplankton groups from 2002-2013 for four sites, two in an east-west transect in Amundsen Gulf, Beaufort Sea and two in an east-west transect in northern Baffin Bay. STATE OF THE ARCTIC MARINE BIODIVERSITY REPORT - <a href="https://arcticbiodiversity.is/findings/plankton" target="_blank">Chapter 3</a> - Page 73 - Figure 3.2.4 A time series of cell abundances, as determined by microscopy, of major phytoplankton groups from 2002-2013 for four sites, 2 in the Beaufort Sea and 2 in northern Baffin Bay. Cell abundances are given as cells per liter. On most sampling dates, there is data from surface water and from the subsurface chlorophyll maximum (Cmax in the spreadsheet). Some additional information is included in the column headings, such as the percent of light at the sample depth; however, this should not be included in the figure. You may or may not want to include a map element in this figure, and rough coordinates of the sampling sites are included. The second sheet of the excel file presents the same data but at a finer scale of taxonomic resolution. It is the first sheet that should be used.