Environment
Type of resources
Available actions
Topics
Keywords
Contact for the resource
Provided by
Years
Formats
Representation types
Update frequencies
status
Scale
-

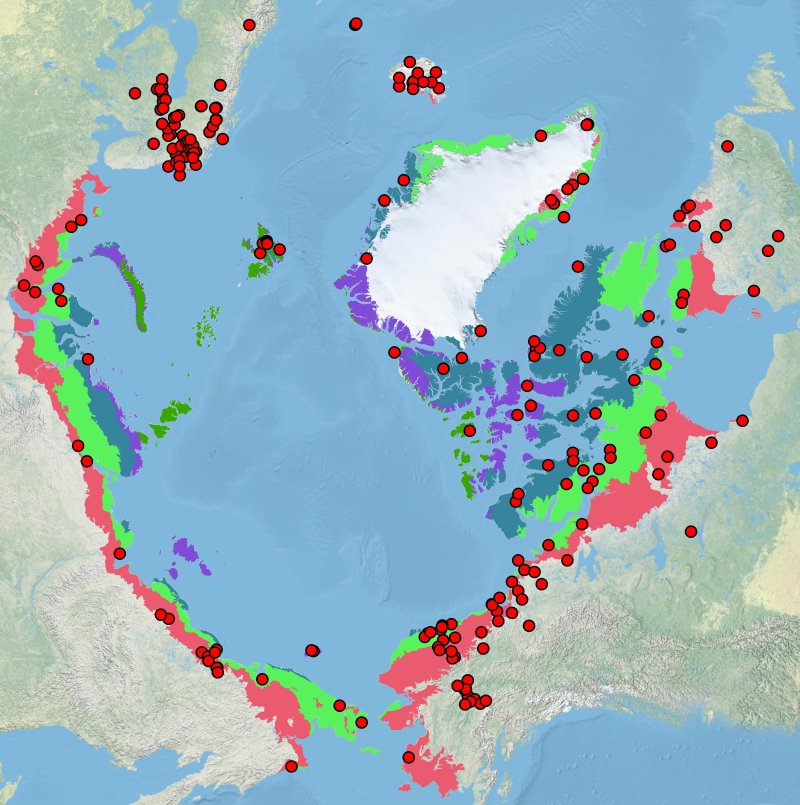
The Arctic Terrestrial Biodiversity Monitoring Plan is developed to improve the collective ability of Arctic traditional knowledge holders, northern communities and scientists to detect, understand and report on long-term change in Arctic terrestrial ecosystems and biodiversity.
-

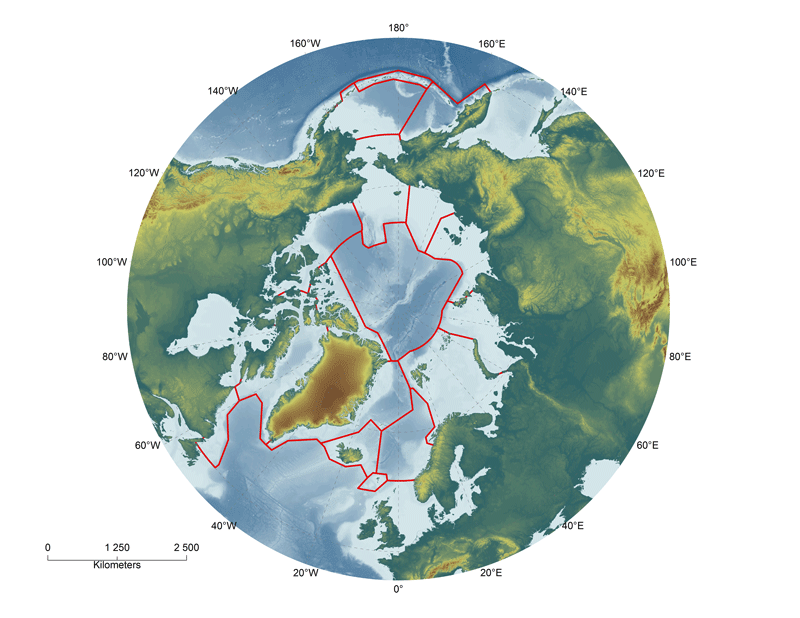
A total of 95 areas of heightened ecological significance have been identified within the Arctic LMEs. The areas were identified primarily on the basis of their ecological importance to fish, birds and/or mammals, as these species are the most widely studied Arctic groups. The majority of areas identified are used by birds (85) and marine mammals (81), with a lower number used by fish (40, most of them spawning areas). About 70 areas are used both by birds and mammals, and only two of the areas identified are used only by fish.The areas of heightened ecological significance comprise a total area of about 12 million km2, or more than half the total area of the ice-covered part of the marine Arctic. The areas are generally not homogenous but comprise subareas used by fish, birds or mammals. Based on the approach used, subareas were identified separately for fish, birds, and mammals, or information on the use of the larger areas by these groupswas summarized. The subareas often overlap and are also often used by two or more species of birds or mammals, such as for breeding in seabird colonies or for staging by waterfowl and shorebirds. Information on species present and the times and purposes of use are given in summary tables for each LME. Thus, while the areas identified as being of heightened ecological significance cover a large total area, this is the aggregate area used over all seasons throughout the year. The area used at any one time is lower due to the strong seasonal pattern in the annual migratory cycles of fish, birds and mammals.
-

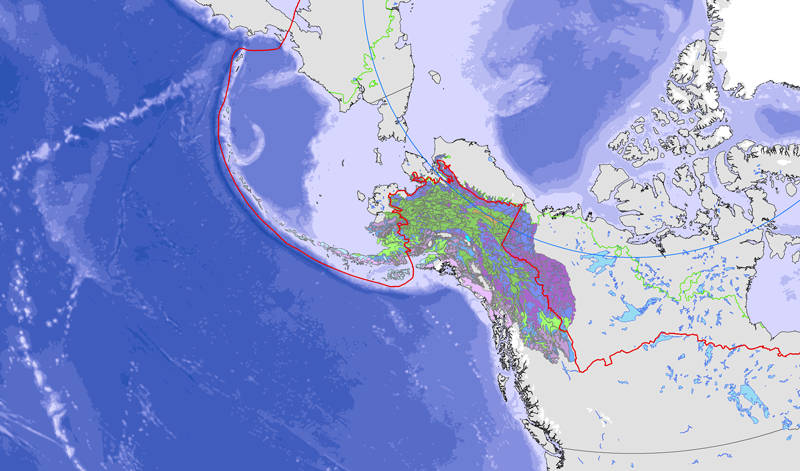
<a href="http://caff.is/strategies-series/359-the-alaska-yukon-region-of-the-circumboreal-vegetation-map-cbvm" target="_blank"> <img width="150px" height="150px" alt="logo" align="left" hspace="10px" src="http://geo.abds.is/geonetwork/images/flora_logo.png"> </a>A map of boreal vegetation for the Alaska-Yukon region was developed to contribute to the circumboreal vegetation mapping (CBVM) project. The effort included developing a map of bioclimates with 12 bioclimate zones, a map of biogeographic provinces with Alaska-Yukon and Aleutian provinces, and a map of geographic sectors with six sectors that provided the basis for classification of boreal vegetation. Vegetation mapping was done at 1:7.5 million scale using the mapping protocols of the CBVM team. Mapping used MODIS imagery as the basis for manual image interpretation and an integrated-terrain-unit approach, which included classifications for bioclimate, physiography, generalized geology, permafrost, disturbance, growth from, geographic sector, and vegetation. Vegetation was mapped at two hierarchical levels: (1) formation group differentiating zonal and azonal systems; and (2) geographic sectors based on bioclimatic zonation and dominant species that characterize broad longitudinal regions or biogeographic provinces. Each of the 19 map units was described by identifying the dominant and characteristic species and its climatic and landscape characteristics, as well as references that relate to the unit.
-

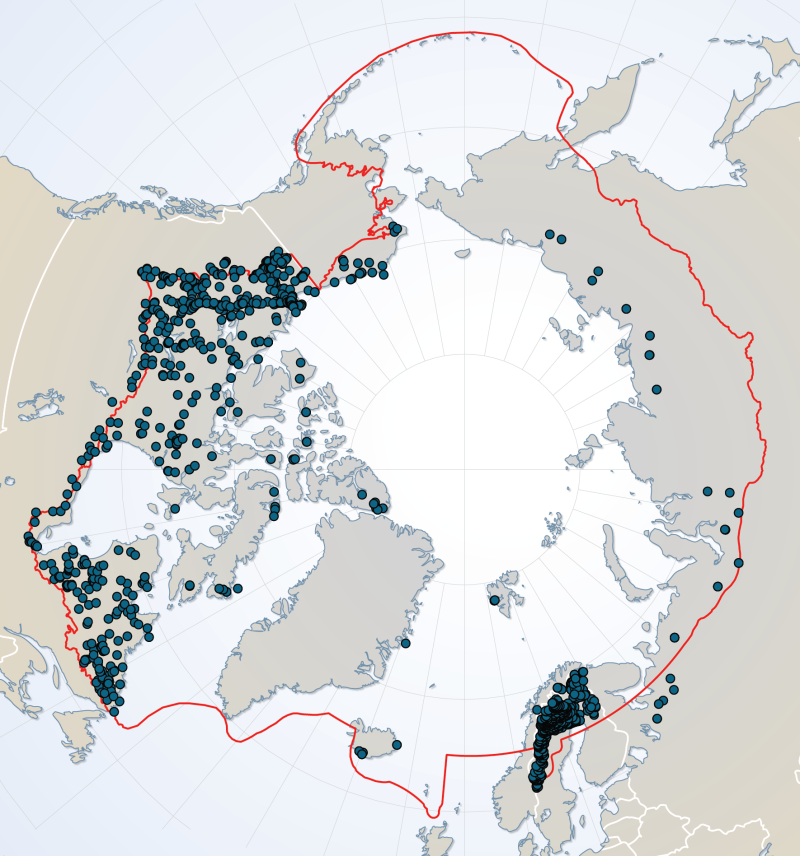
River dataset showing location of study sites in rivers for the Arctic Freshwater Biodiversity Monitoring Plan. Published in the Arctic Freshwater Monitoring Plan Brochure released in 2013 http://www.caff.is/monitoring-series/view_document/277-arctic-freshwater-biodiversity-monitoring-plan-brochure
 CAFF - Arctic Biodiversity Data Service (ABDS)