 CAFF - Arctic Biodiversity Data Service (ABDS)
Keyword
lakes
Type of resources
Available actions
Topics
Keywords
Contact for the resource
Provided by
Representation types
Update frequencies
status
From
1
-
1
/
1
-
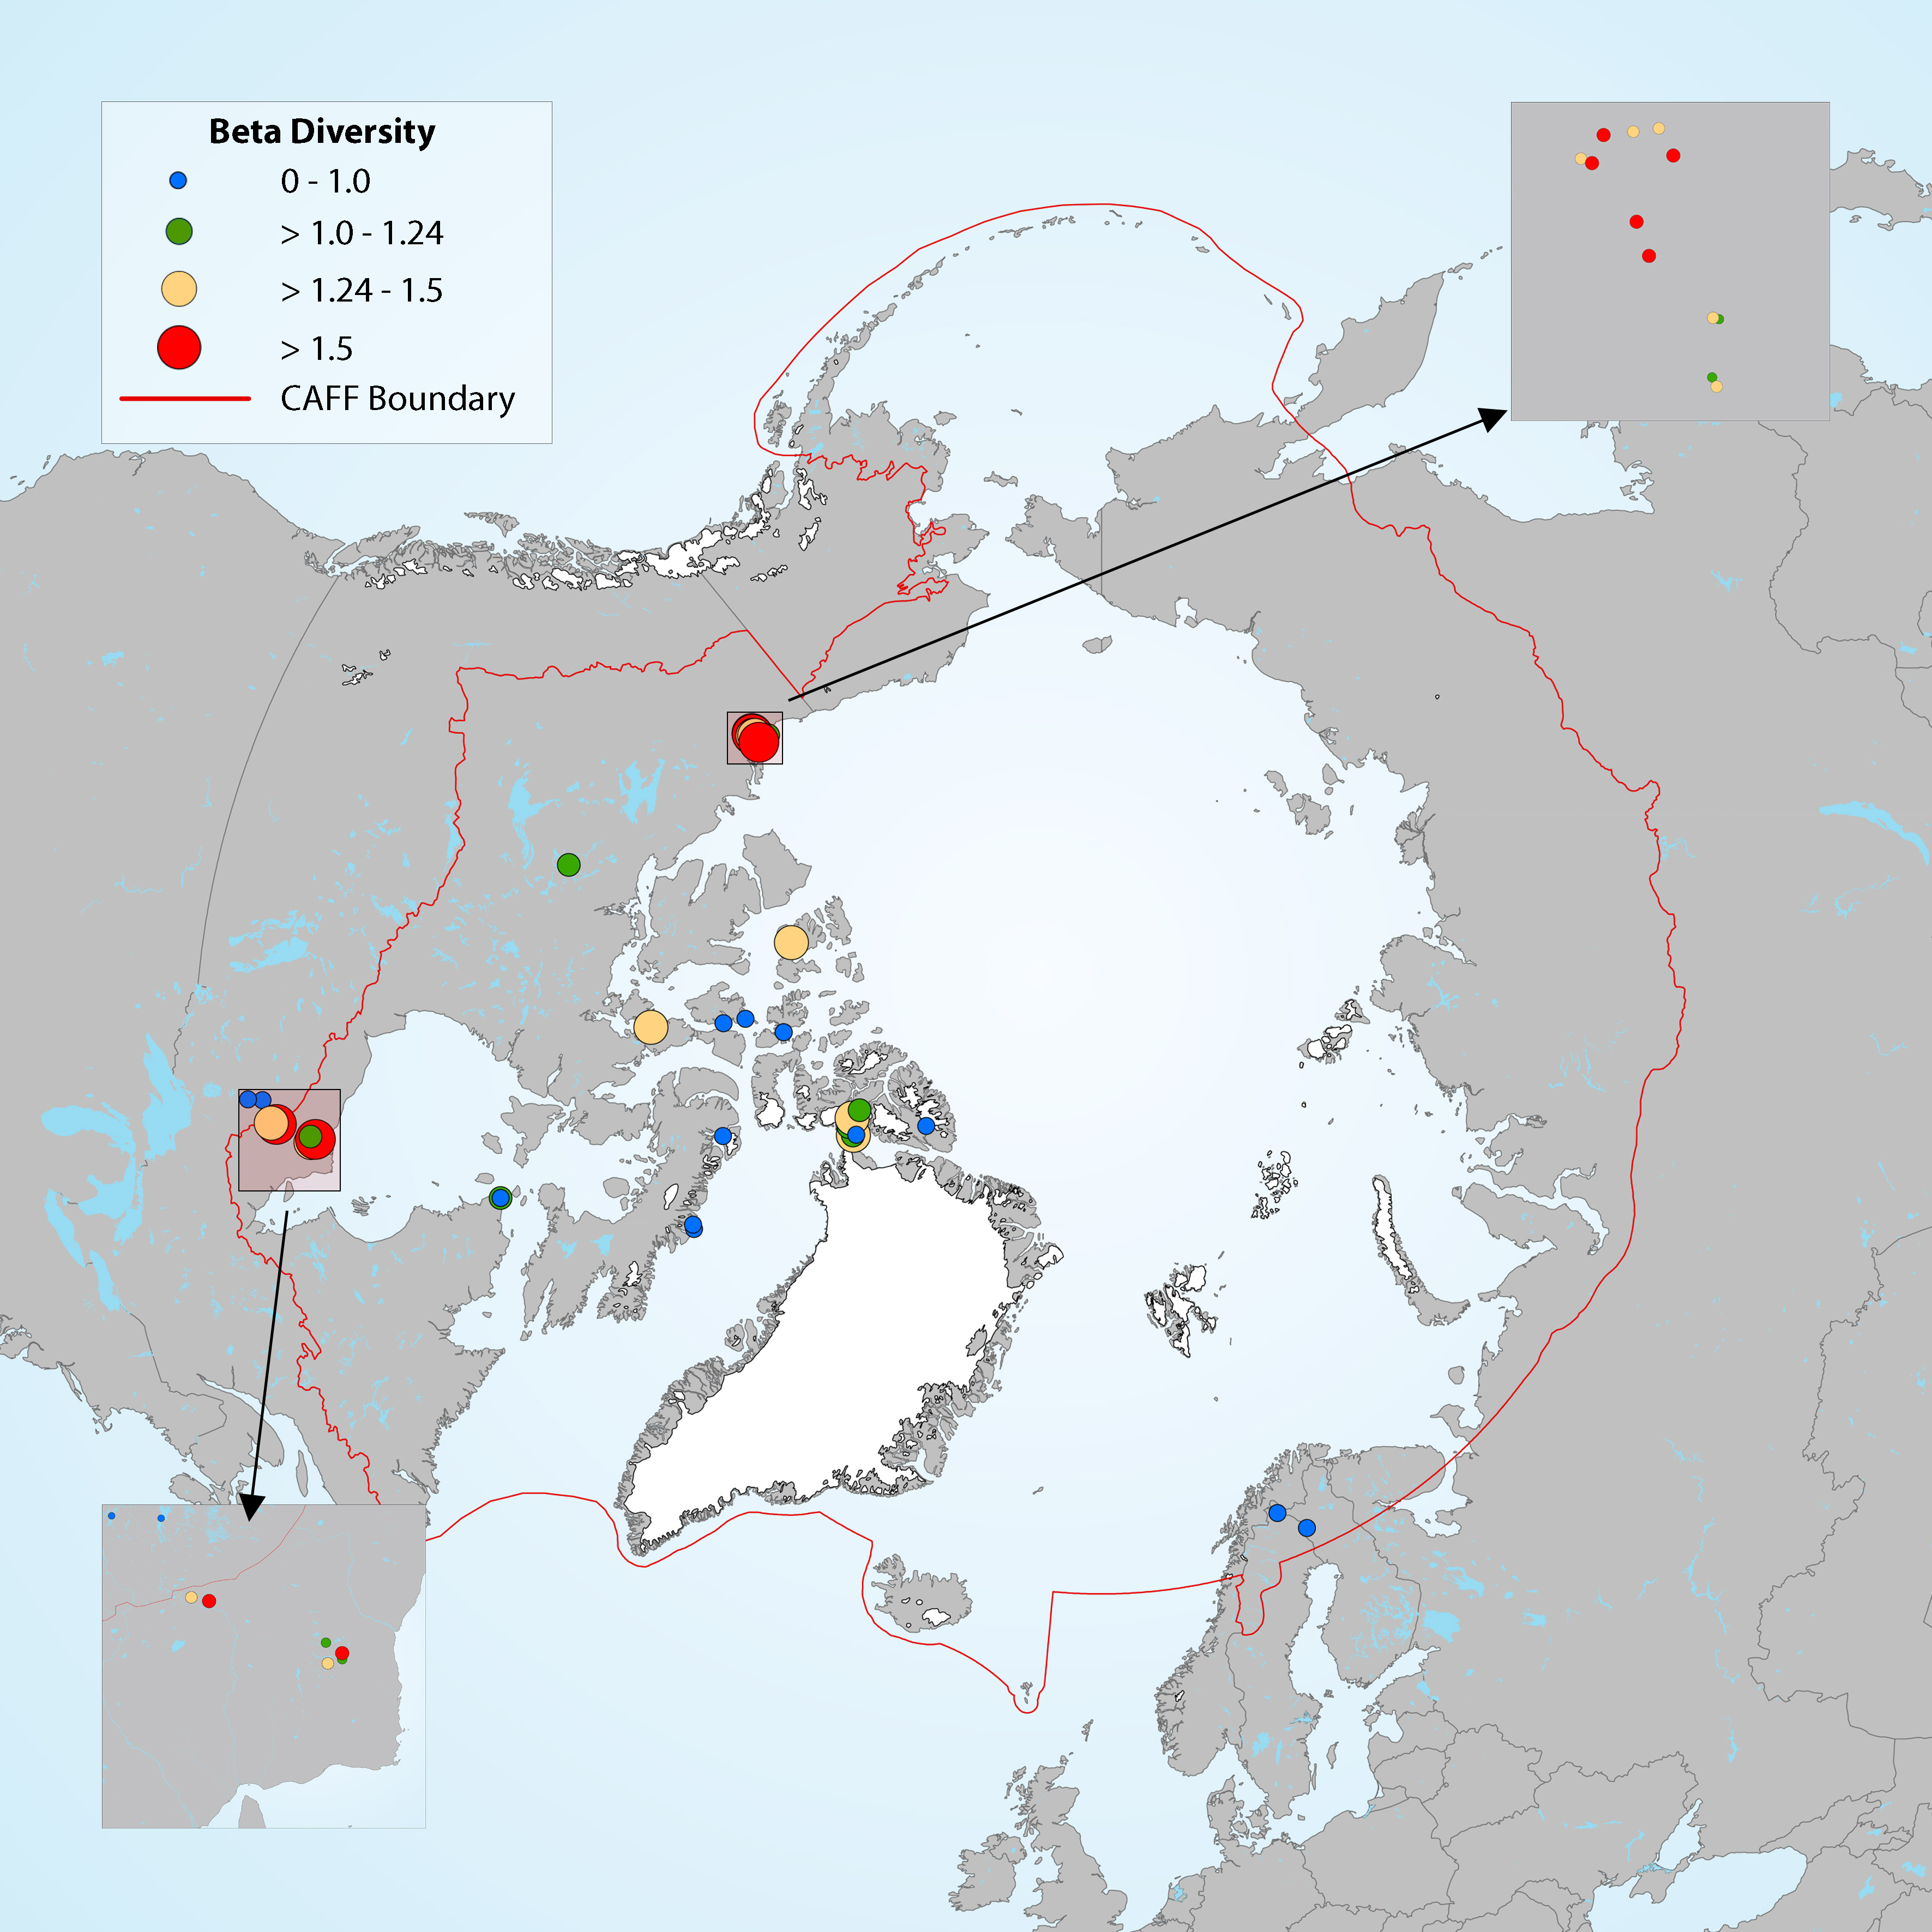
Figure 4-16 Map showing the magnitude of change in diatom assemblages for downcore samples, with beta diversity used as a measure of the compositional differences between samples at different depths along the core. Boundaries for the beta diversity categories are based on distribution quartiles (0-0.1, 0.1-1.24, 1.24-1.5, >1.5), where the lowest values (blue dots) represent the lowest degree of change in diatom assemblage composition along the length of the core in each lake. State of the Arctic Freshwater Biodiversity Report - Chapter 2 - Page 15 - Figure 2-1