 CAFF - Arctic Biodiversity Data Service (ABDS)
Climatology, meteorology, atmosphere
Type of resources
Available actions
Topics
Keywords
Contact for the resource
Provided by
Representation types
Update frequencies
status
-

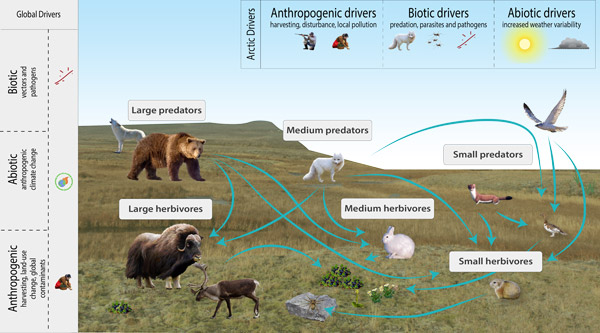
The Arctic terrestrial food web includes the exchange of energy and nutrients. Arrows to and from the driver boxes indicate the relative effect and counter effect of different types of drivers on the ecosystem. STATE OF THE ARCTIC TERRESTRIAL BIODIVERSITY REPORT - Chapter 2 - Page 26- Figure 2.4
-

Geographic area covered by the Arctic Biodiversity Assessment and the CBMP–Terrestrial Plan. Subzones A to E are depicted as defined in the Circumpolar Arctic Vegetation Map (CAVM Team 2003). Subzones A, B and C are the high Arctic while subzones D and E are the low Arctic. Definition of high Arctic, low Arctic, and sub-Arctic follow Hohn & Jaakkola 2010. STATE OF THE ARCTIC TERRESTRIAL BIODIVERSITY REPORT - Chapter 1 - Page 14 - Figure 1.2
-
Conceptual model of Arctic terrestrial mammals, showing FECs, interactions with other biotic groups and examples of drivers and attributes relevant at various spatial scales. STATE OF THE ARCTIC TERRESTRIAL BIODIVERSITY REPORT - Chapter 3 - Page 67 - Figure 3.28
-
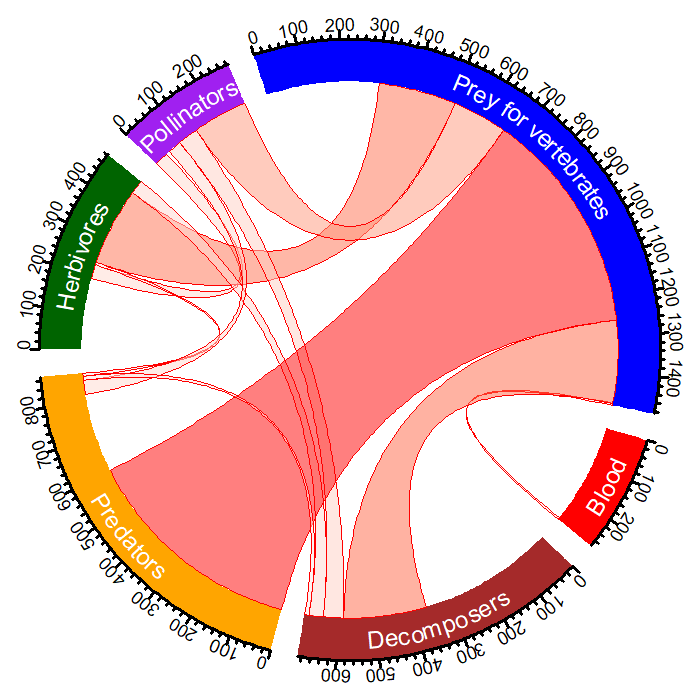
The diagram indicates the number of species in each FEC for the North Atlantic region of the Arctic (circular outline) and the overlap between the five CBMP–Terrestrial Plan FECs and the additional ‘predators’ FEC. The link width indicates the number of species linking two FECs. The larger the link the more species that are found in linking FECs. Modified from Gillespie et al. 2020a. STATE OF THE ARCTIC TERRESTRIAL BIODIVERSITY REPORT - Chapter 3 - Page 38 - Figure 3.8
-
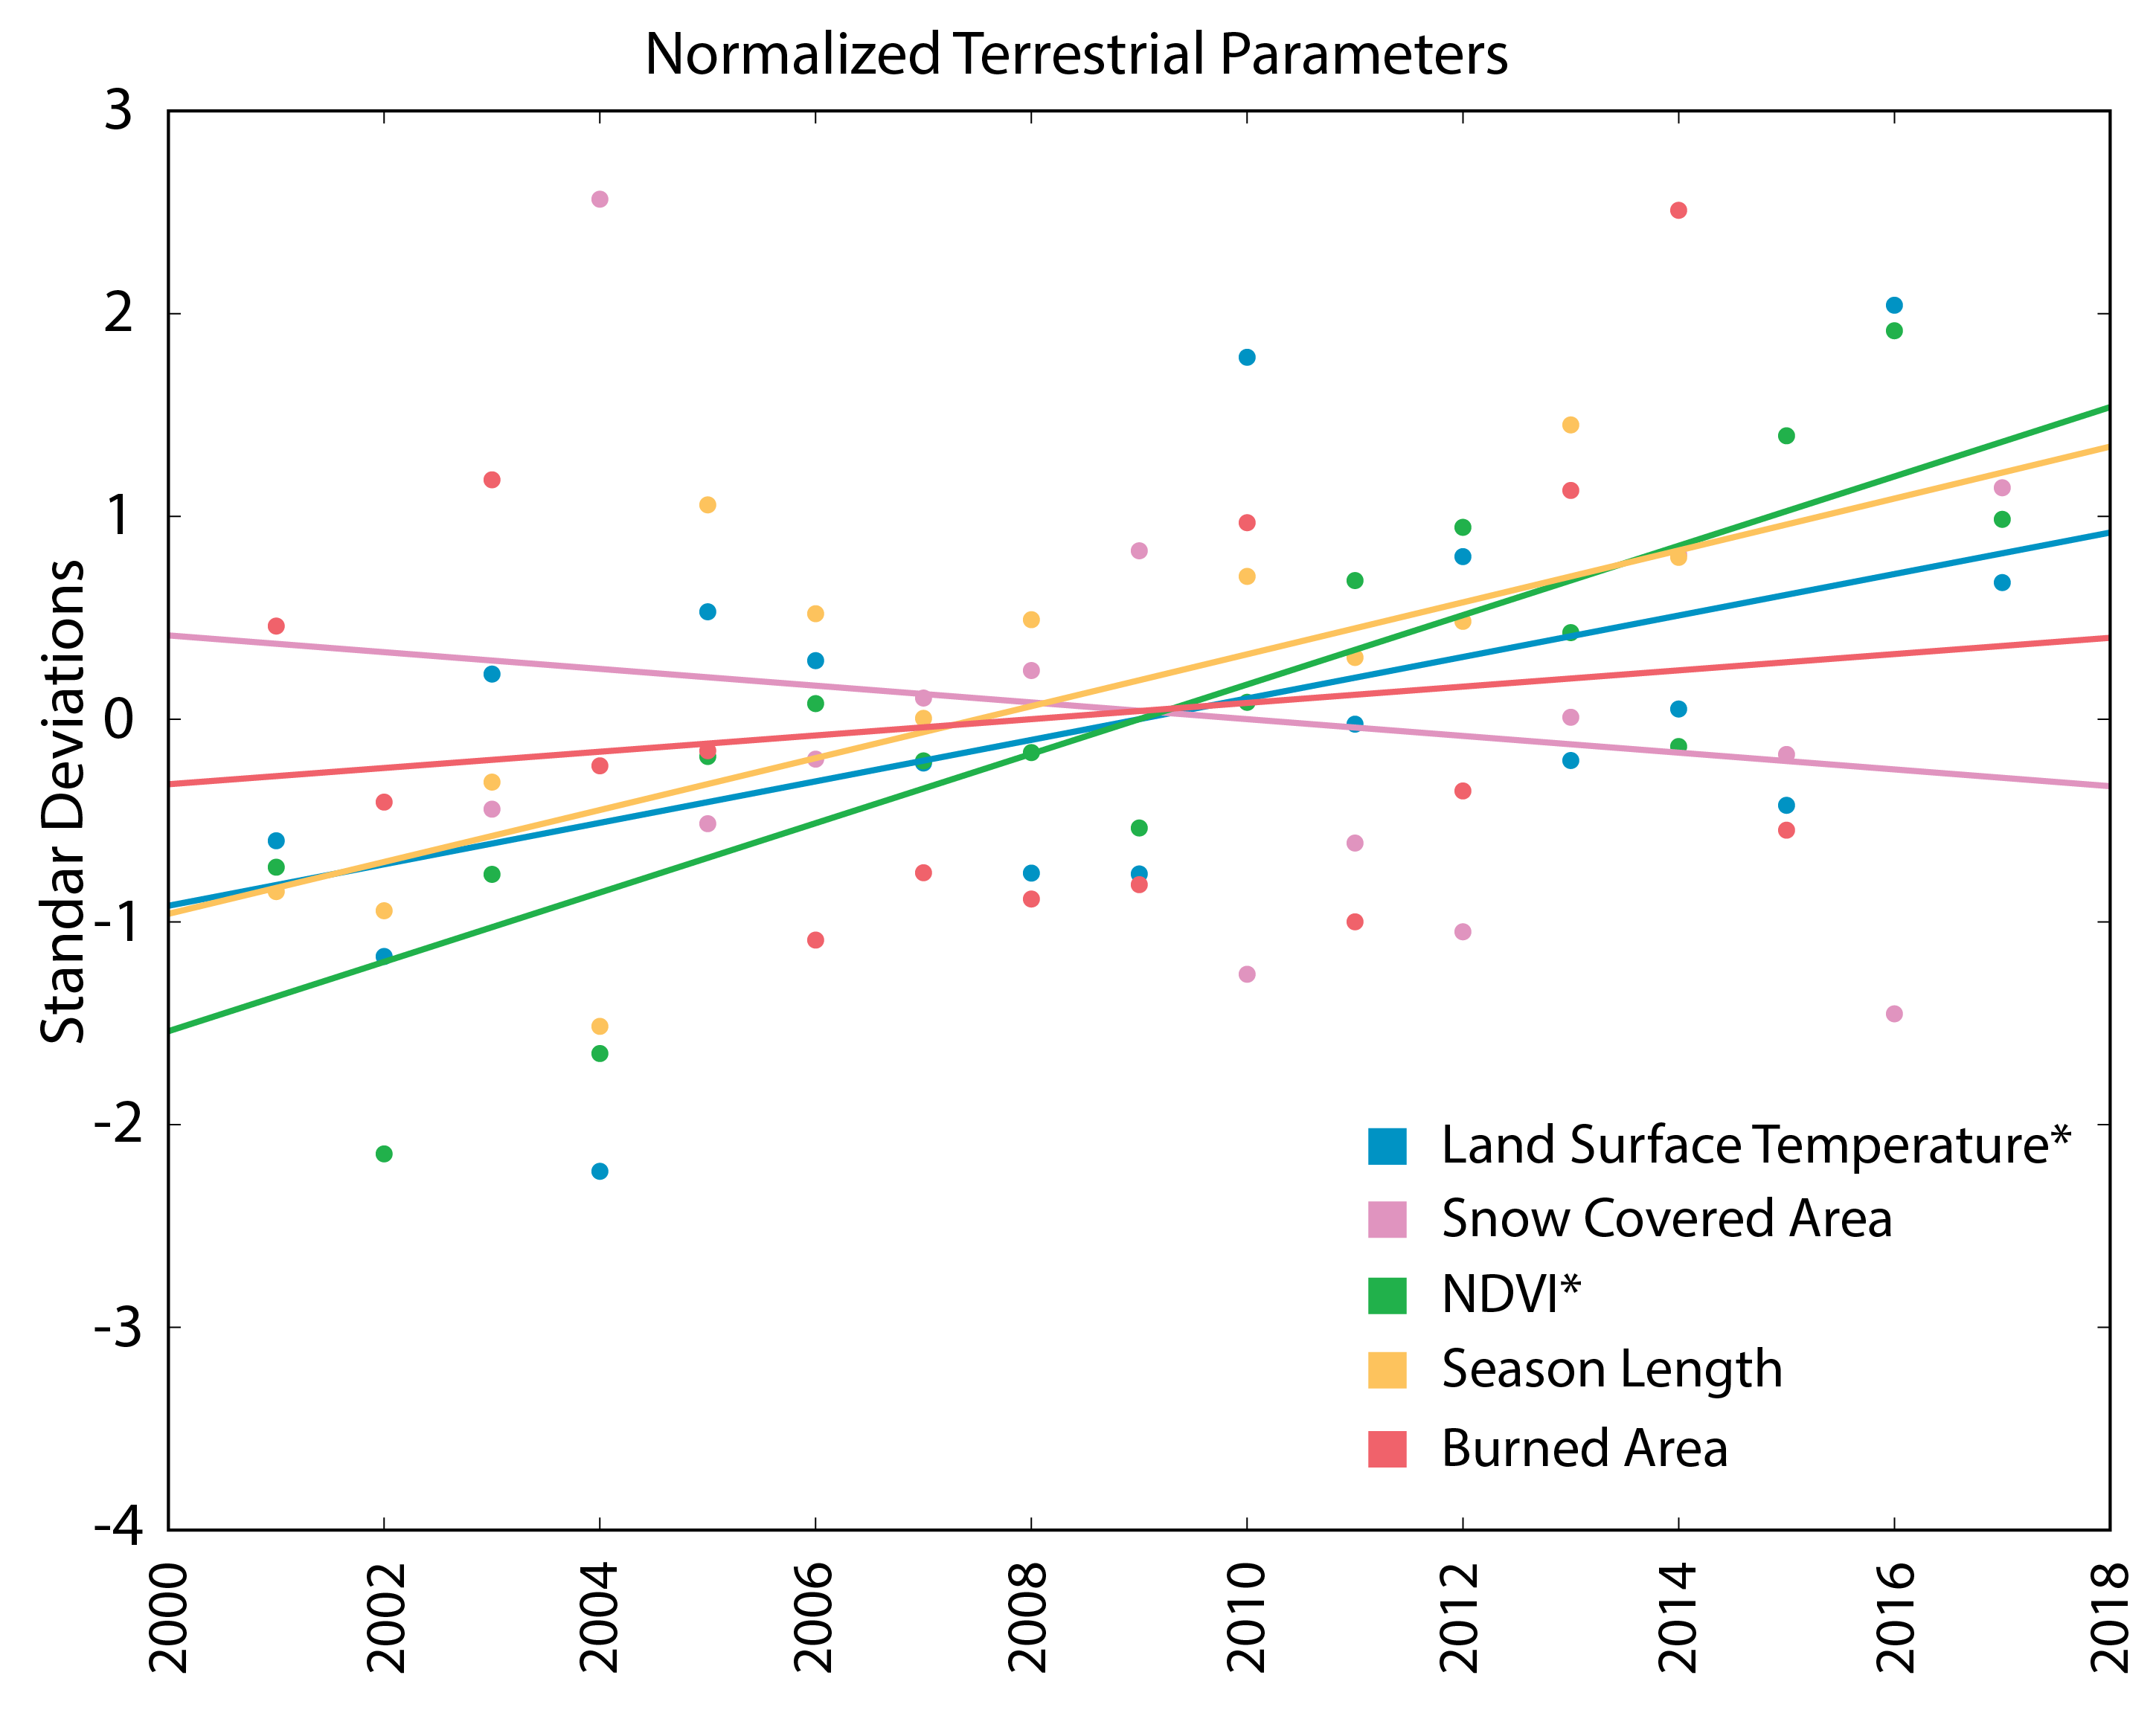
Rates of change among different terrestrial parameters, using average annual standardised data for the pan-Arctic. *identifies parameters with statistically significant trends. STATE OF THE ARCTIC TERRESTRIAL BIODIVERSITY REPORT - Chapter 3 - Page 95 - Figure 3.33
-

Arctic foxes are currently monitored at 34 sites throughout the North, with most monitoring efforts concentrated in Fennoscandia (Figure 3-32). The duration of monitoring across all sites is variable at between 2 and 56 years and was ongoing at 27 of the 34 sites (79%) as of 2015. Monitoring projects cover almost equally the four climate zones of the species’ distribution—high Arctic, low Arctic, sub-Arctic, and montane/alpine. STATE OF THE ARCTIC TERRESTRIAL BIODIVERSITY REPORT - Chapter 3 - Page 82 - Figure 3.32
-

Trends and distribution of muskoxen populations based on Table 3-5. Modified from Cuyler et al. 2020. STATE OF THE ARCTIC TERRESTRIAL BIODIVERSITY REPORT - Chapter 3 - Page 79 - Figure 3.30
-

Temporal trends of arthropod abundance, 1996–2009. Estimated by the number of individuals caught per trap per day during the season from four different pitfall trap plots, each consisting of eight (1996–2006) or four (2007–2009) traps. Modified from Høye et al. 2013. STATE OF THE ARCTIC TERRESTRIAL BIODIVERSITY REPORT - Chapter 3 - Page 41 - Figure 3.16
-
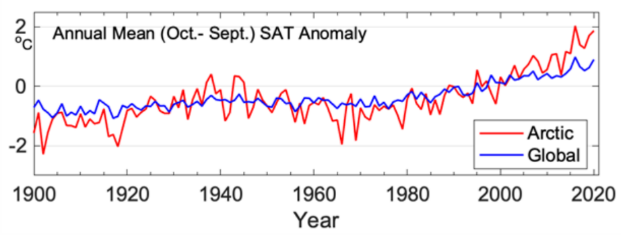
Warming in the Arctic has been significantly faster than anywhere else on Earth (Ballinger et al. 2020). Trends in land surface temperature are shown on Figure 2-2. STATE OF THE ARCTIC TERRESTRIAL BIODIVERSITY REPORT - Chapter 2 - Page 23 - Figure 2.2
-

Change in plant phenology over time based on published studies, ranging from 9 to 21 years of duration. The bars show the proportion of observations where timing of phenological events advanced (earlier) was stable or were delayed (later) over time. The darker portions of each bar represent visible decrease, stable state, or increase results, and lighter portions represent marginally significant change. The numbers above each bar indicate the number of observations in that group. Figure from Bjorkman et al. 2020. STATE OF THE ARCTIC TERRESTRIAL BIODIVERSITY REPORT - Chapter 3 - Page 31- Figure 3.3