 CAFF - Arctic Biodiversity Data Service (ABDS)
Biota
Type of resources
Available actions
Topics
Keywords
Contact for the resource
Provided by
Years
Formats
Representation types
Update frequencies
status
-
This report attempts to review the abundance, status and distribution of natural wild goose populations in the northern hemisphere. The report comprises three parts that 1) summarise key findings from the study and the methodology and analysis applied; 2) contain the individual accounts for each of the 68 populations included in this report; and 3) provide the datasets compiled for this study which will be made accessible on the Arctic Biodiversity Data Service.
-

Geographic area covered by the Arctic Biodiversity Assessment and the CBMP–Terrestrial Plan. Subzones A to E are depicted as defined in the Circumpolar Arctic Vegetation Map (CAVM Team 2003). Subzones A, B and C are the high Arctic while subzones D and E are the low Arctic. Definition of high Arctic, low Arctic, and sub-Arctic follow Hohn & Jaakkola 2010. STATE OF THE ARCTIC TERRESTRIAL BIODIVERSITY REPORT - Chapter 1 - Page 14 - Figure 1.2
-

The Arctic terrestrial food web includes the exchange of energy and nutrients. Arrows to and from the driver boxes indicate the relative effect and counter effect of different types of drivers on the ecosystem. STATE OF THE ARCTIC TERRESTRIAL BIODIVERSITY REPORT - Chapter 2 - Page 26- Figure 2.4
-
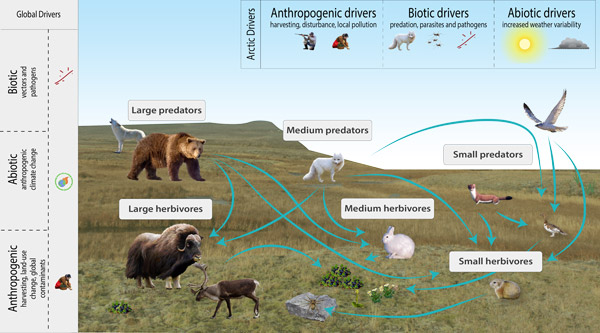
Conceptual model of Arctic terrestrial mammals, showing FECs, interactions with other biotic groups and examples of drivers and attributes relevant at various spatial scales. STATE OF THE ARCTIC TERRESTRIAL BIODIVERSITY REPORT - Chapter 3 - Page 67 - Figure 3.28
-

Trends in total abundance of moths and species richness, from two locations in Iceland, 1995–2016. Trends differ between locations. The solid and dashed straight lines represent linear regression lines which are significant or non-significant, respectively. Modified from Gillespie et al. 2020a. STATE OF THE ARCTIC TERRESTRIAL BIODIVERSITY REPORT - Chapter 3 - Page 41 - Figure 3.14
-
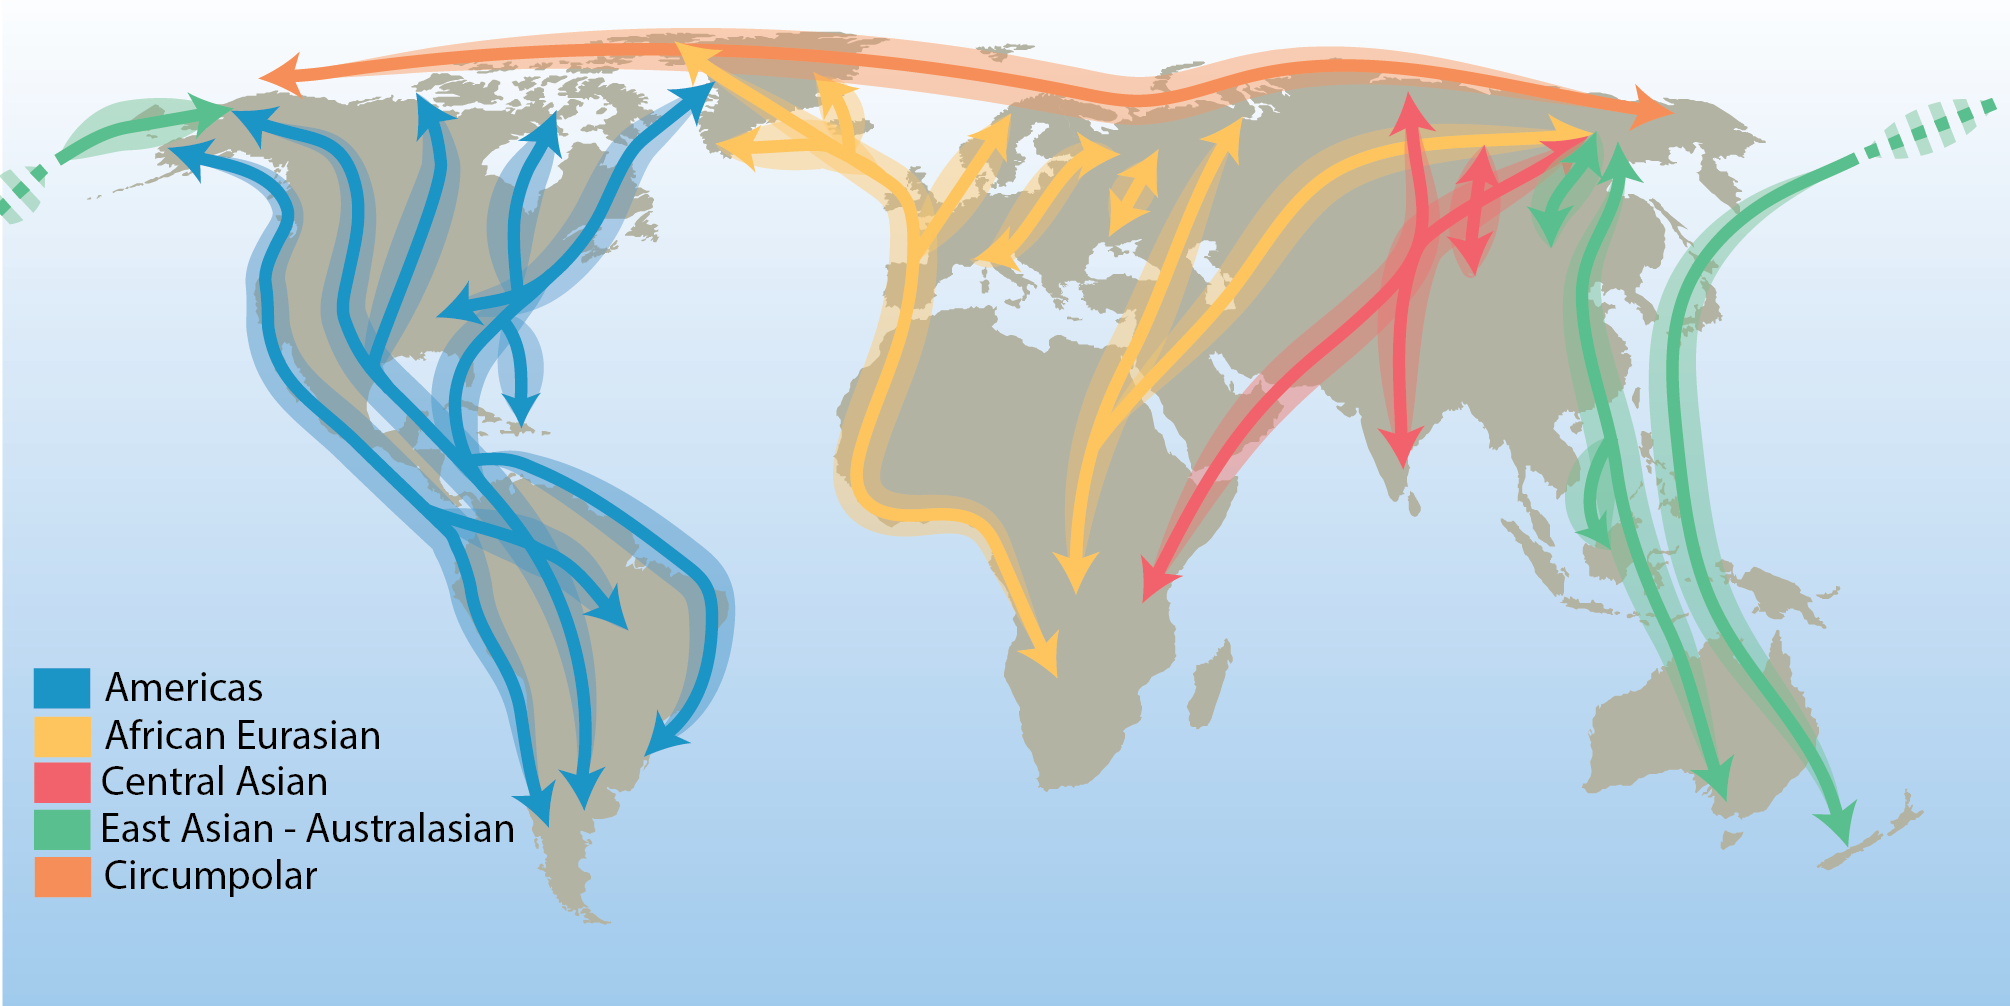
There are few true Arctic specialist birds that remain in the Arctic throughout their annual cycle. They include the willow and rock ptarmigan (Lagopus lagopus and L. muta), gyrfalcon (Falco rusticolus), snowy owl (Bubo scandiacus), Arctic redpoll (Carduelis hornemanni) and northern raven (Corvus corax)—a cosmopolitan species with resident populations in the Arctic. All other terrestrial Arctic-breeding bird species migrate to warmer regions during the northern winter, connecting the Arctic to all corners of the globe. Hence, their distributions are influenced by the routes they follow. These distinct migration routes are referred to as flyways and are defined by a combination of ecological and political boundaries and differ in spatial scale. The CBMP refers to the traditional four north–south flyways, in addition to a circumpolar flyway representing the few species that remain largely within the Arctic year-round (Figure 3-20). STATE OF THE ARCTIC TERRESTRIAL BIODIVERSITY REPORT - Chapter 3 - Page 48- Figure 3.20
-
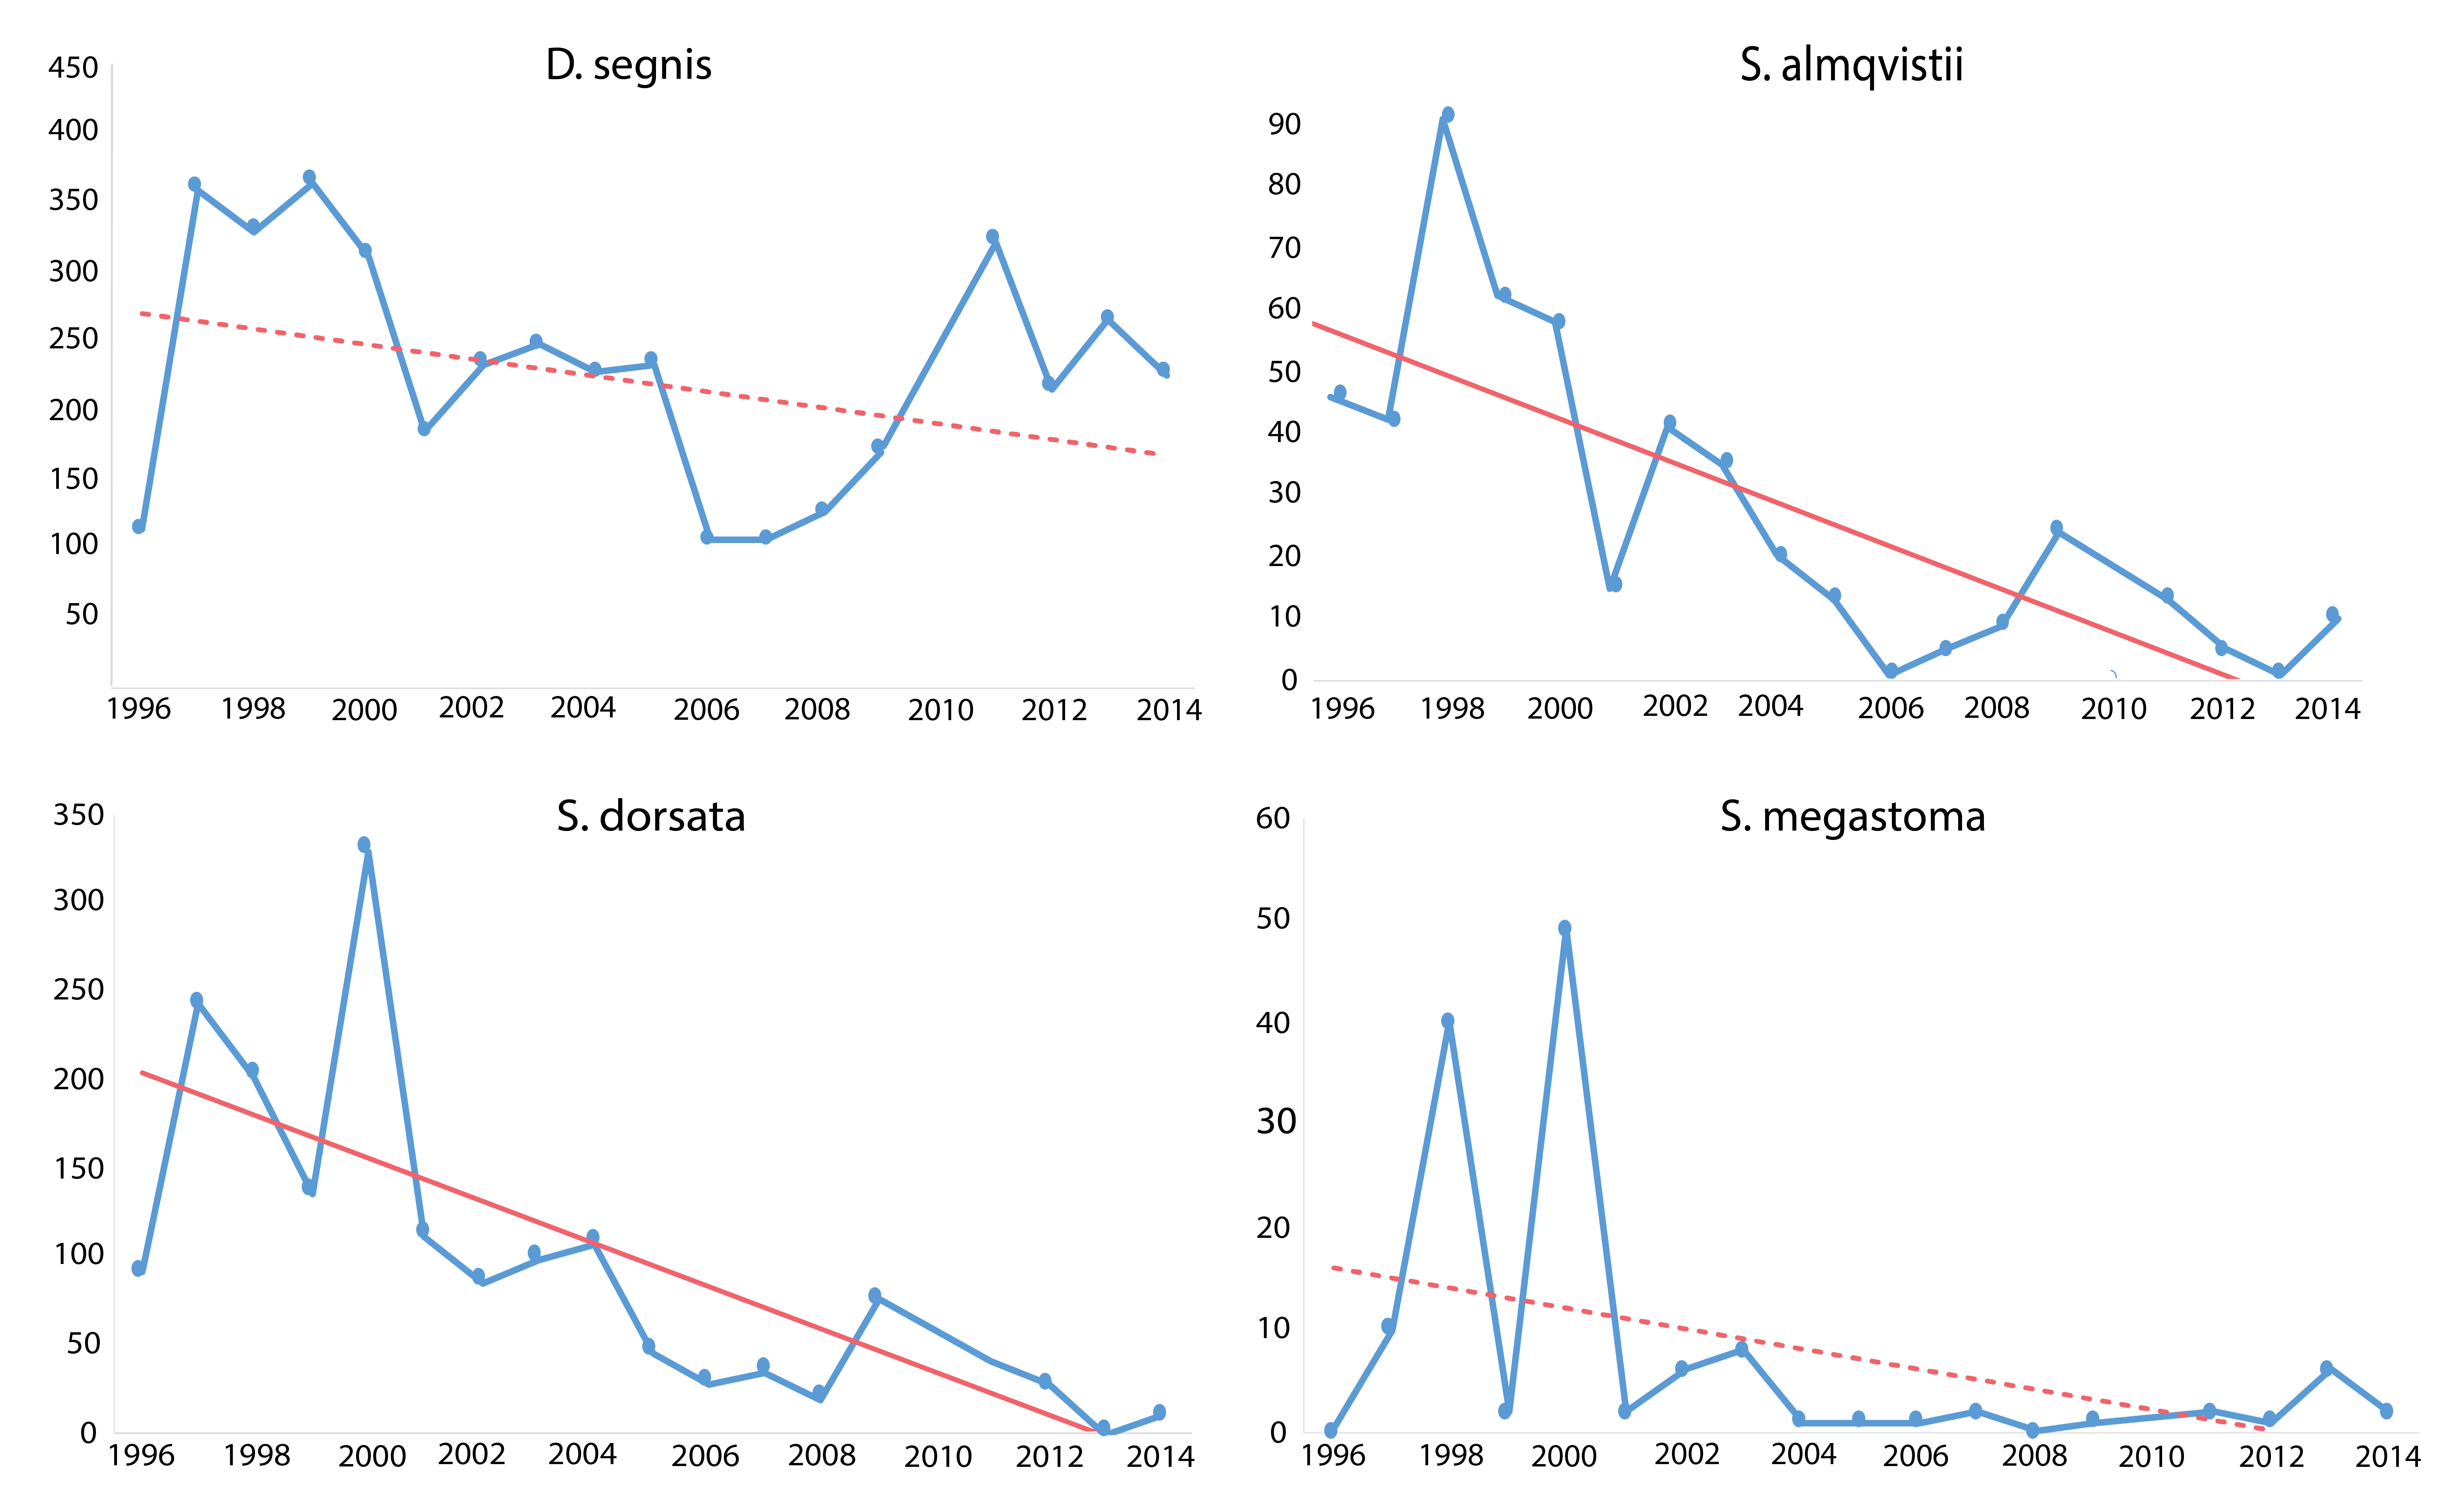
Trends in four muscid species occurring at Zackenberg Research Station, east Greenland, 1996–2014. Declines were detected in several species over five or more years. Significant regression lines drawn as solid. Non-significant as dotted lines. Modified from Gillespie et al. 2020a. (in the original figure six species showed a statistically significant decline, seven a non-significant decline and one species a non-significant rise) STATE OF THE ARCTIC TERRESTRIAL BIODIVERSITY REPORT - Chapter 3 - Page 39 - Figure 3.11
-
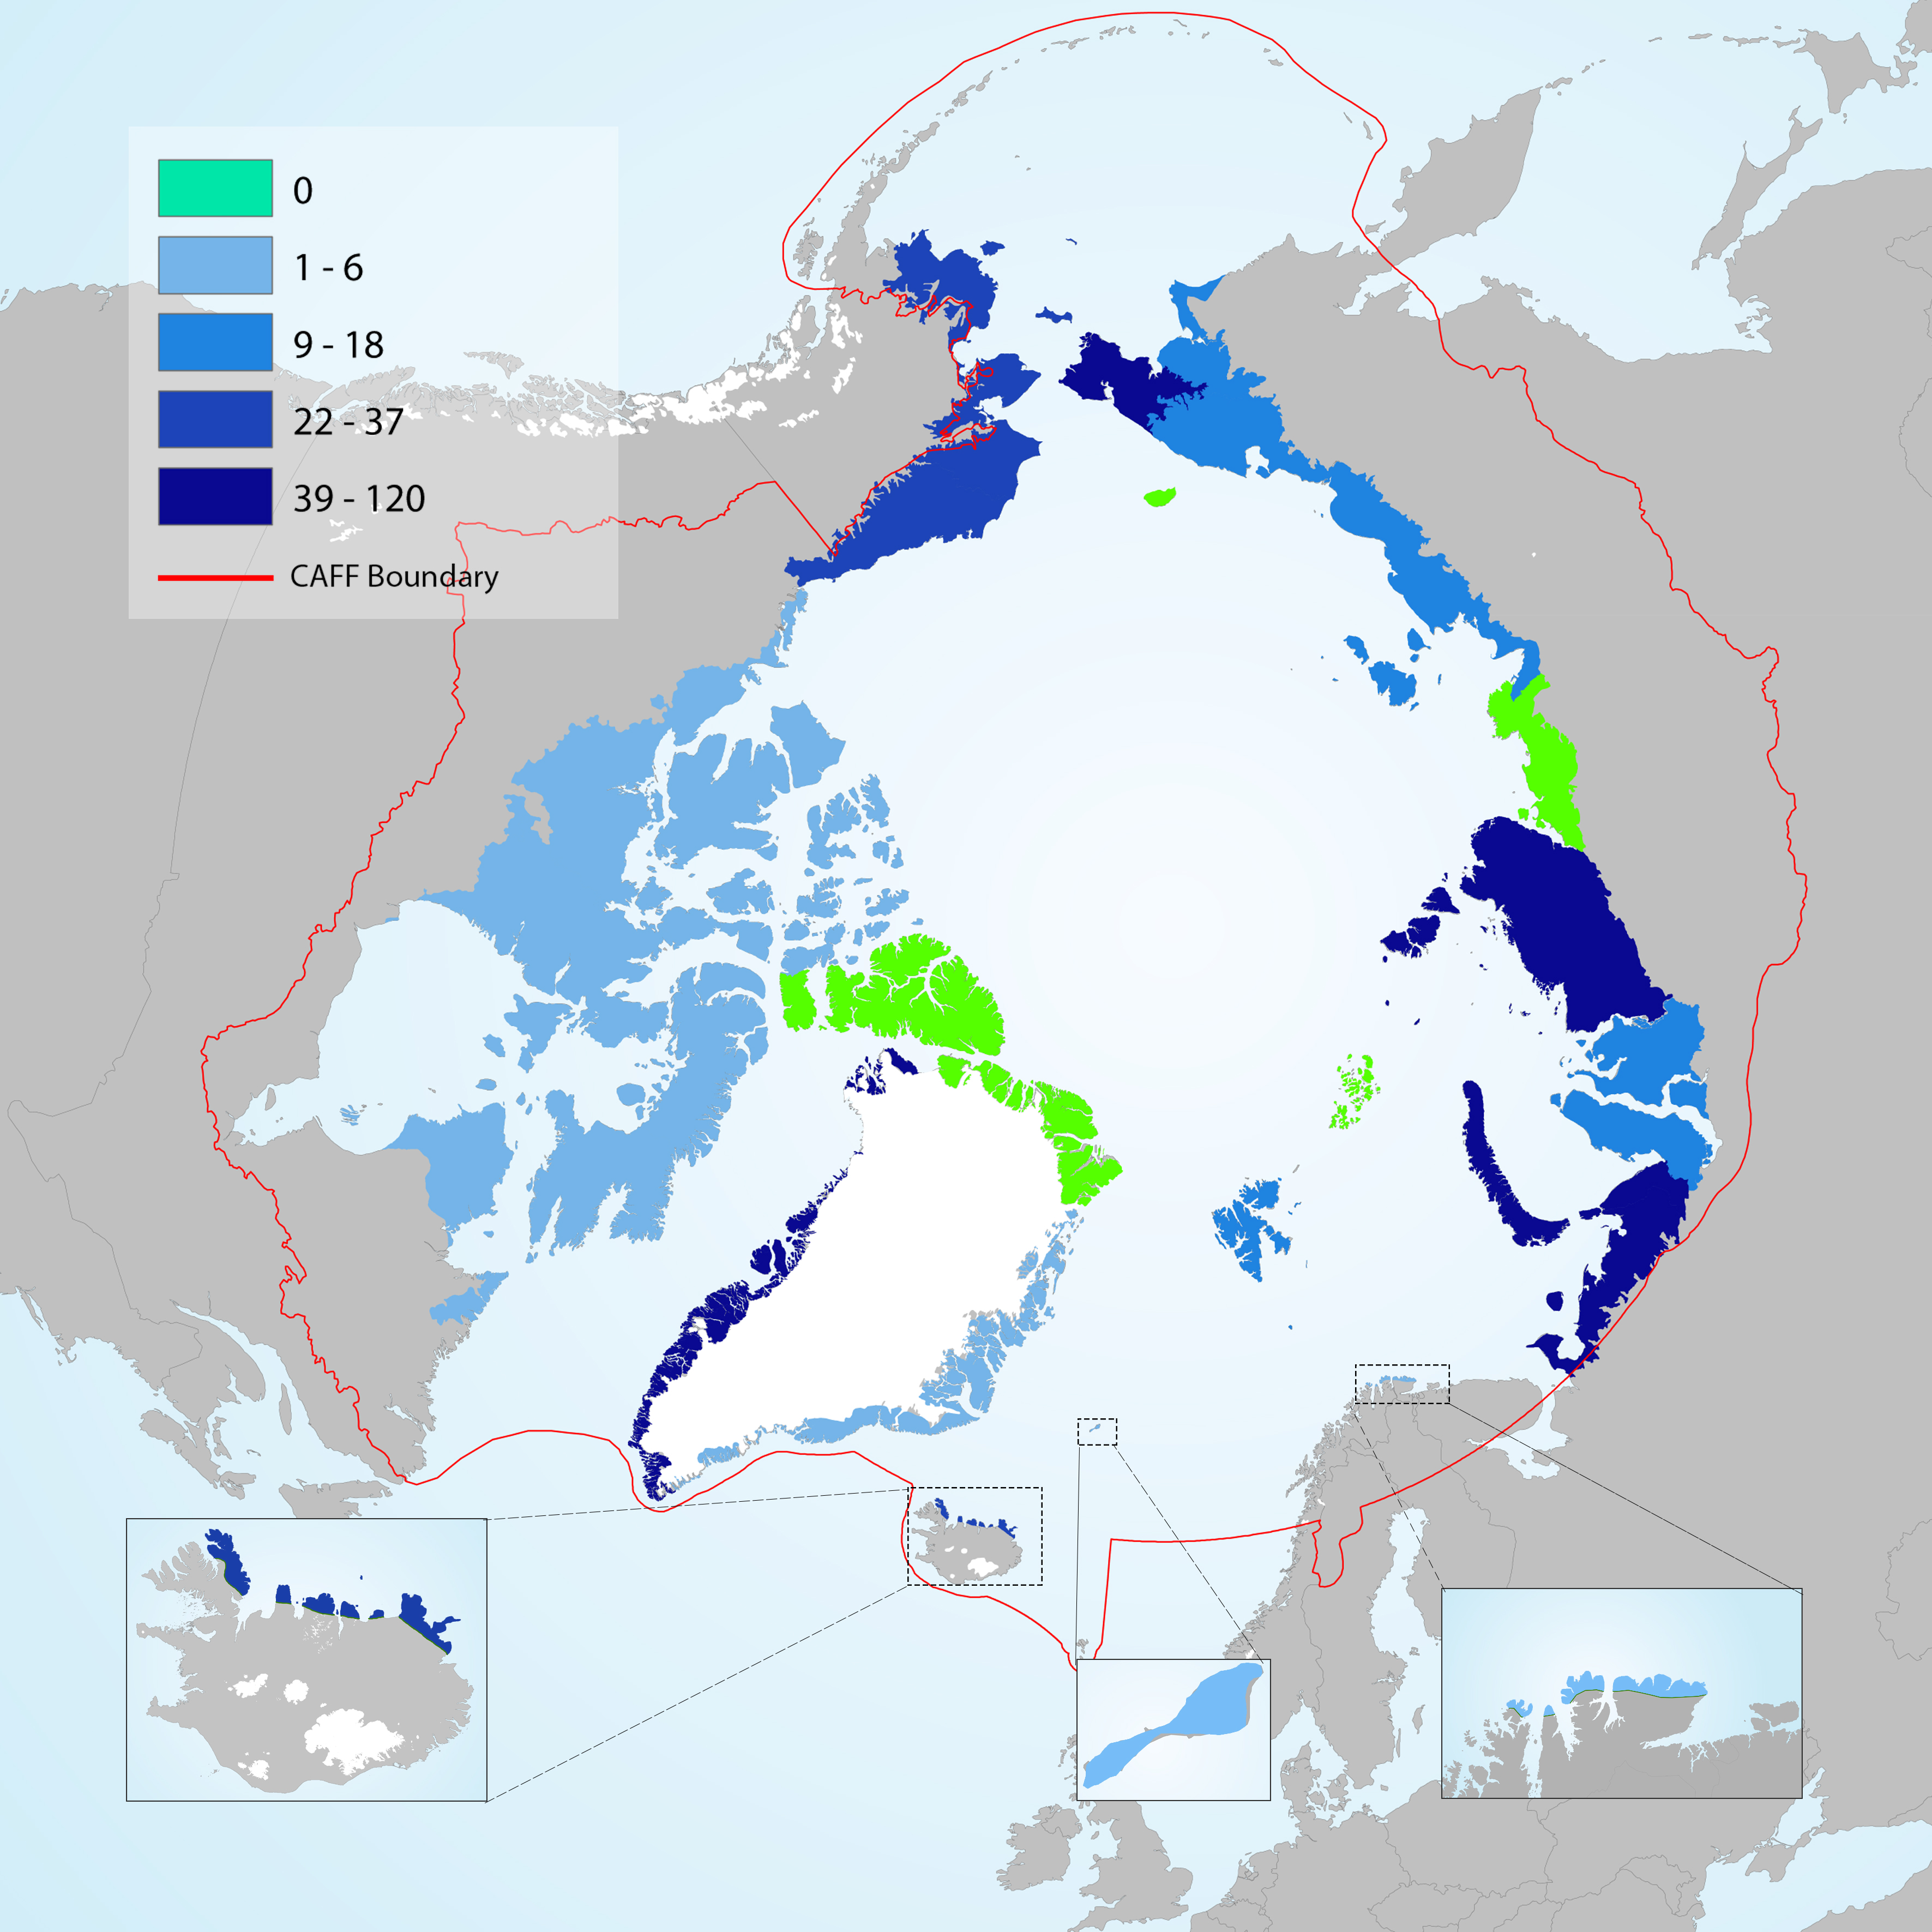
Number of non-native plant taxa that have become naturalised across the Arctic. No naturalised non-native taxa are recorded from Wrangel Island, Ellesmere Land – northern Greenland, Anabar-Olenyok and Frans Josef Land. Modified from Wasowicz et al. 2020 STATE OF THE ARCTIC TERRESTRIAL BIODIVERSITY REPORT - Chapter 3 - Page 32 - Figure 3.4
-
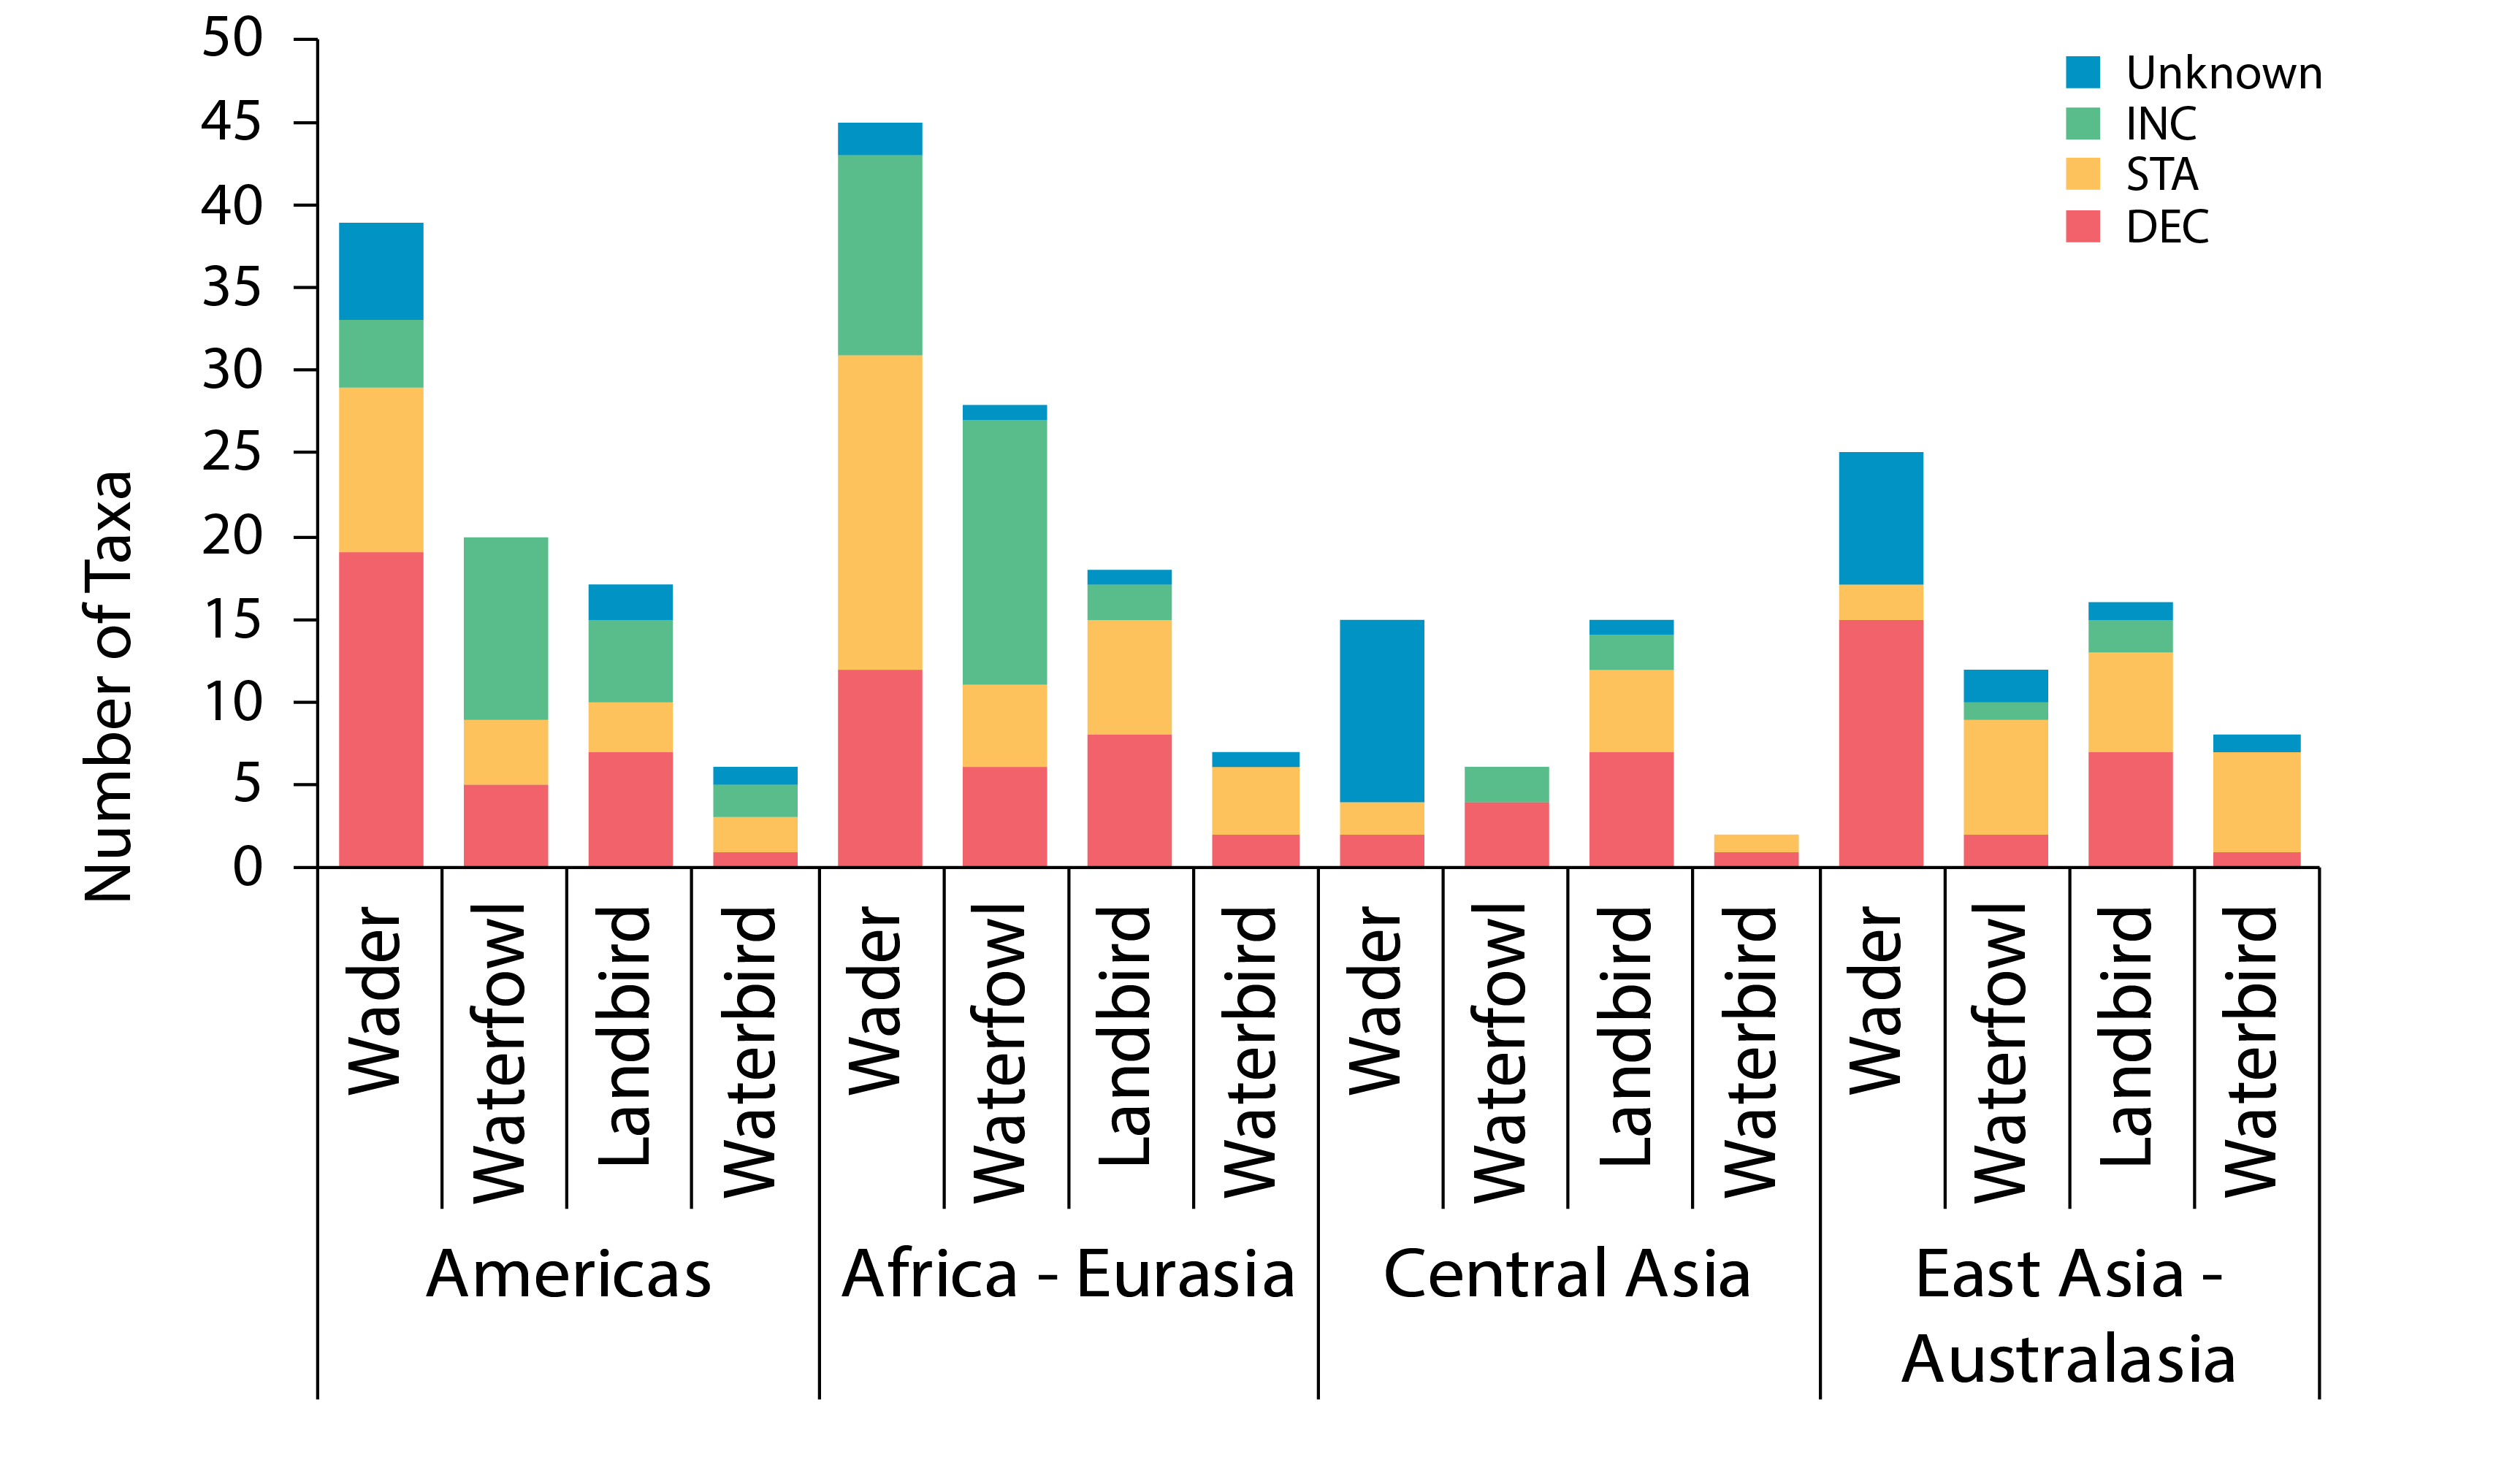
Trends in Arctic terrestrial bird population abundance for four taxonomic groupings in four global flyways. Data are presented as total number of taxa (species, subspecies). Modified from Smith et al. 2020. These broad patterns were generally consistent across flyways, with some exceptions. Fewer waterfowl populations increased in the Central Asian and East Asian–Australasian Flyways. The largest proportion of declining species was among the waders in all but the Central Asian Flyway where the trends of a large majority of waders are unknown. Although declines were more prevalent among waders than other taxonomic groups in both the African–Eurasian and Americas Flyways, the former had a substantially larger number of stable and increasing species than the latter (Figure 3-23). STATE OF THE ARCTIC TERRESTRIAL BIODIVERSITY REPORT - Chapter 3 - Page 55 - Figure 3.23
-
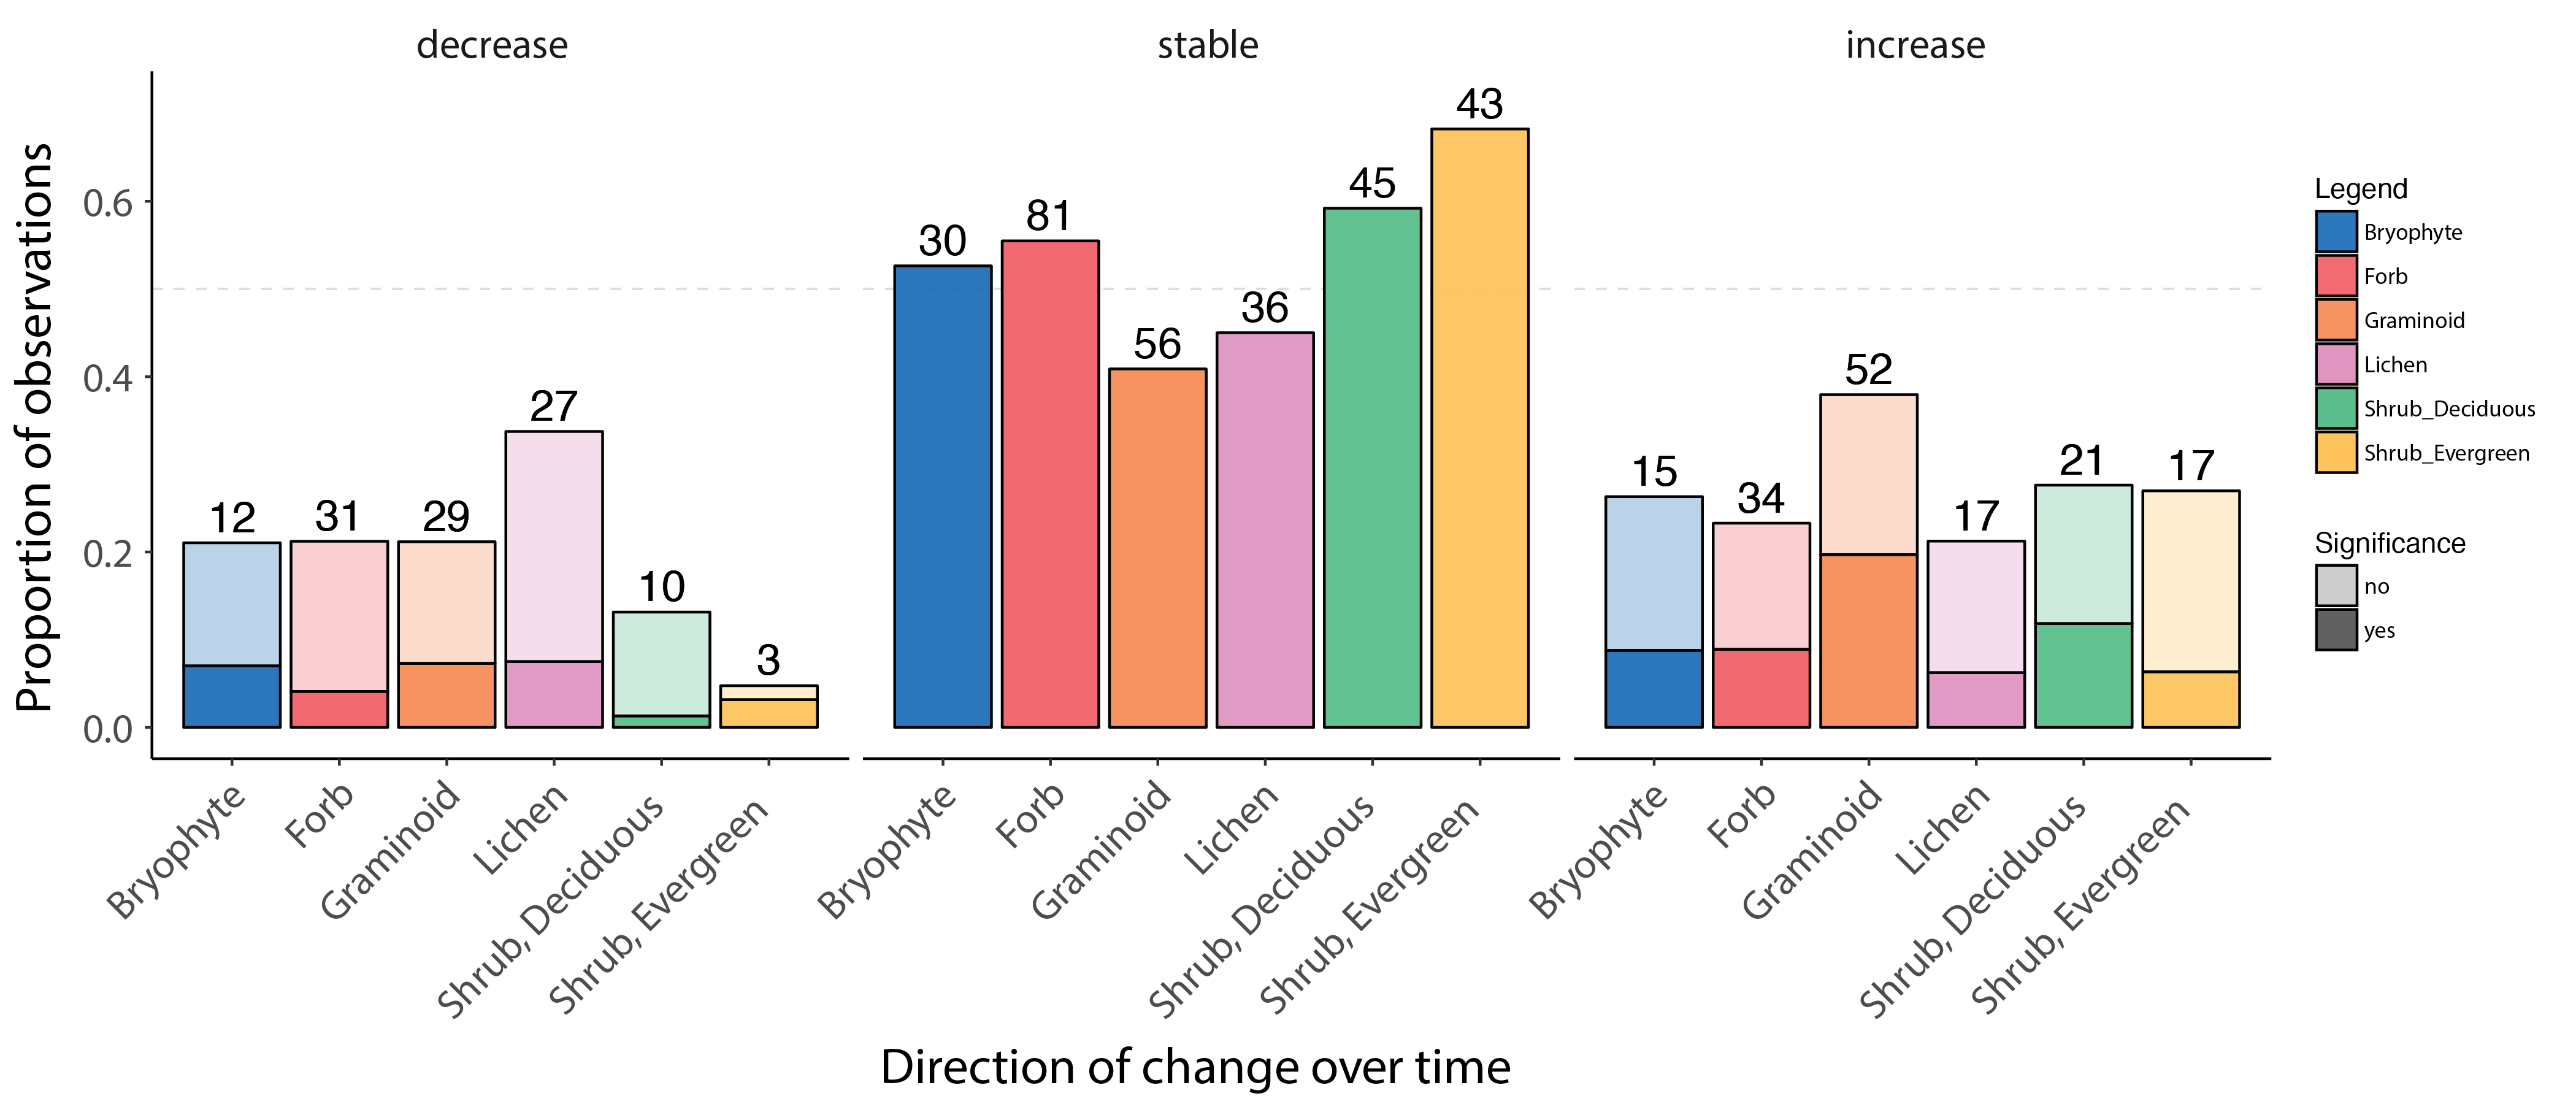
Change in forb, graminoid and shrub abundance by species or functional group over time based on local field studies across the Arctic, ranging from 5 to 43 years of duration. The bars show the proportion of observed decreasing, stable and increasing change in abundance, based on published studies. The darker portions of each bar represent a significant decrease, stable state, or increase, and lighter shading represents marginally significant change. The numbers above each bar indicate the number of observations in that group. Modified from Bjorkman et al. 2020. STATE OF THE ARCTIC TERRESTRIAL BIODIVERSITY REPORT - Chapter 3 - Page 31- Figure 3.2