 CAFF - Arctic Biodiversity Data Service (ABDS)
climatologyMeteorologyAtmosphere
Type of resources
Available actions
Topics
Keywords
Contact for the resource
Provided by
Representation types
Update frequencies
status
-
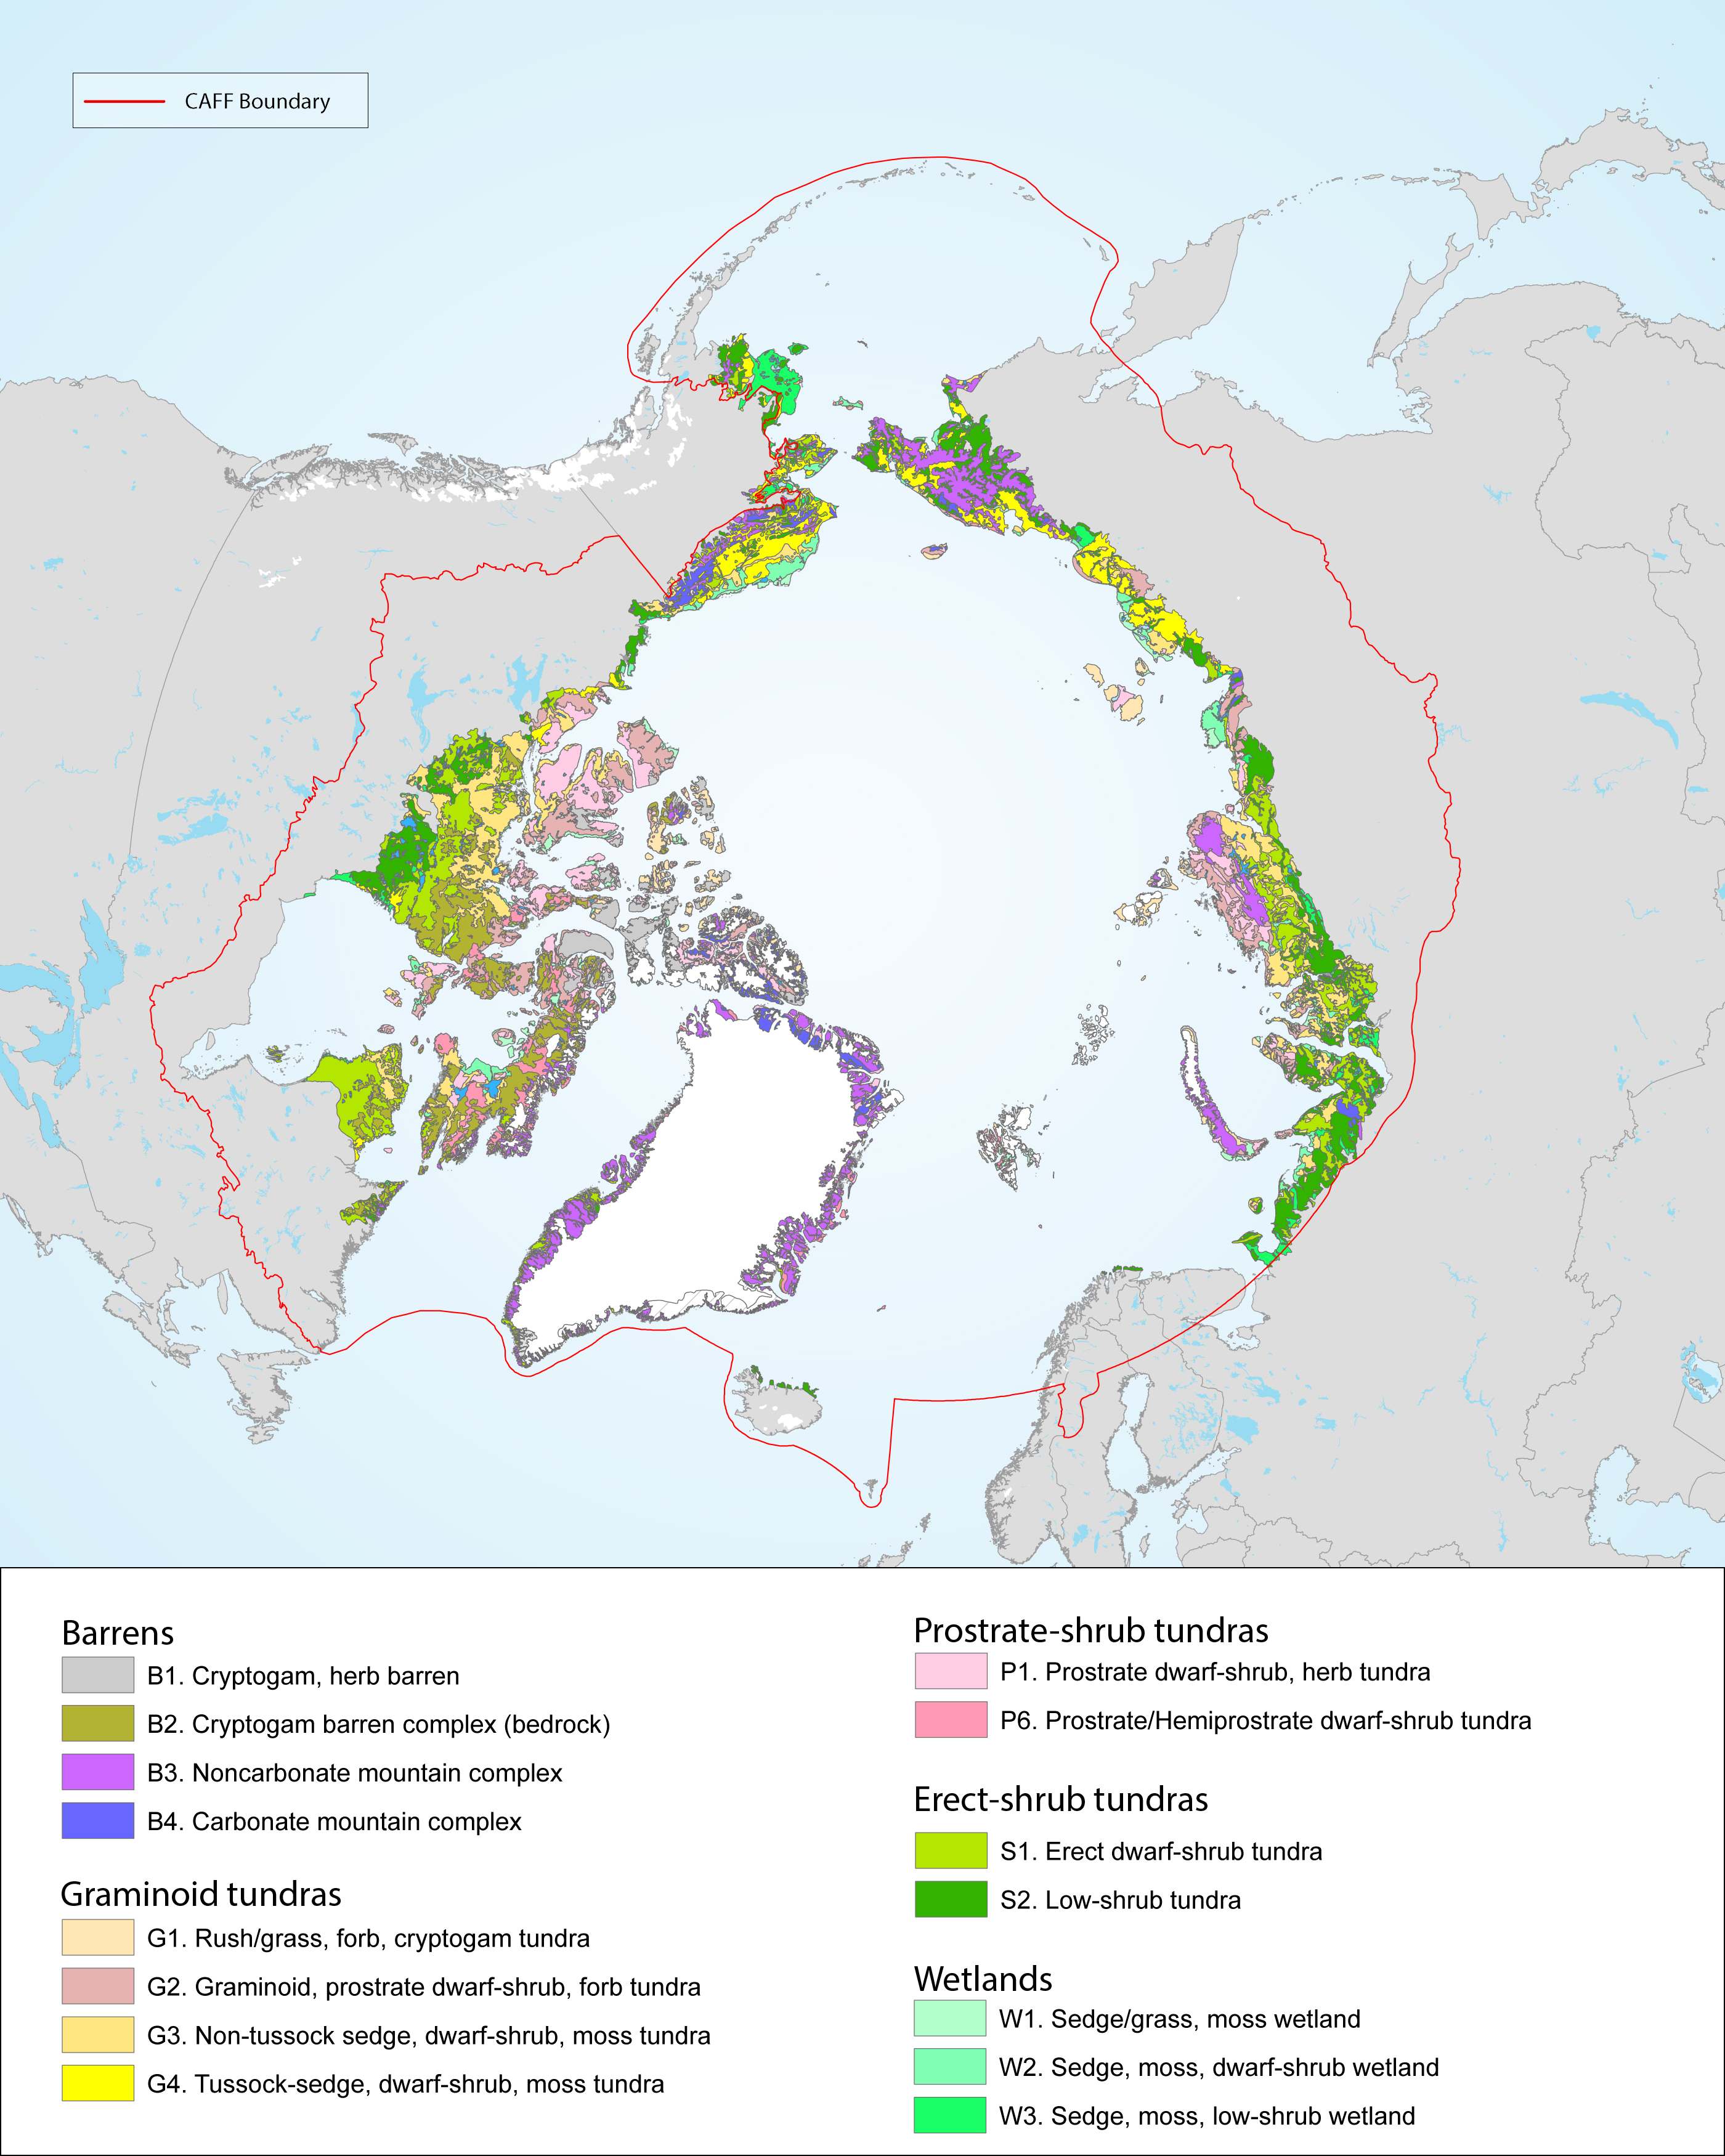
There is a great variation and heterogeneity among terrestrial Arctic ecosystems. This is further described as biogeographical areas in the Annotated Checklist of the Pan-Arctic Flora (Elven et al. 2020), as vegetation zones (Walker et al. 2005, Raynolds et al 2019) or as ecoregions recognised by Terrestrial Ecoregions of the World (Olson et al. 2001). The START focuses on high and low Arctic regions consistent with the CAVM’s subzones A to E, as shown in Figure 1-2 and Figure 2-1 STATE OF THE ARCTIC TERRESTRIAL BIODIVERSITY REPORT - Chapter 2 - Page 19 - Figure 2.1
-

Arctic foxes are currently monitored at 34 sites throughout the North, with most monitoring efforts concentrated in Fennoscandia (Figure 3-32). The duration of monitoring across all sites is variable at between 2 and 56 years and was ongoing at 27 of the 34 sites (79%) as of 2015. Monitoring projects cover almost equally the four climate zones of the species’ distribution—high Arctic, low Arctic, sub-Arctic, and montane/alpine. STATE OF THE ARCTIC TERRESTRIAL BIODIVERSITY REPORT - Chapter 3 - Page 82 - Figure 3.32
-
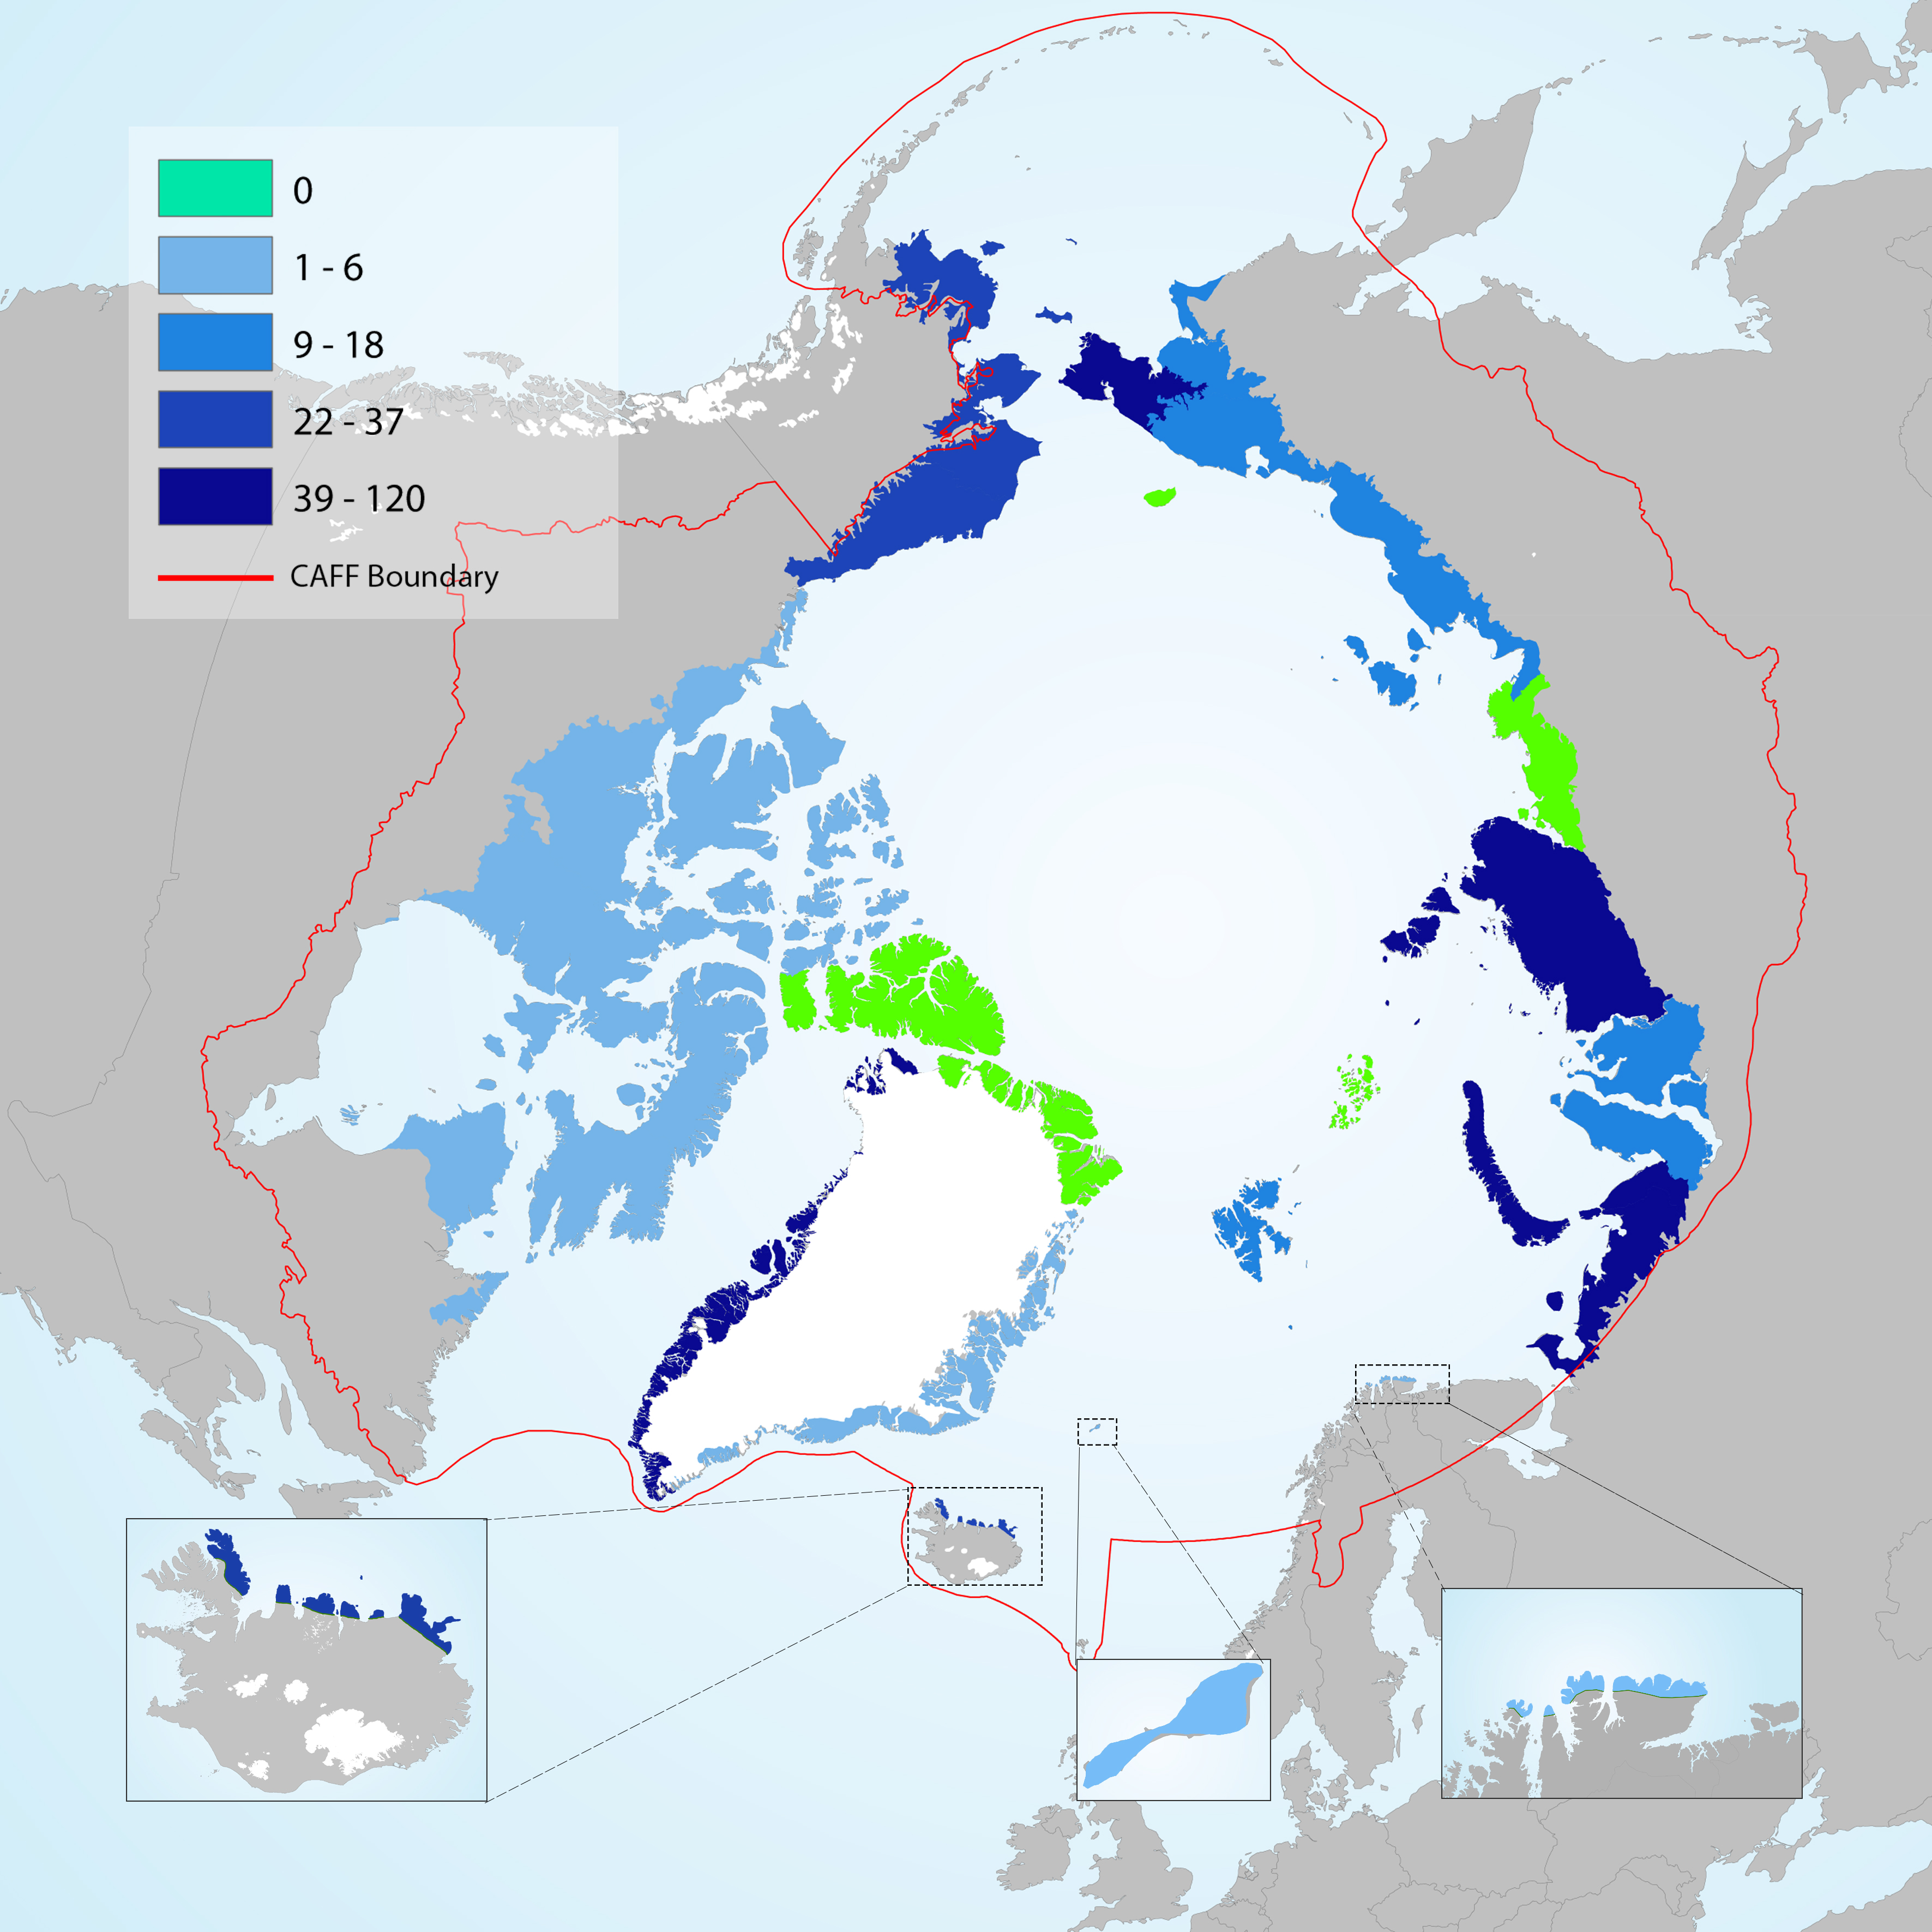
Number of non-native plant taxa that have become naturalised across the Arctic. No naturalised non-native taxa are recorded from Wrangel Island, Ellesmere Land – northern Greenland, Anabar-Olenyok and Frans Josef Land. Modified from Wasowicz et al. 2020 STATE OF THE ARCTIC TERRESTRIAL BIODIVERSITY REPORT - Chapter 3 - Page 32 - Figure 3.4
-
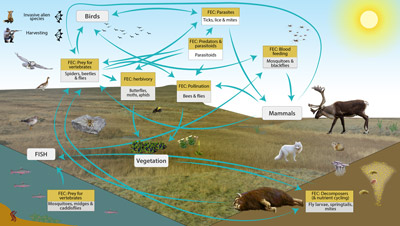
Conceptual model of the FECs and processes mediated by more than 2,500 species of Arctic arthropods known from Greenland, Iceland, Svalbard, and Jan Mayen. STATE OF THE ARCTIC TERRESTRIAL BIODIVERSITY REPORT - Chapter 3 - Page 37- Figure 3.7
-
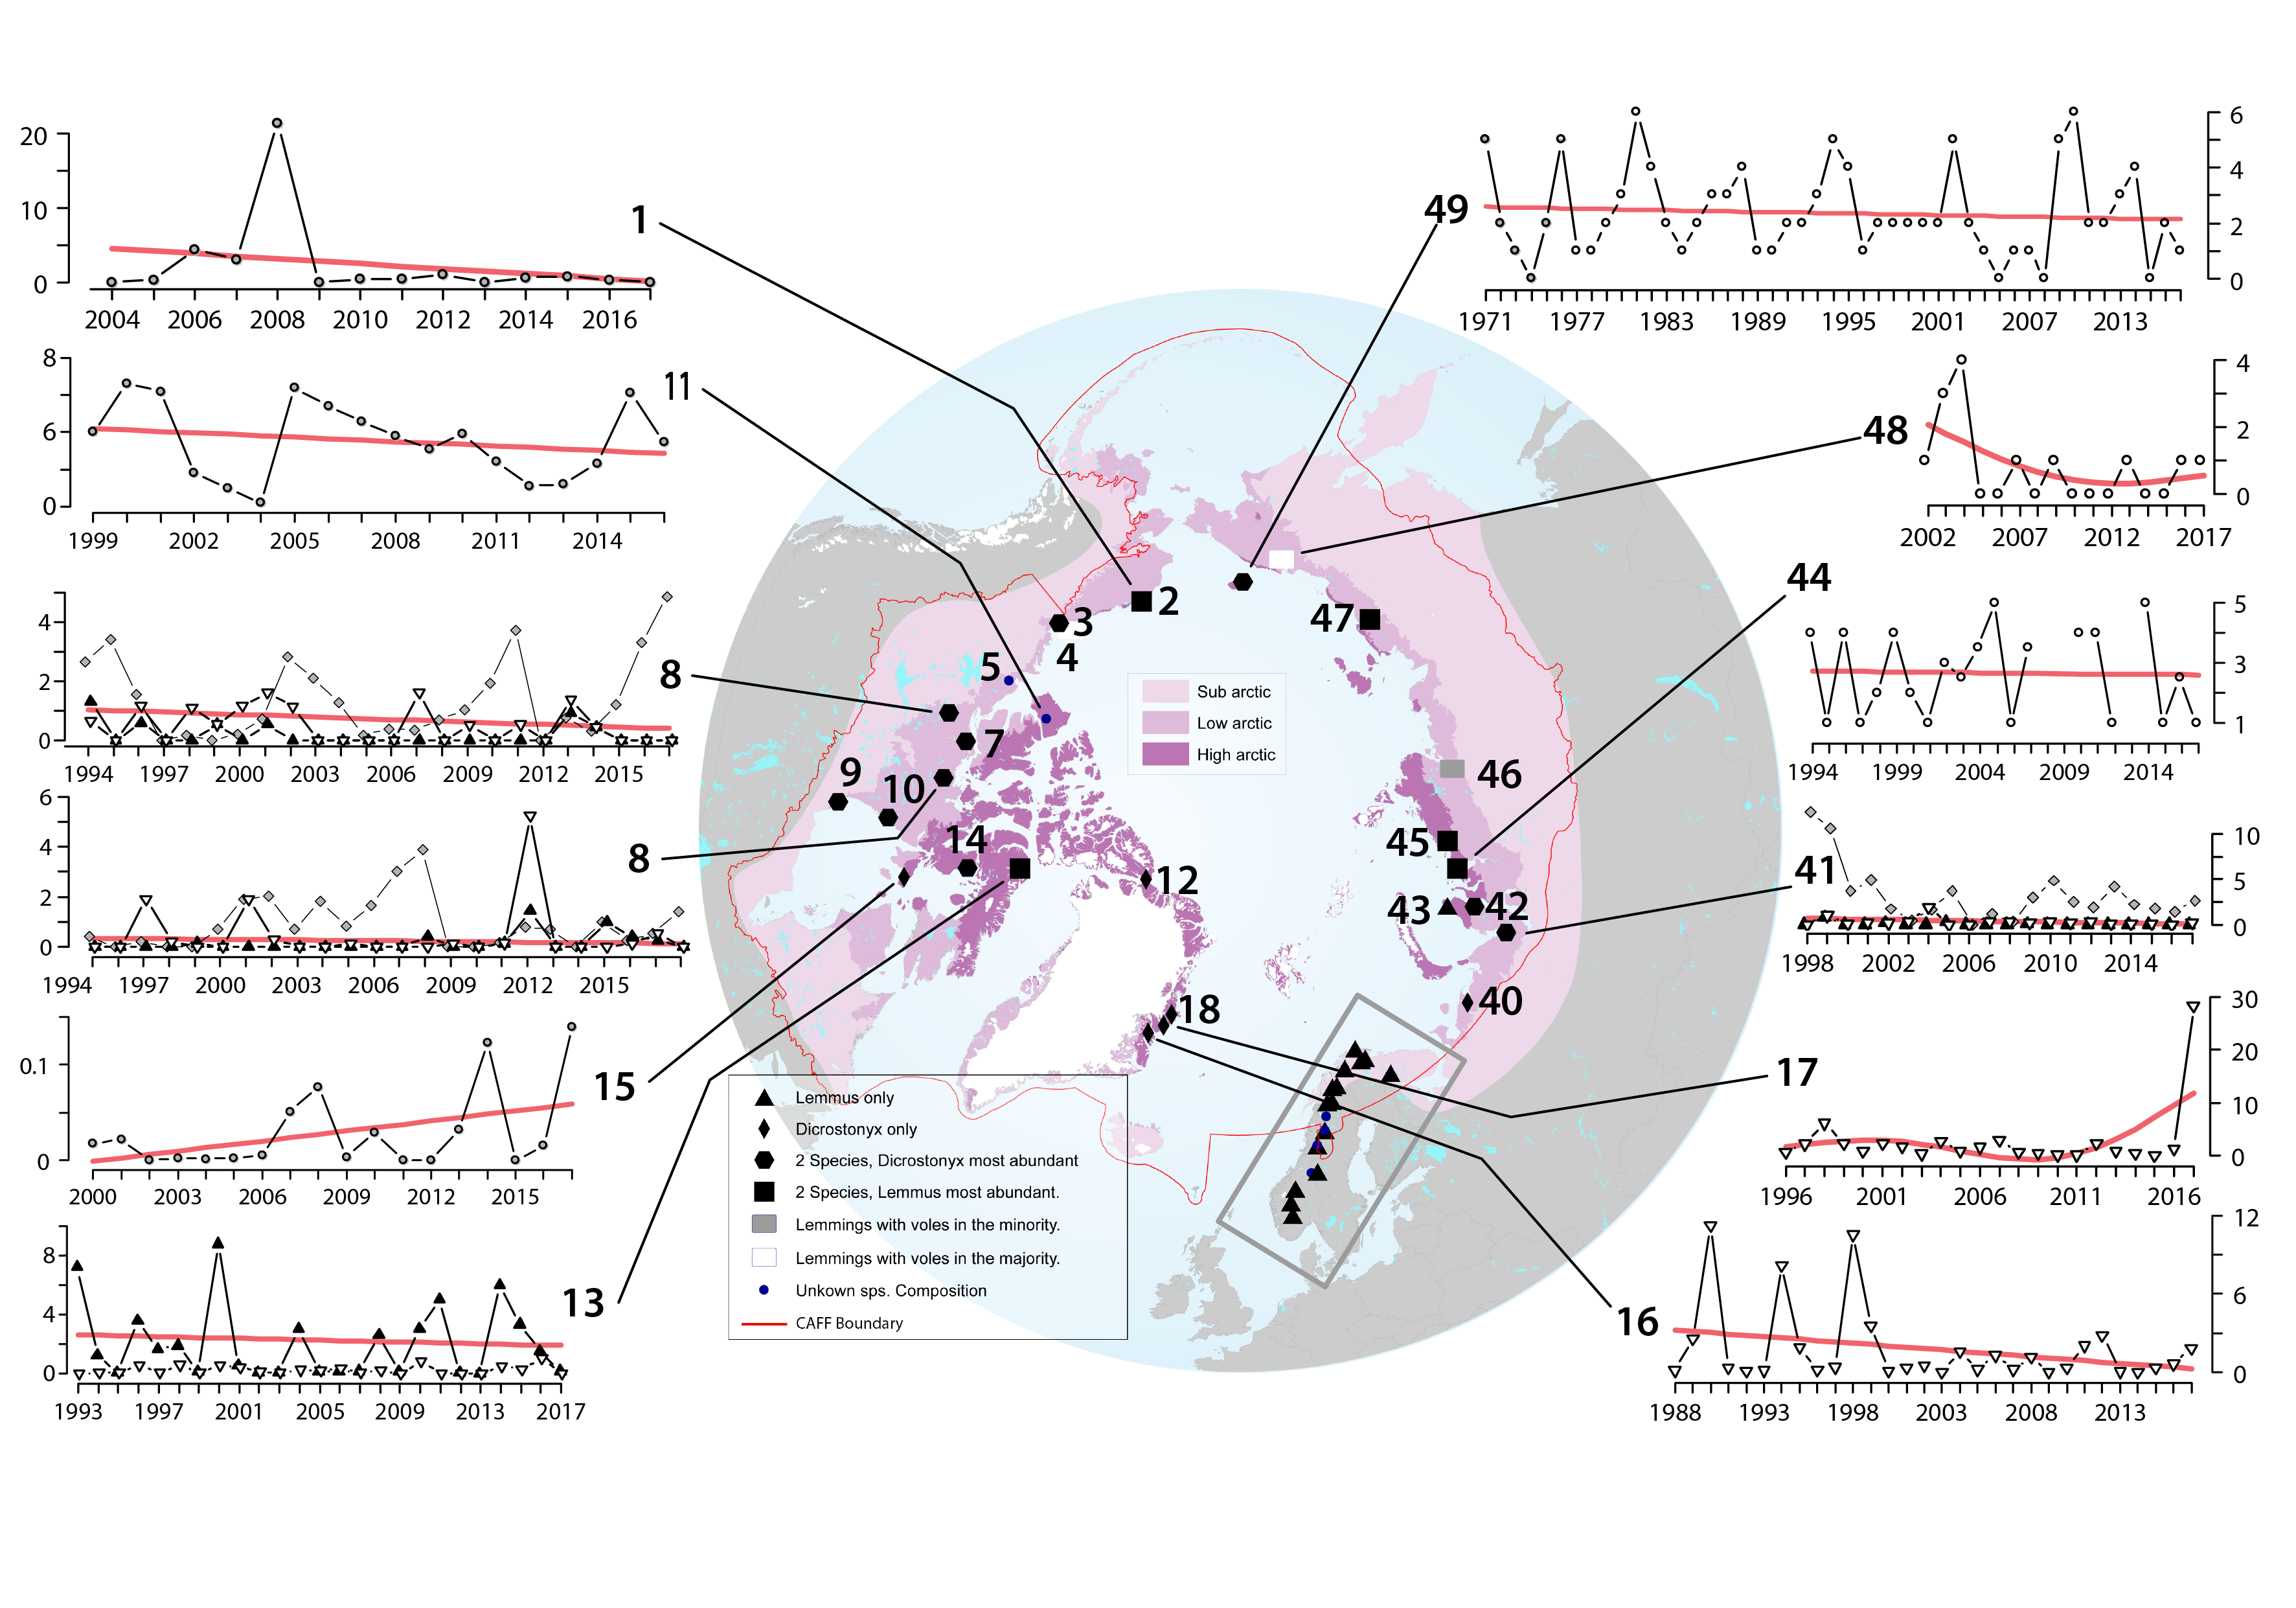
Lemmings are currently being monitored at 38 sites. Their status and trends were determined based on data from these sites as well as recent data (since 2000) from an additional 11 previous monitoring sites (Figure 3-31). Of those sites monitored, Fennoscandia is overrepresented relative to the geographical area it covers, whereas Russia is underrepresented. Based on the skewed geographical coverage, more information is available for some species of lemmings than others, particularly the Norwegian lemming. STATE OF THE ARCTIC TERRESTRIAL BIODIVERSITY REPORT - Chapter 3 - Page 80 - Figure 3.31
-
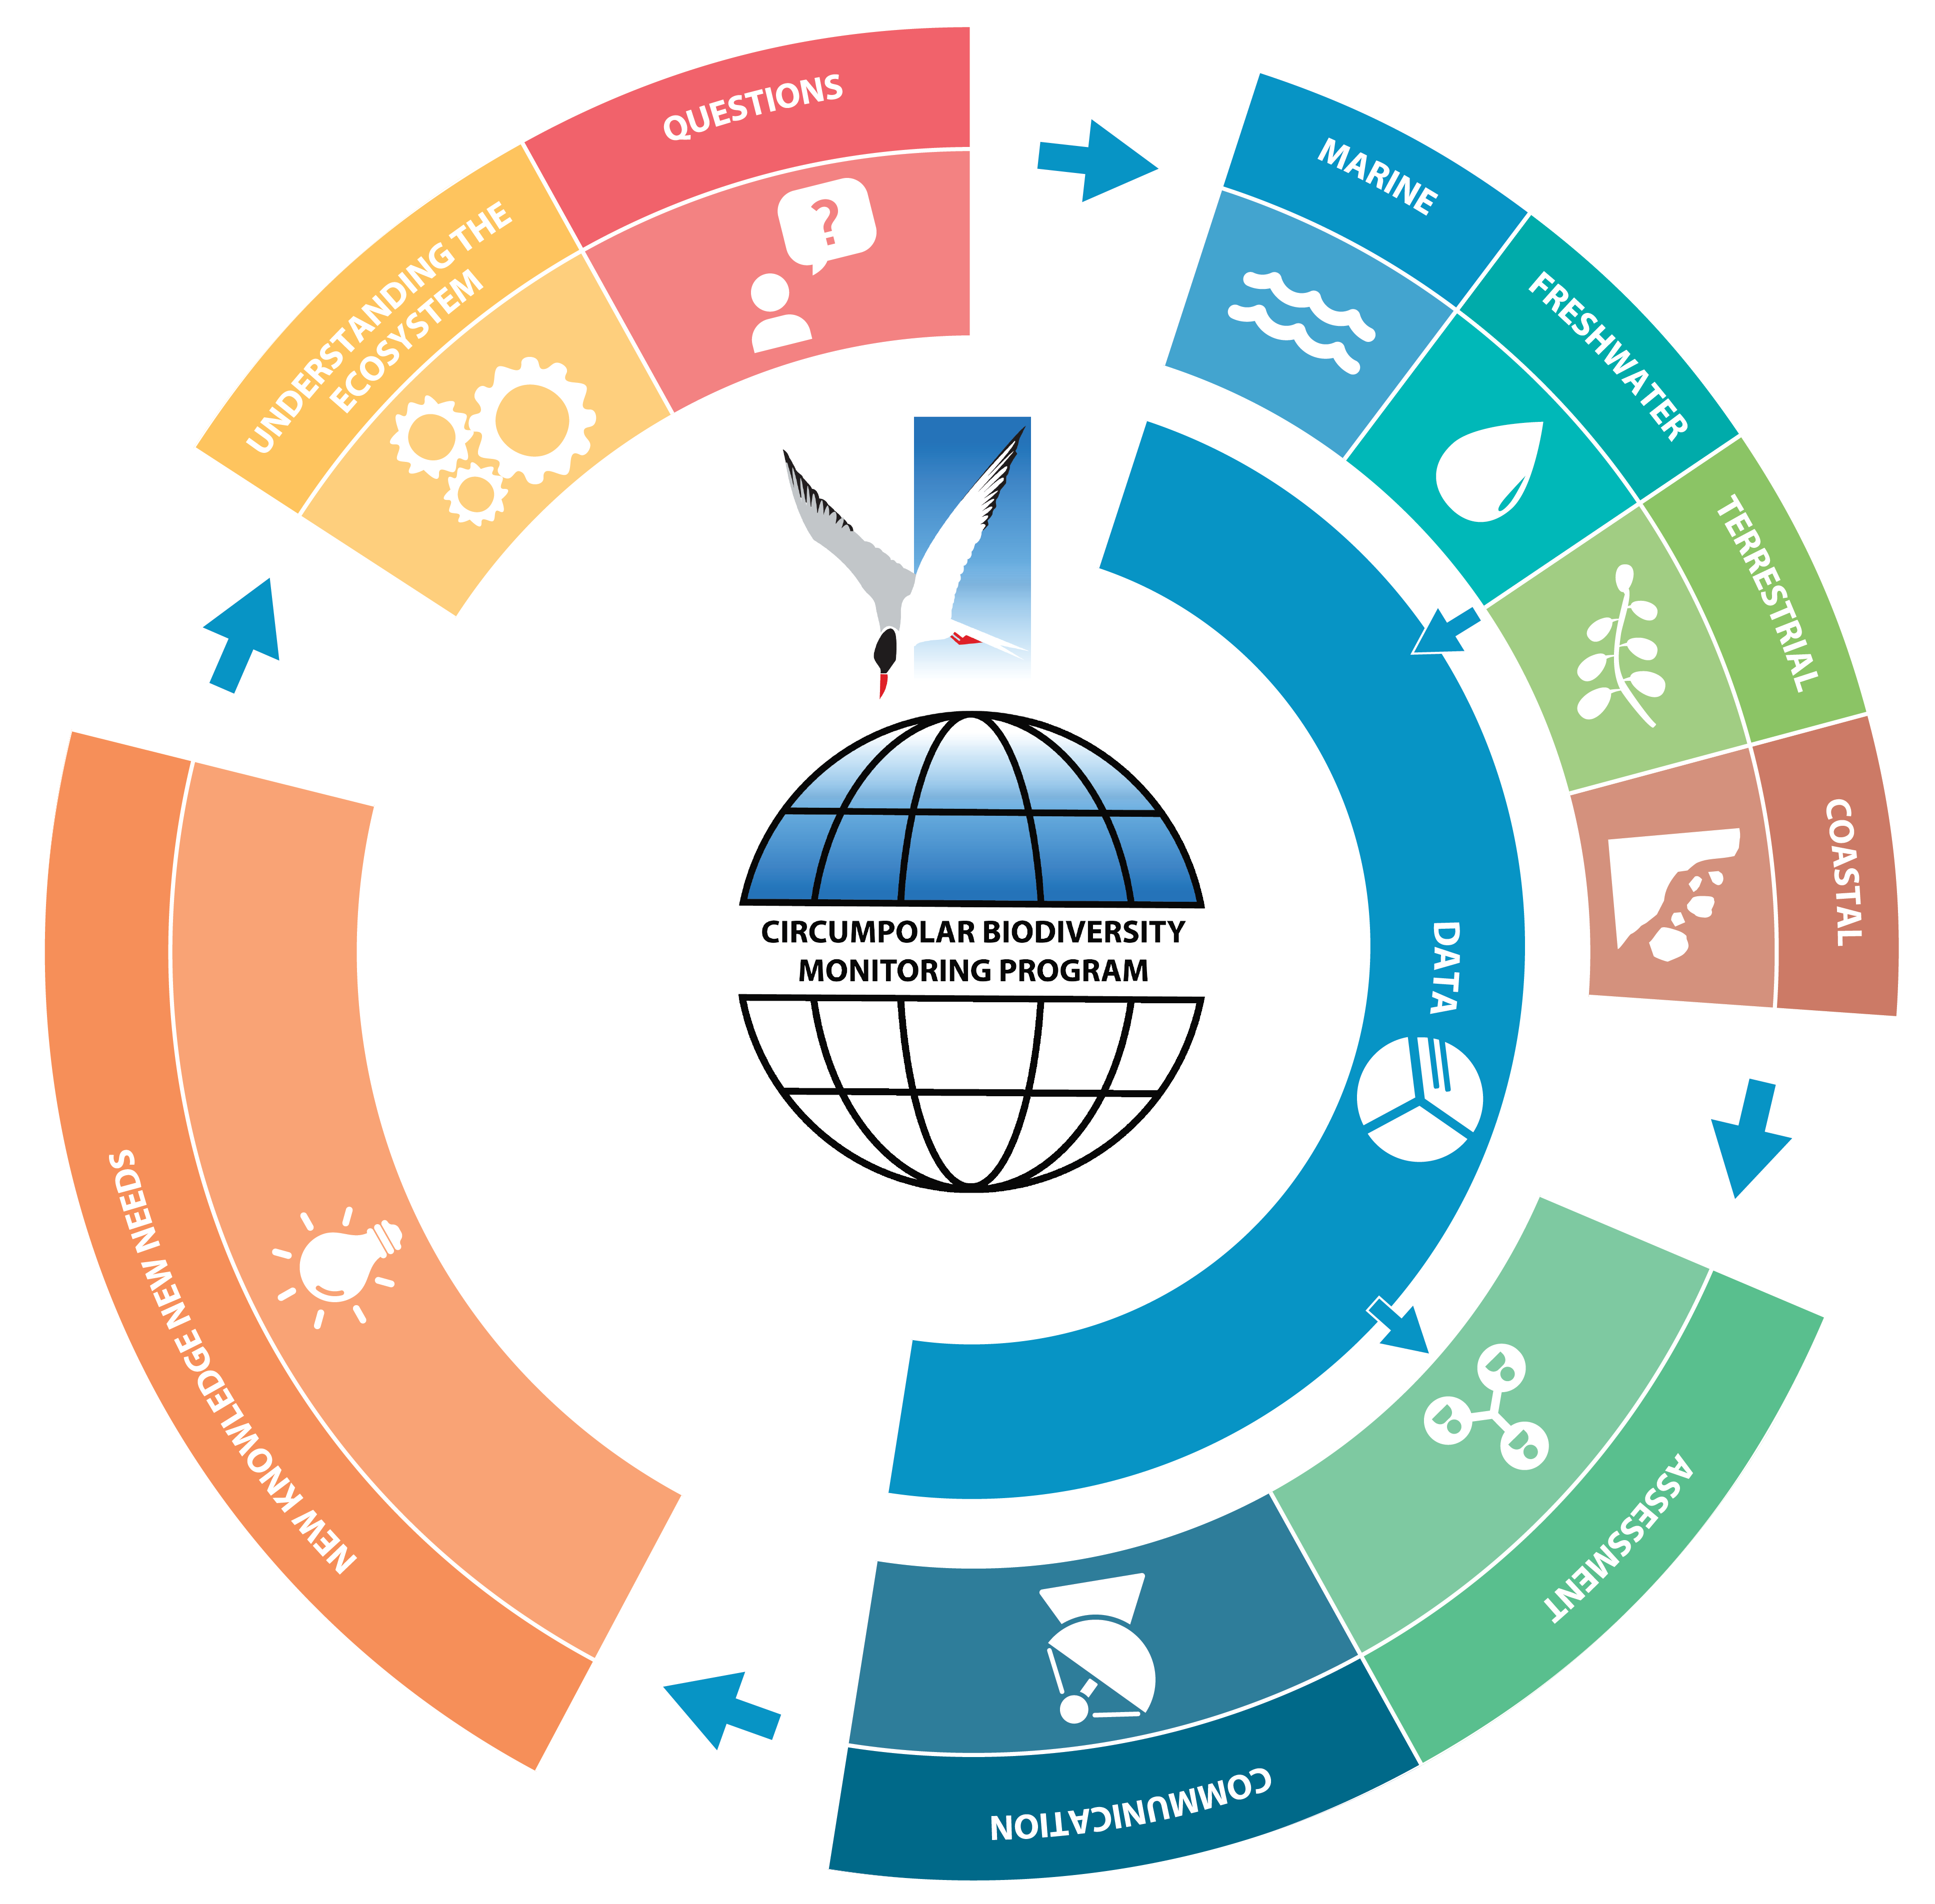
Figure 1-1. CBMP’s adaptive, integrated ecosystem–based approach to inventory, monitoring and data management. This figure illustrates how management questions, conceptual ecosystem models based on science, Indigenous Knowledge, and Local Knowledge, and existing monitoring networks guide the four CBMP monitoring plans––marine, freshwater, terrestrial and coastal. Monitoring outputs (data) feed into the assessment and decision-making processes and guide refinement of the monitoring programmes themselves. Modified from CAFF 2017 STATE OF THE ARCTIC TERRESTRIAL BIODIVERSITY REPORT - Chapter 1 - Page 4 - Figure 1-1
-
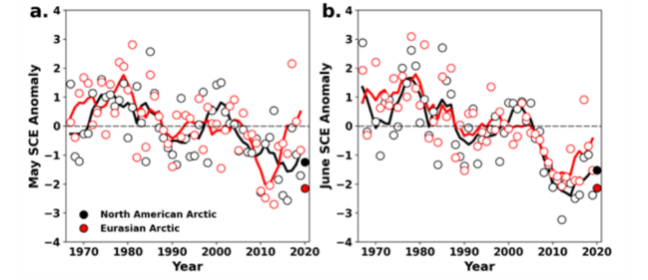
Monthly snow cover extent (SCE) for Arctic land areas (>60° N) for (a) May and (b) June 1967–2020, a 54-year record. Anomalies are relative to the 1981–2010 average and standardised (each observation was differenced from the mean and divided by the standard deviation, and thus unitless). Solid black and red lines depict 5-year running means for North America and Eurasia, respectively. Filled circles are used to highlight 2020 anomalies. (Mudryk et al. 2020). STATE OF THE ARCTIC TERRESTRIAL BIODIVERSITY REPORT - Chapter 2 - Page 23 - Figure 2.3
-

Temporal trends of arthropod abundance, 1996–2009. Estimated by the number of individuals caught per trap per day during the season from four different pitfall trap plots, each consisting of eight (1996–2006) or four (2007–2009) traps. Modified from Høye et al. 2013. STATE OF THE ARCTIC TERRESTRIAL BIODIVERSITY REPORT - Chapter 3 - Page 41 - Figure 3.16
-
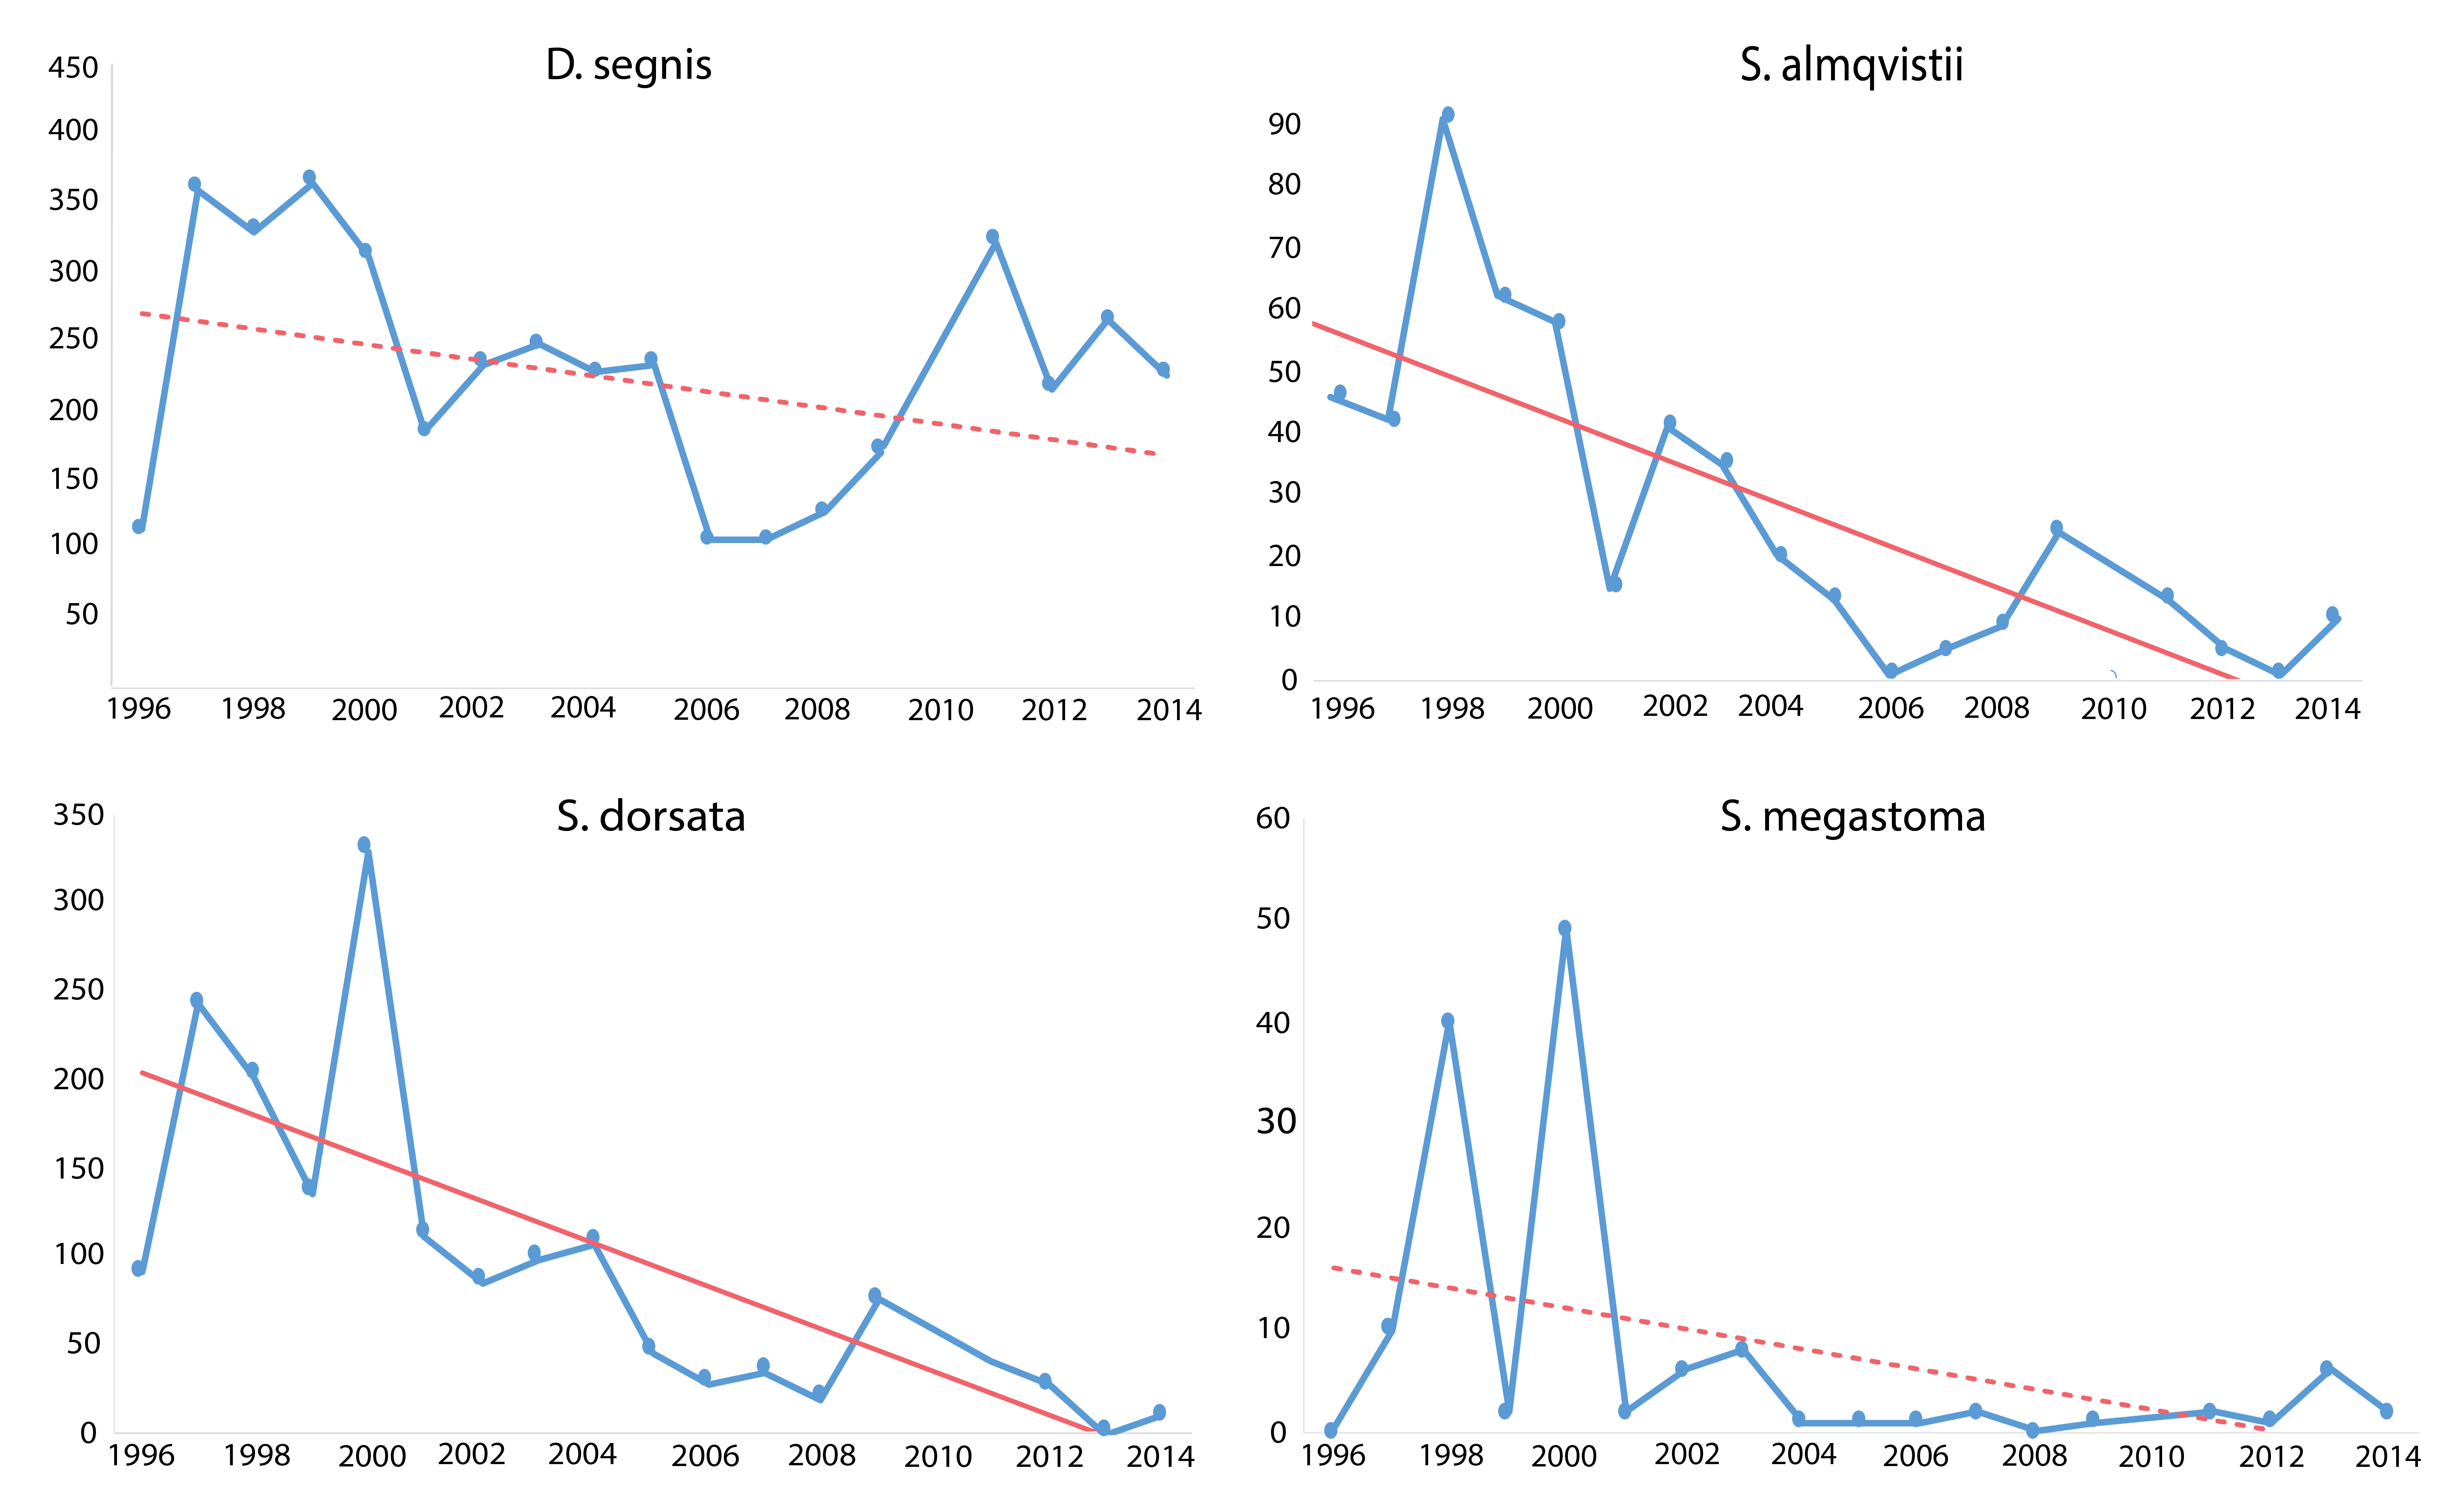
Trends in four muscid species occurring at Zackenberg Research Station, east Greenland, 1996–2014. Declines were detected in several species over five or more years. Significant regression lines drawn as solid. Non-significant as dotted lines. Modified from Gillespie et al. 2020a. (in the original figure six species showed a statistically significant decline, seven a non-significant decline and one species a non-significant rise) STATE OF THE ARCTIC TERRESTRIAL BIODIVERSITY REPORT - Chapter 3 - Page 39 - Figure 3.11
-
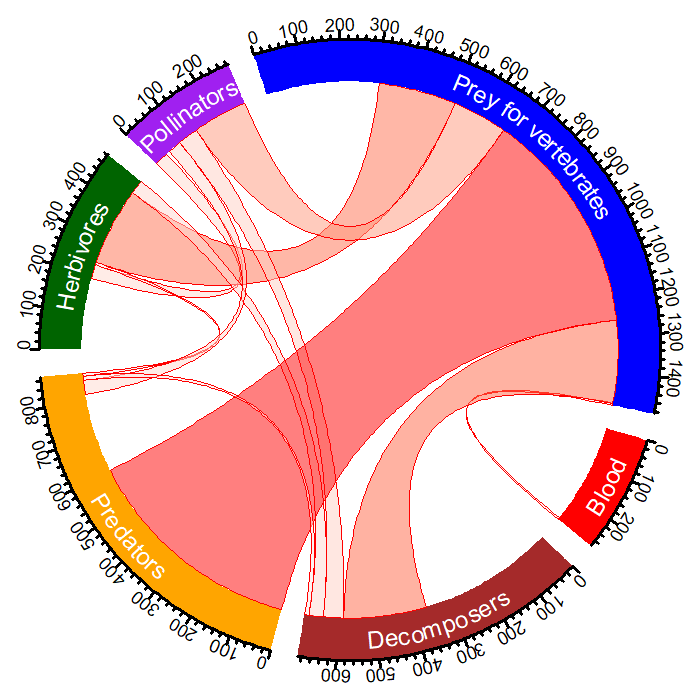
The diagram indicates the number of species in each FEC for the North Atlantic region of the Arctic (circular outline) and the overlap between the five CBMP–Terrestrial Plan FECs and the additional ‘predators’ FEC. The link width indicates the number of species linking two FECs. The larger the link the more species that are found in linking FECs. Modified from Gillespie et al. 2020a. STATE OF THE ARCTIC TERRESTRIAL BIODIVERSITY REPORT - Chapter 3 - Page 38 - Figure 3.8