 CAFF - Arctic Biodiversity Data Service (ABDS)
biota
Type of resources
Available actions
Topics
Keywords
Contact for the resource
Provided by
Years
Formats
Representation types
Update frequencies
status
-
This report attempts to review the abundance, status and distribution of natural wild goose populations in the northern hemisphere. The report comprises three parts that 1) summarise key findings from the study and the methodology and analysis applied; 2) contain the individual accounts for each of the 68 populations included in this report; and 3) provide the datasets compiled for this study which will be made accessible on the Arctic Biodiversity Data Service.
-

Trends and distribution of muskoxen populations based on Table 3-5. Modified from Cuyler et al. 2020. STATE OF THE ARCTIC TERRESTRIAL BIODIVERSITY REPORT - Chapter 3 - Page 79 - Figure 3.30
-
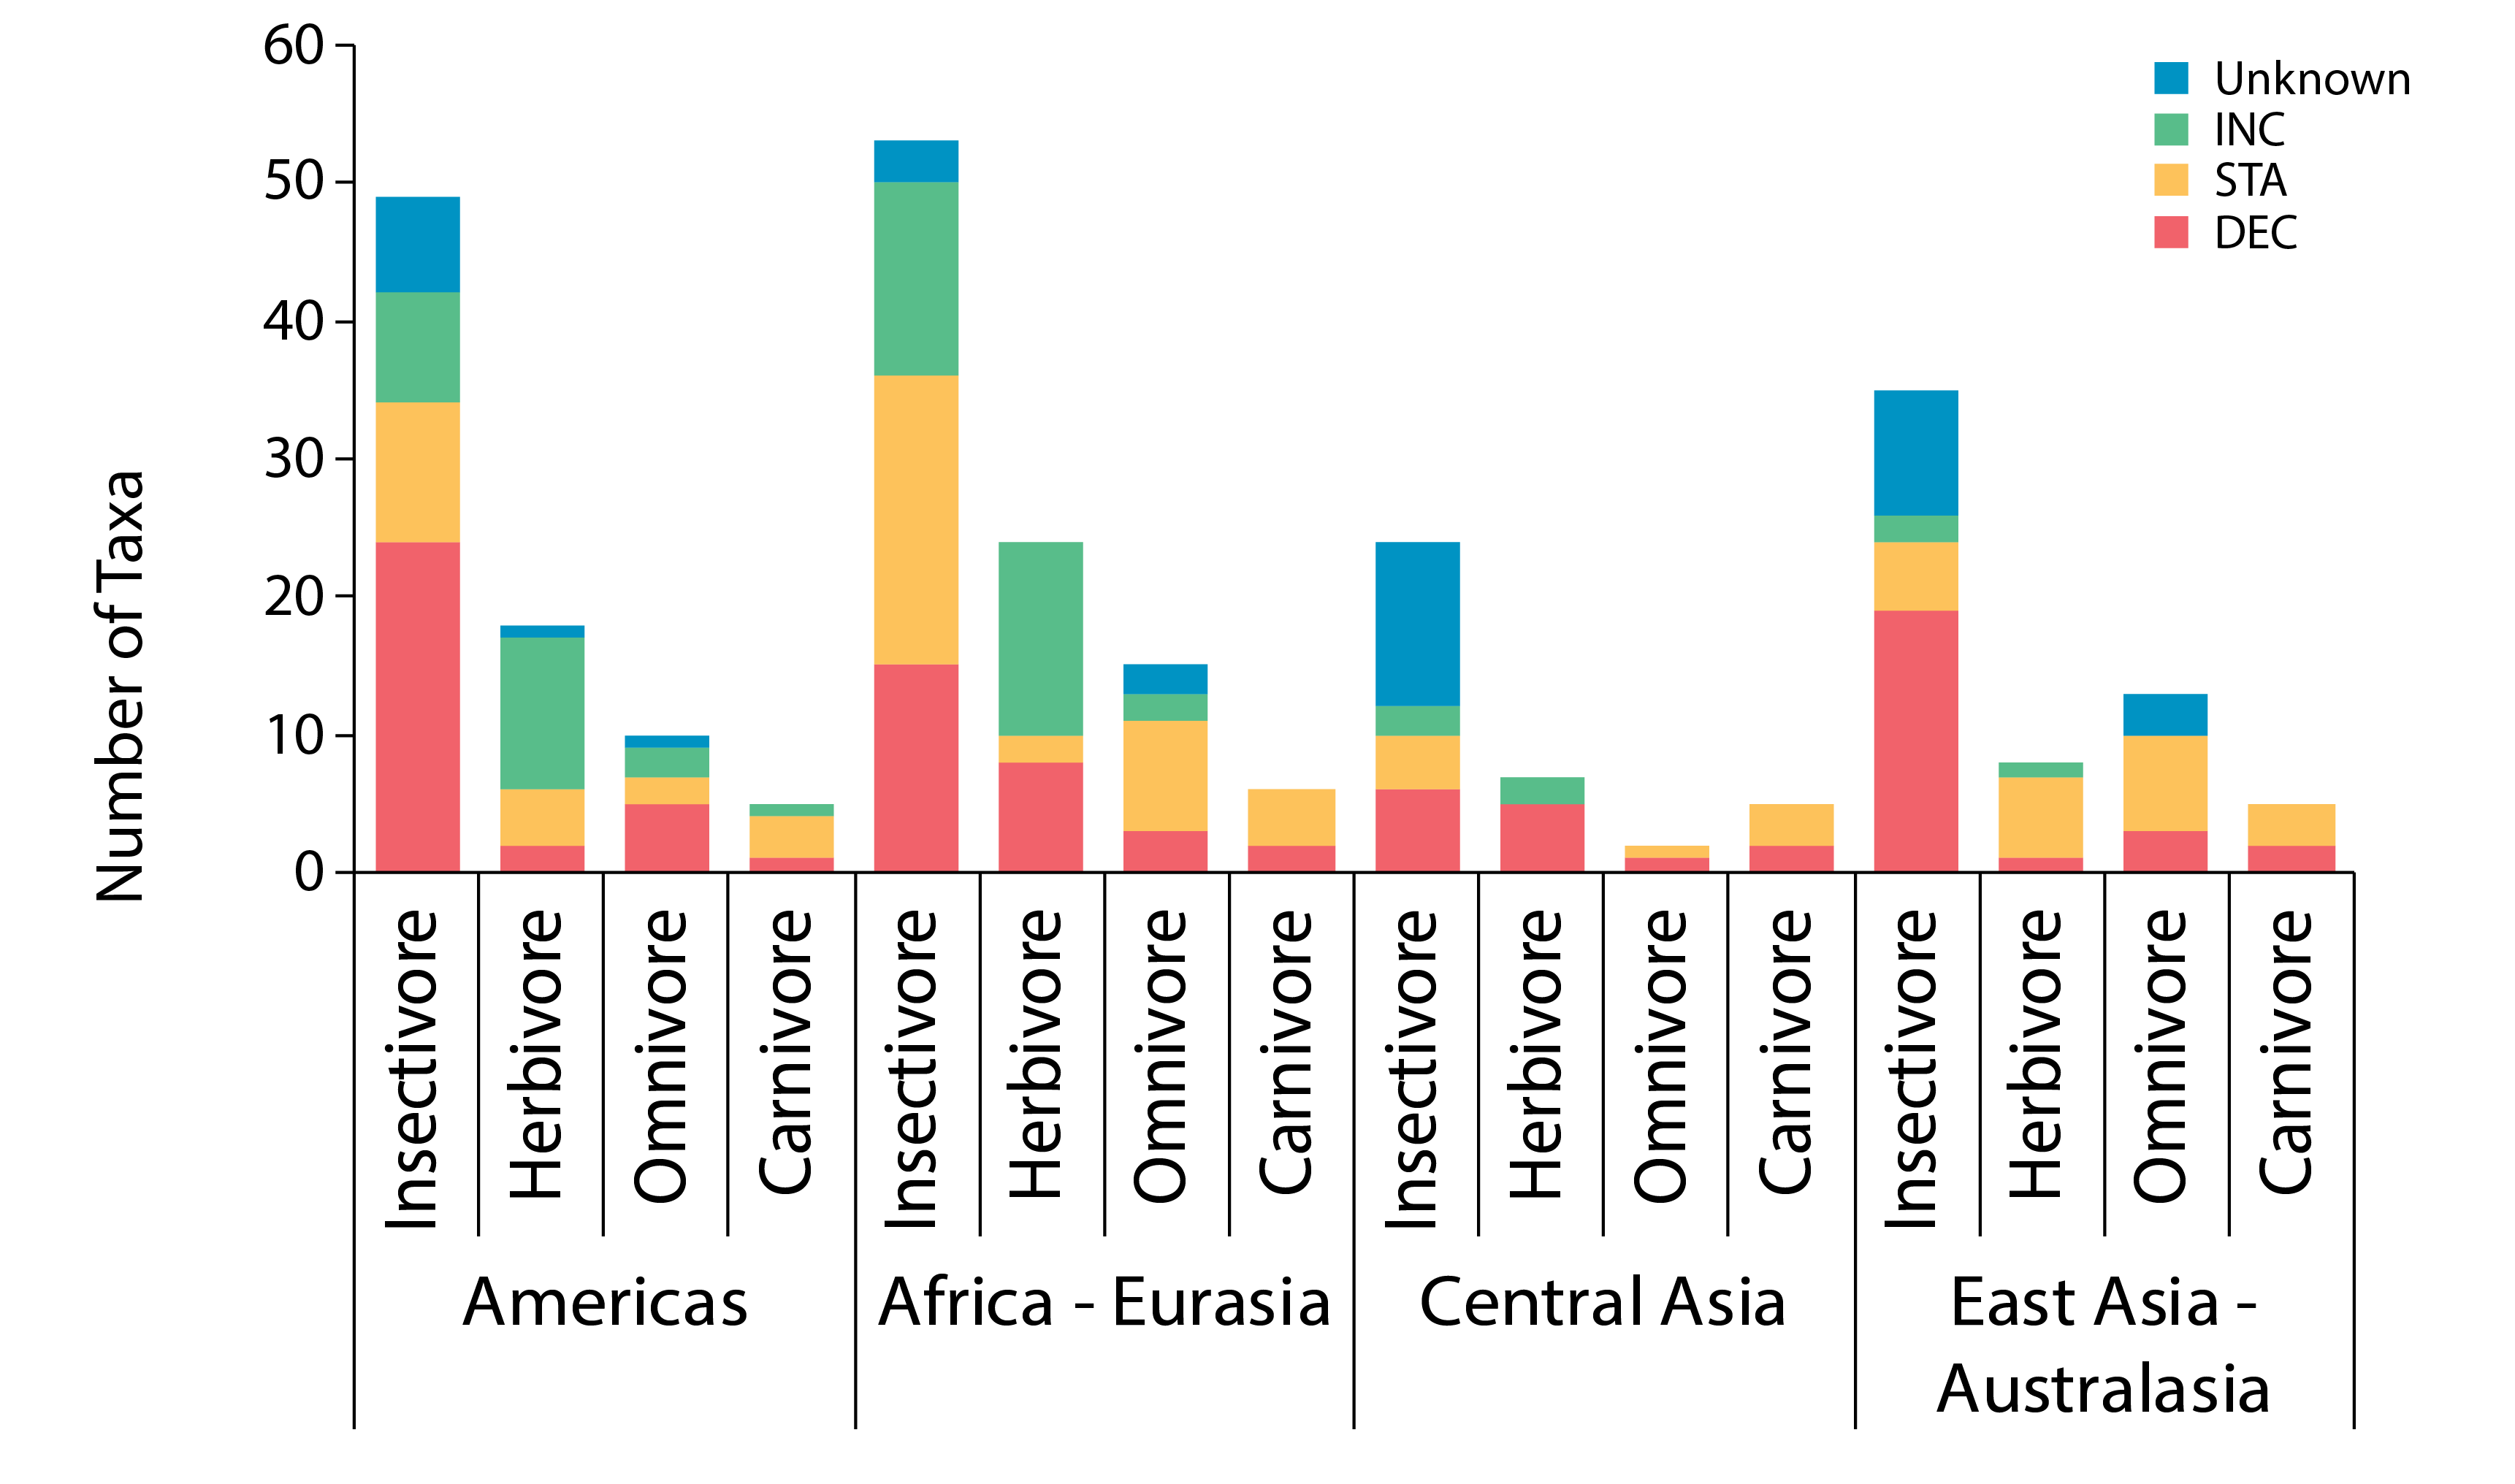
Regional differences are more pronounced in the insectivore guild (Figure 3-24). Although diversity of waders was moderate in the East Asian–Australasian Flyway, 88% (15 of 17) of taxa with known trends were declining—the largest proportion of any group. Both short-term (the last 15 years) and long-term (more than 30 years) trends were available for 157 taxa. Trends were unchanged over the two time periods for 80% of taxa, improved for 11% and worsened for 9%.. STATE OF THE ARCTIC TERRESTRIAL BIODIVERSITY REPORT - Chapter 3 - Page 56 - Figure 3.24
-
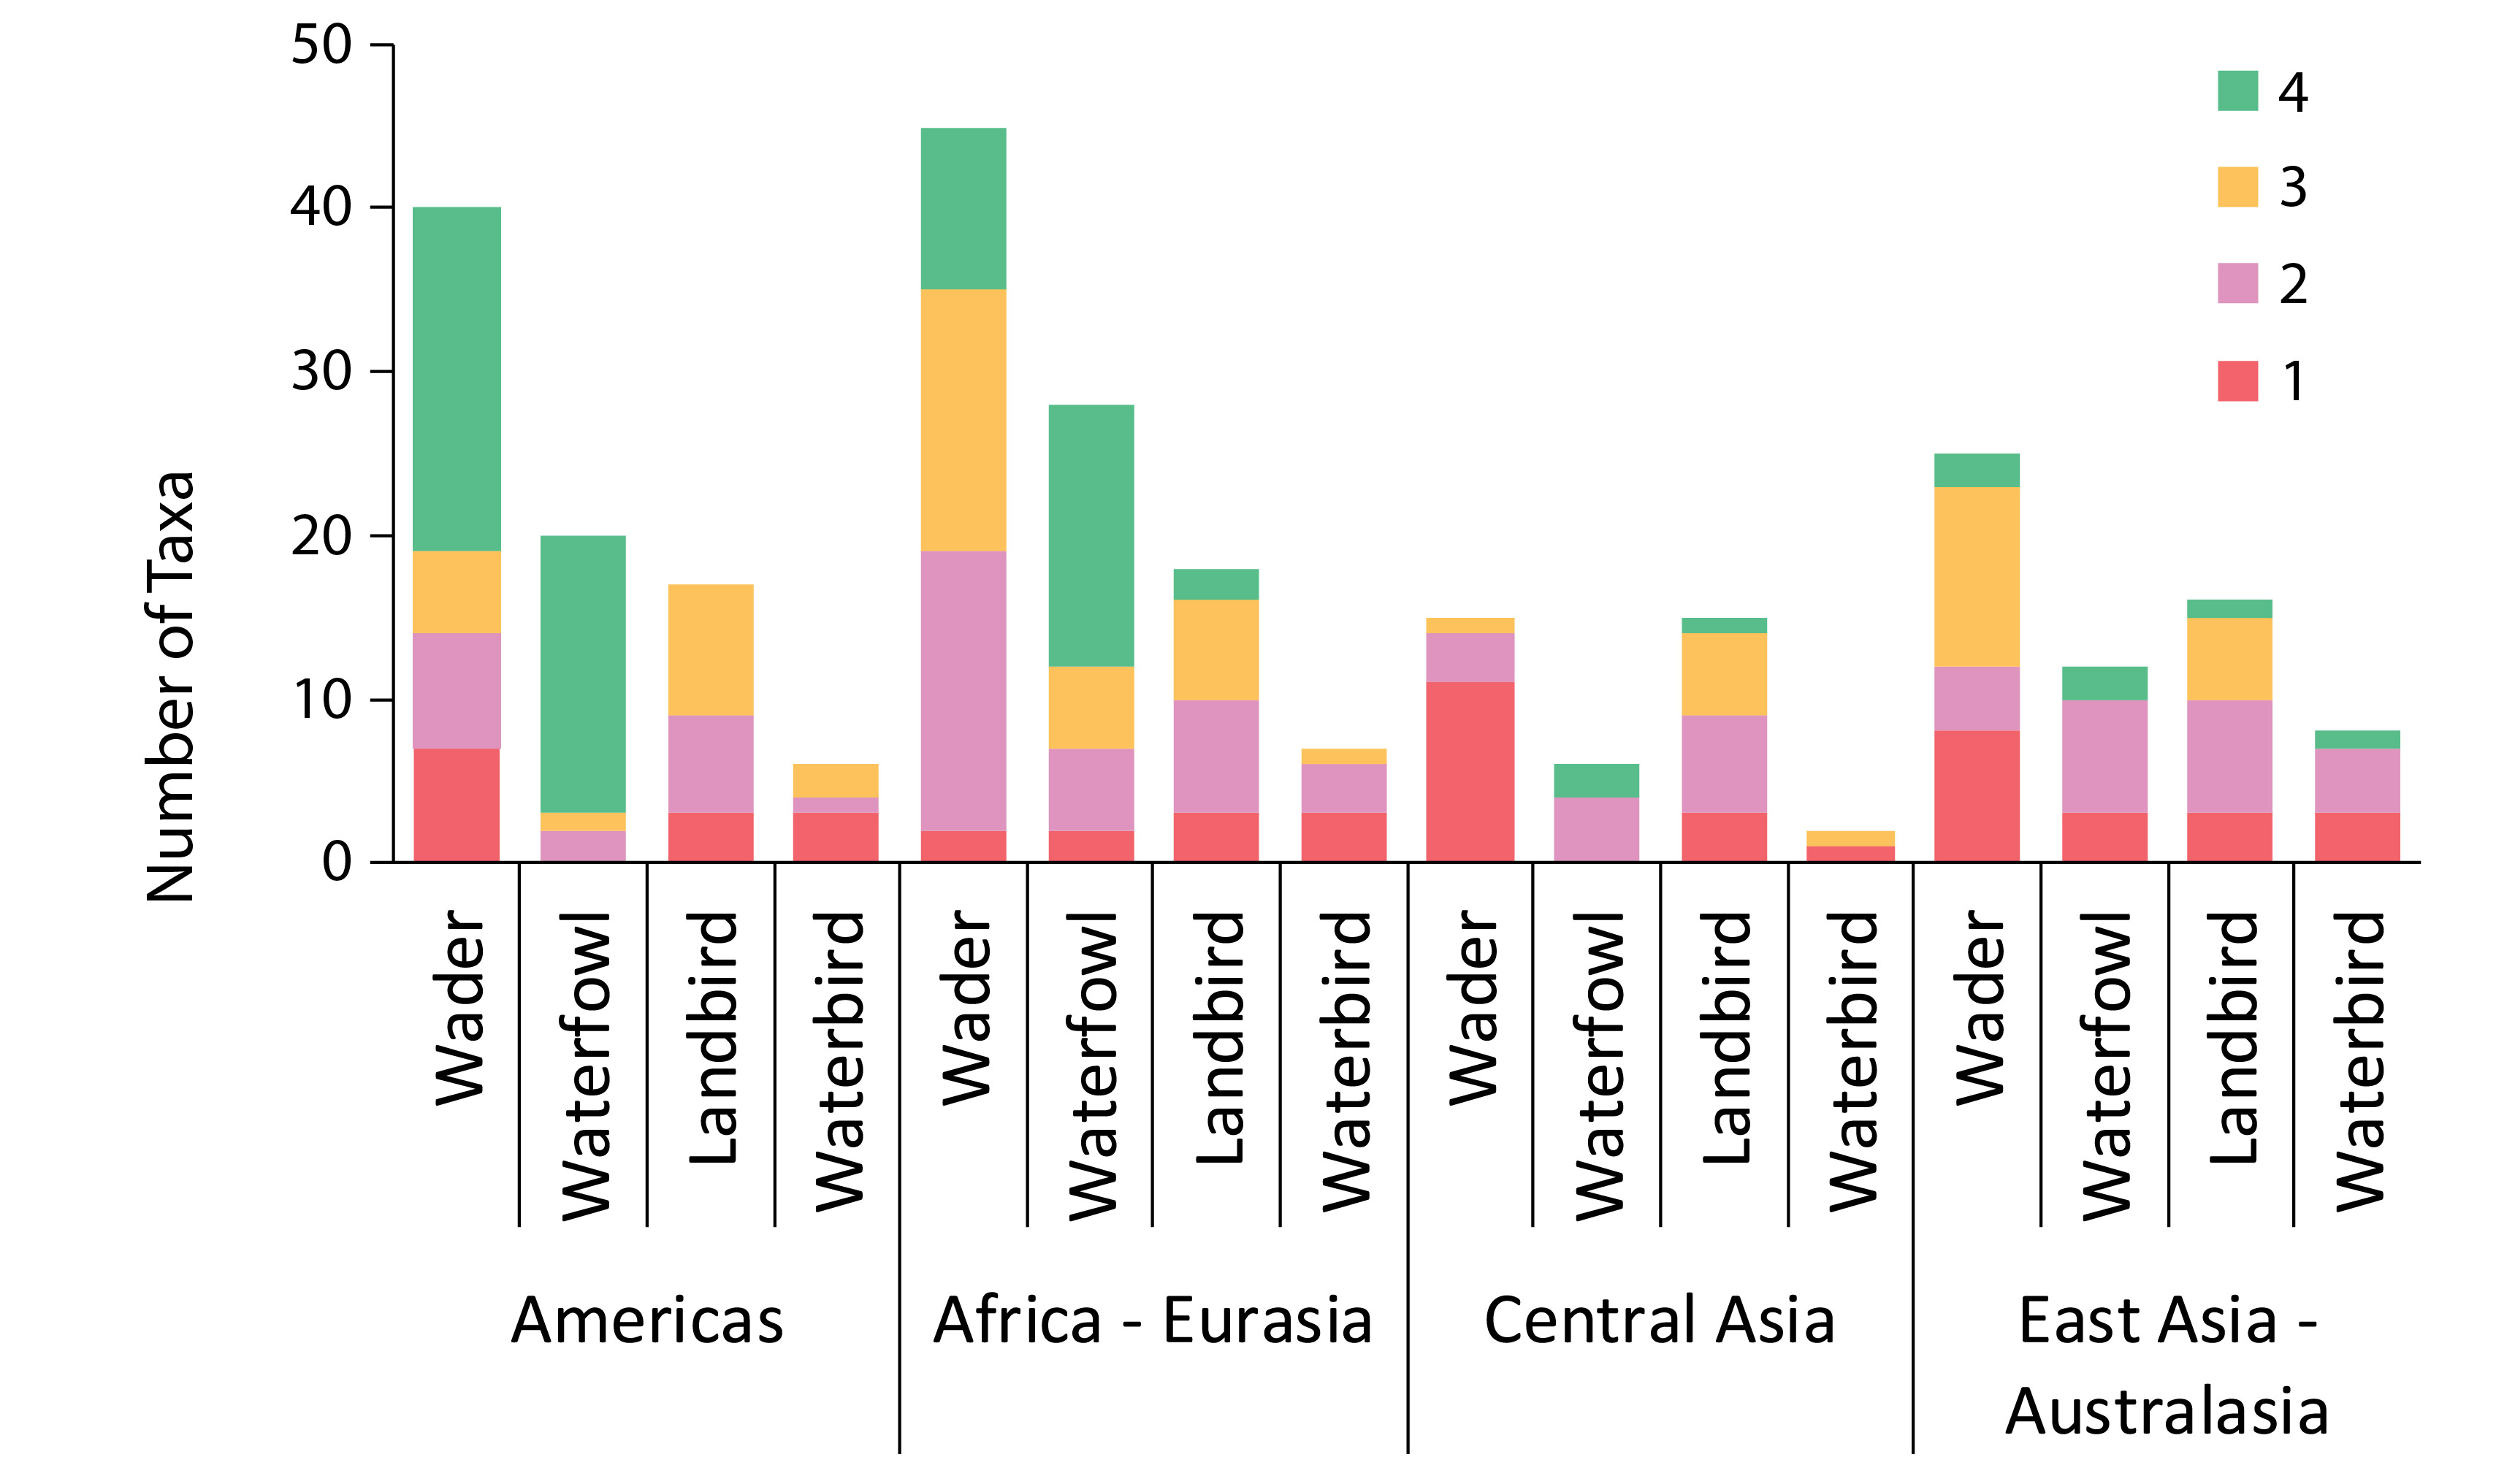
Trend quality categories are: (1) data are lacking such that trends are unknown, (2) regional and site-specific monitoring allow for assumptions of trend, (3) international monitoring allows estimation of trend direction, and (4) rigorously designed international monitoring programmes yield estimates of precision. Modified from Smith et al. 2020. STATE OF THE ARCTIC TERRESTRIAL BIODIVERSITY REPORT - Chapte31 - Page 59 - Figure 3.26
-
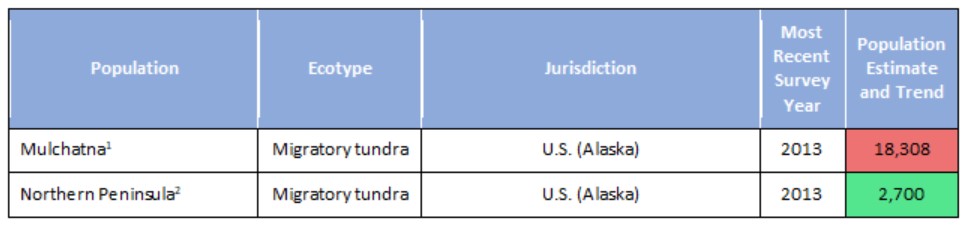
Population estimates and trends for Rangifer populations of the migratory tundra, Arctic island, mountain, and forest ecotypes where their circumpolar distribution intersects the CAFF boundary. Population trends (Increasing, Stable, Decreasing, or Unknown) are indicated by shading. Data sources for each population are indicated as footnotes. STATE OF THE ARCTIC TERRESTRIAL BIODIVERSITY REPORT - Chapter 3 - Page 70 - Table 3.4
-

Geographic area covered by the Arctic Biodiversity Assessment and the CBMP–Terrestrial Plan. Subzones A to E are depicted as defined in the Circumpolar Arctic Vegetation Map (CAVM Team 2003). Subzones A, B and C are the high Arctic while subzones D and E are the low Arctic. Definition of high Arctic, low Arctic, and sub-Arctic follow Hohn & Jaakkola 2010. STATE OF THE ARCTIC TERRESTRIAL BIODIVERSITY REPORT - Chapter 1 - Page 14 - Figure 1.2
-
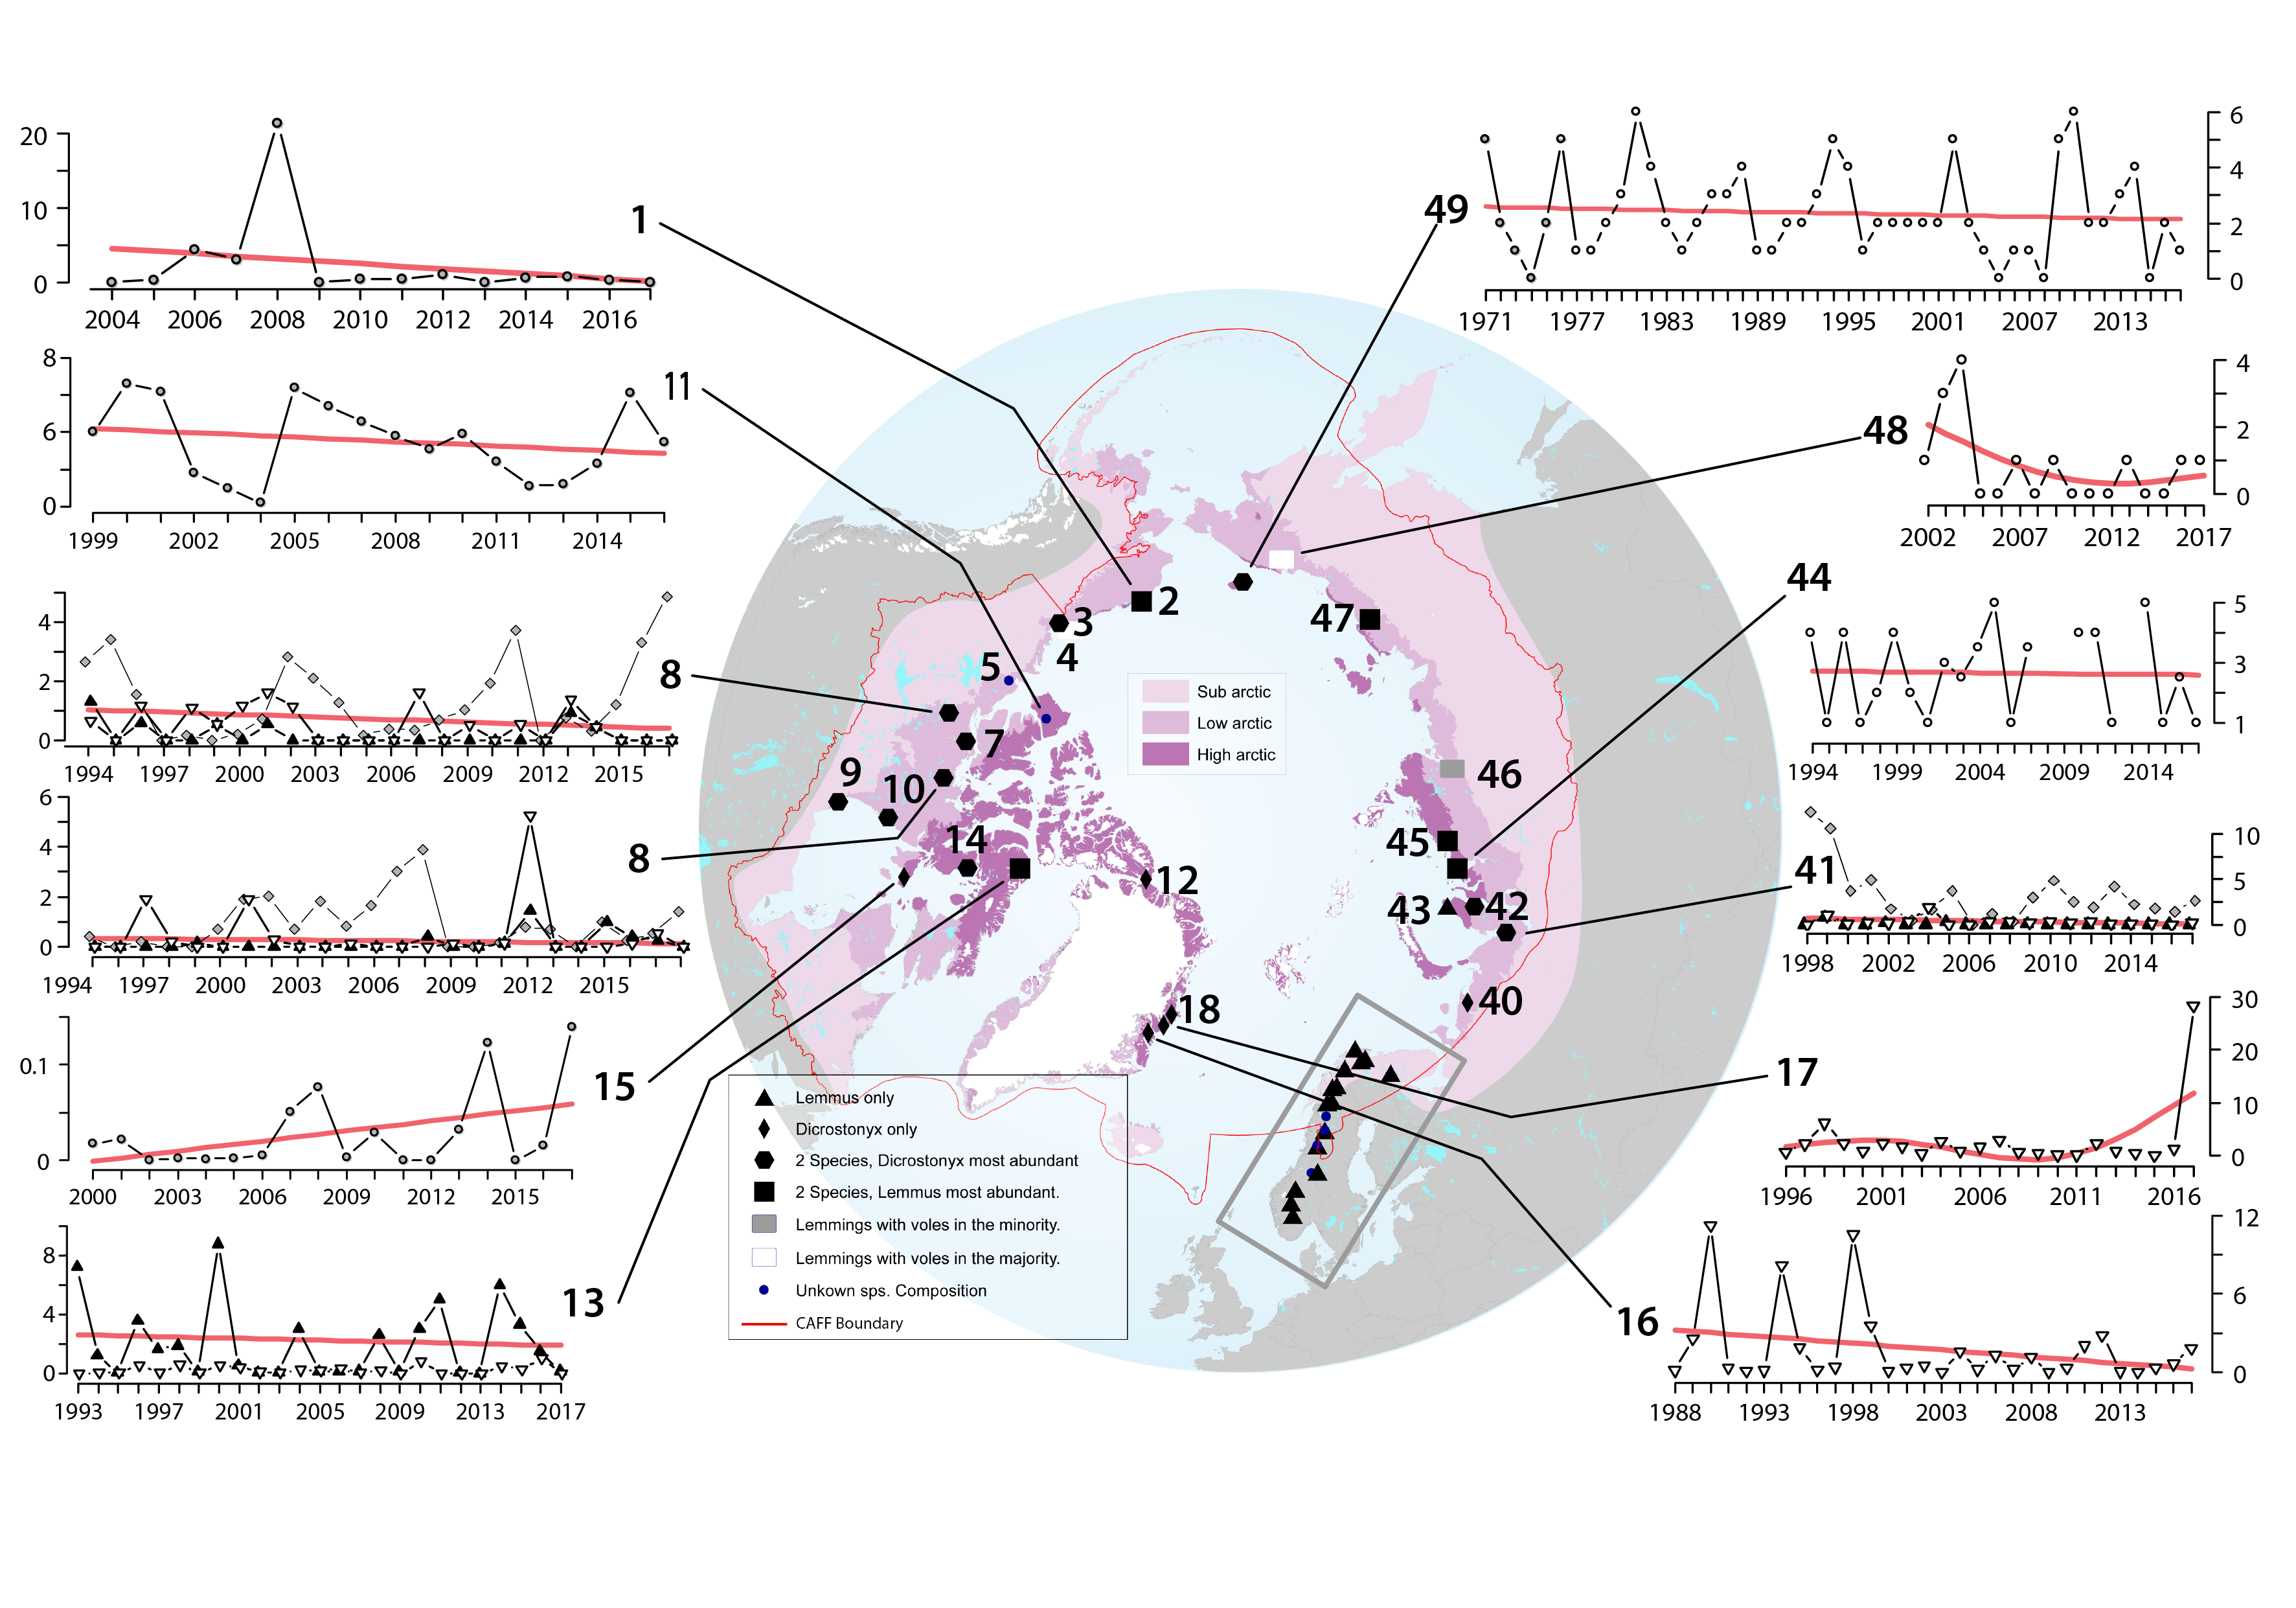
Lemmings are currently being monitored at 38 sites. Their status and trends were determined based on data from these sites as well as recent data (since 2000) from an additional 11 previous monitoring sites (Figure 3-31). Of those sites monitored, Fennoscandia is overrepresented relative to the geographical area it covers, whereas Russia is underrepresented. Based on the skewed geographical coverage, more information is available for some species of lemmings than others, particularly the Norwegian lemming. STATE OF THE ARCTIC TERRESTRIAL BIODIVERSITY REPORT - Chapter 3 - Page 80 - Figure 3.31
-

Change in plant phenology over time based on published studies, ranging from 9 to 21 years of duration. The bars show the proportion of observations where timing of phenological events advanced (earlier) was stable or were delayed (later) over time. The darker portions of each bar represent visible decrease, stable state, or increase results, and lighter portions represent marginally significant change. The numbers above each bar indicate the number of observations in that group. Figure from Bjorkman et al. 2020. STATE OF THE ARCTIC TERRESTRIAL BIODIVERSITY REPORT - Chapter 3 - Page 31- Figure 3.3
-
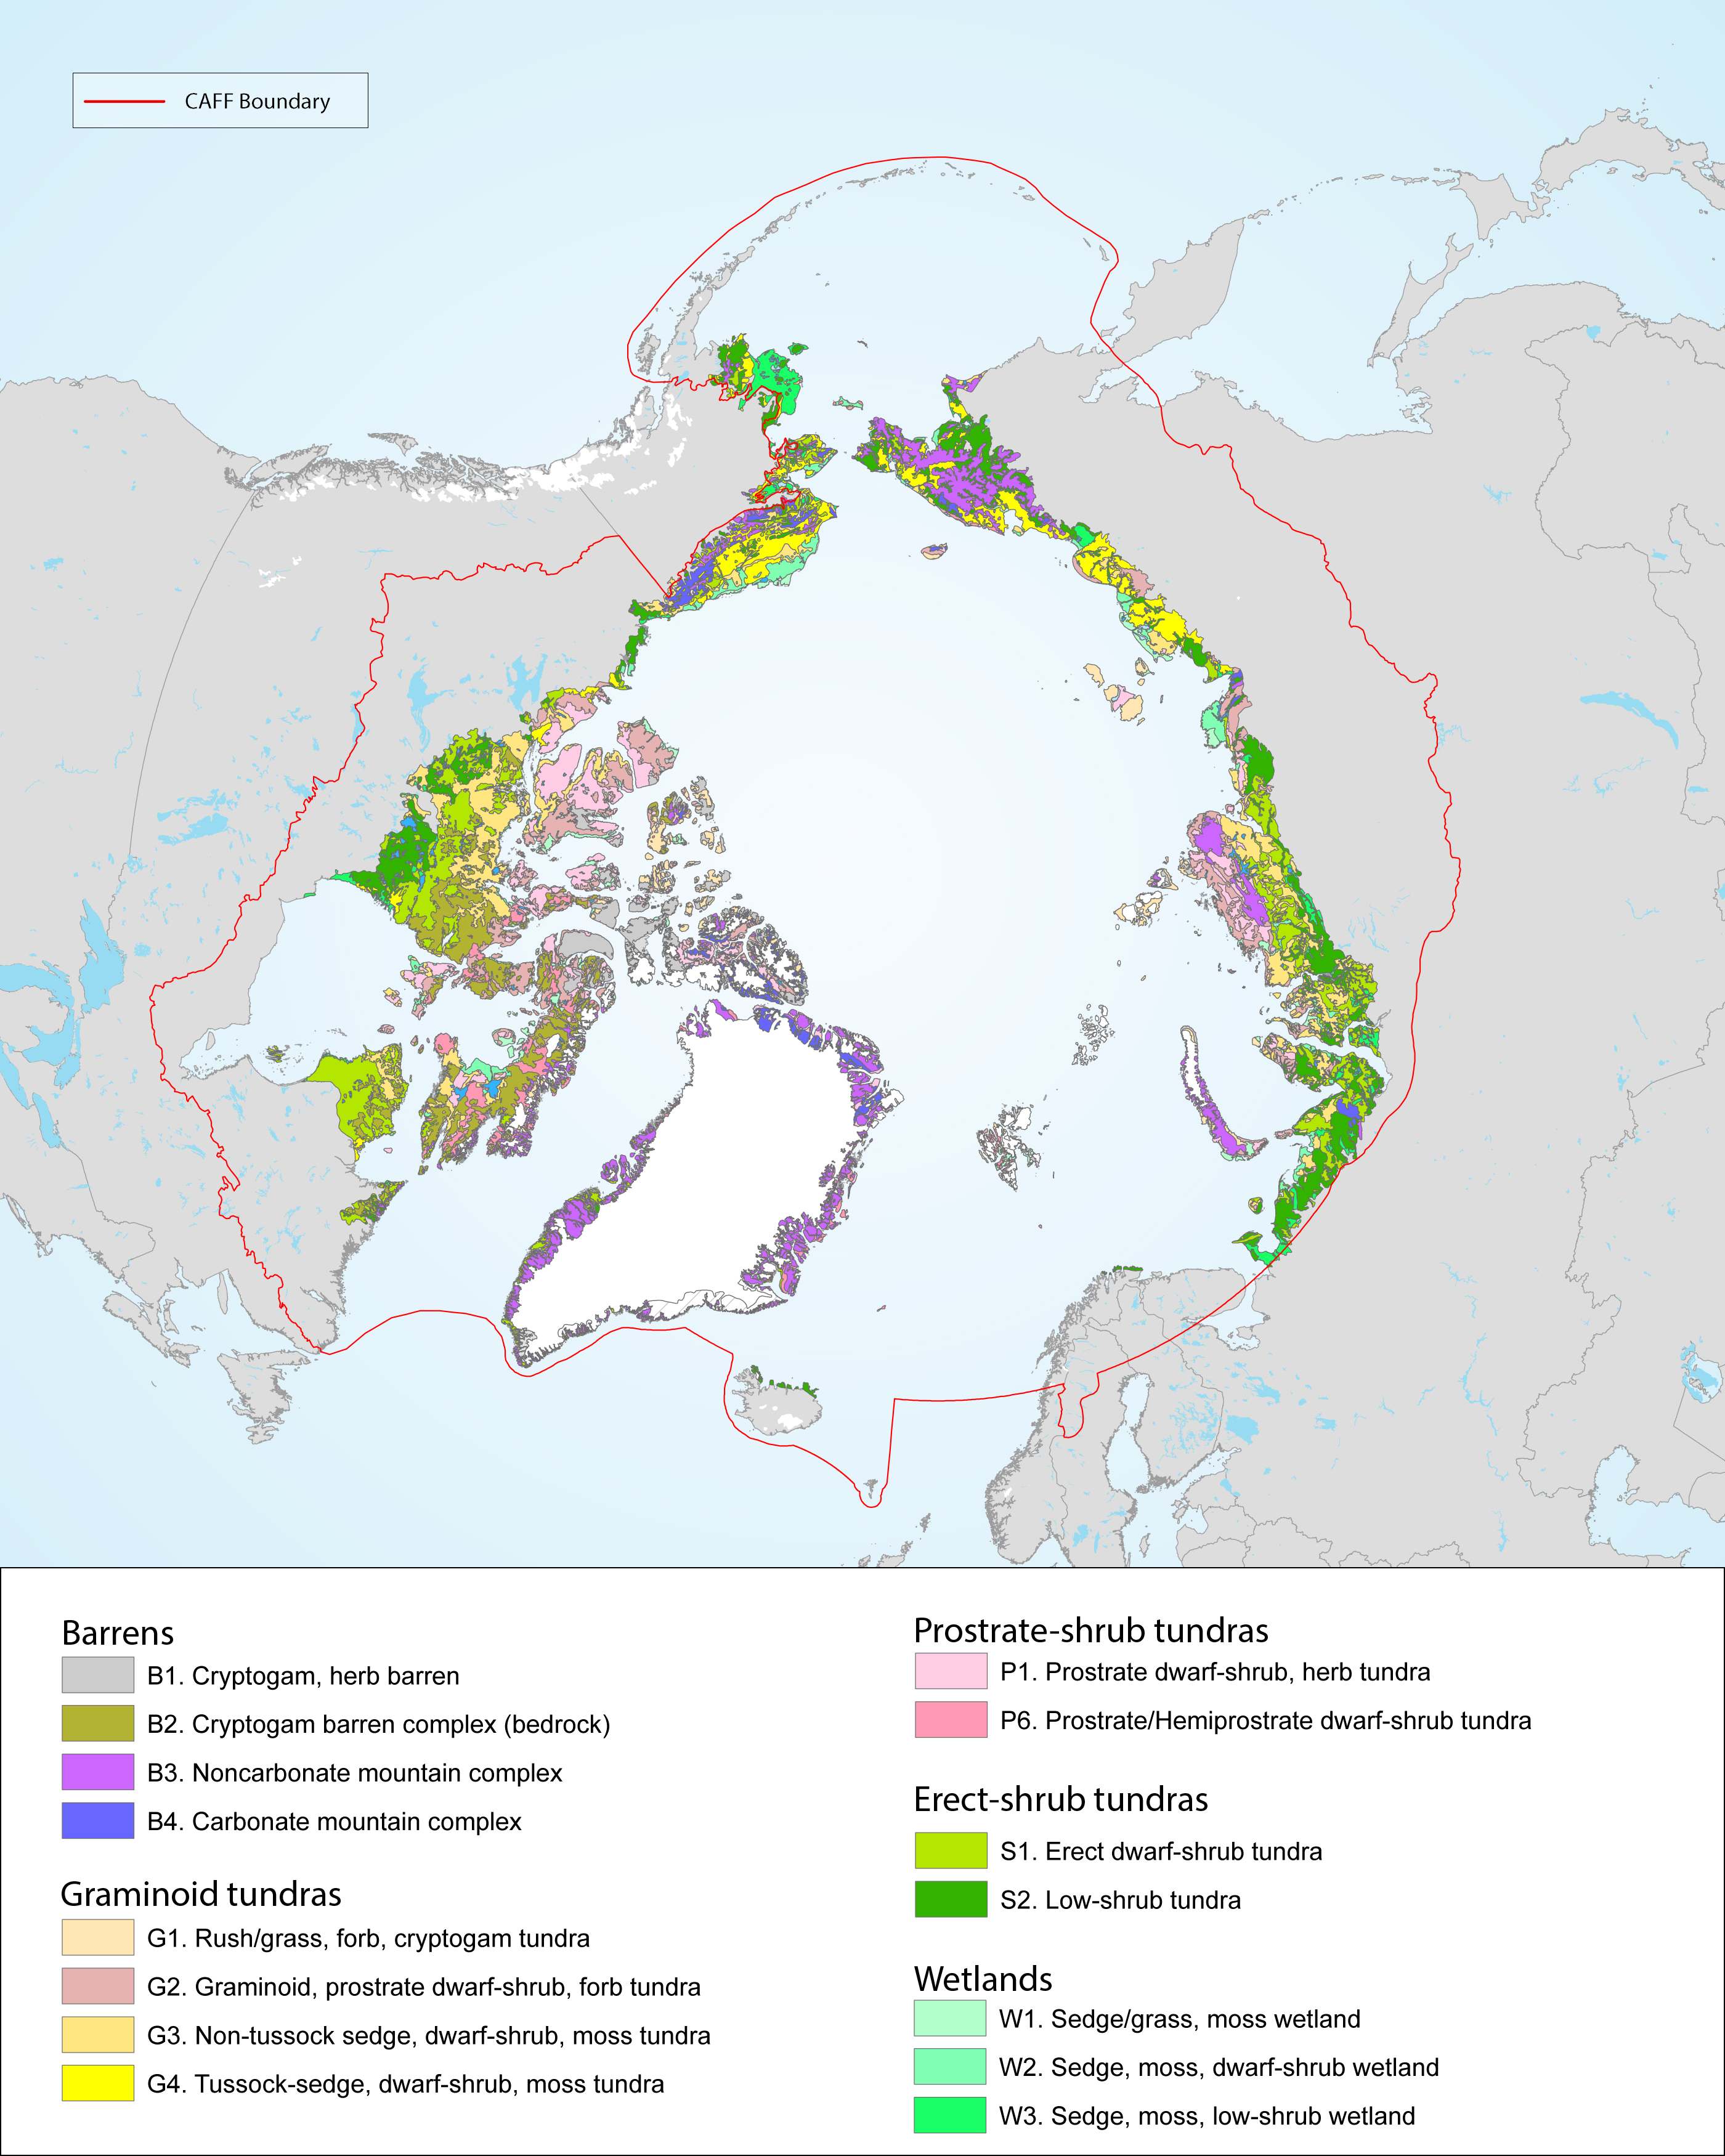
There is a great variation and heterogeneity among terrestrial Arctic ecosystems. This is further described as biogeographical areas in the Annotated Checklist of the Pan-Arctic Flora (Elven et al. 2020), as vegetation zones (Walker et al. 2005, Raynolds et al 2019) or as ecoregions recognised by Terrestrial Ecoregions of the World (Olson et al. 2001). The START focuses on high and low Arctic regions consistent with the CAVM’s subzones A to E, as shown in Figure 1-2 and Figure 2-1 STATE OF THE ARCTIC TERRESTRIAL BIODIVERSITY REPORT - Chapter 2 - Page 19 - Figure 2.1
-
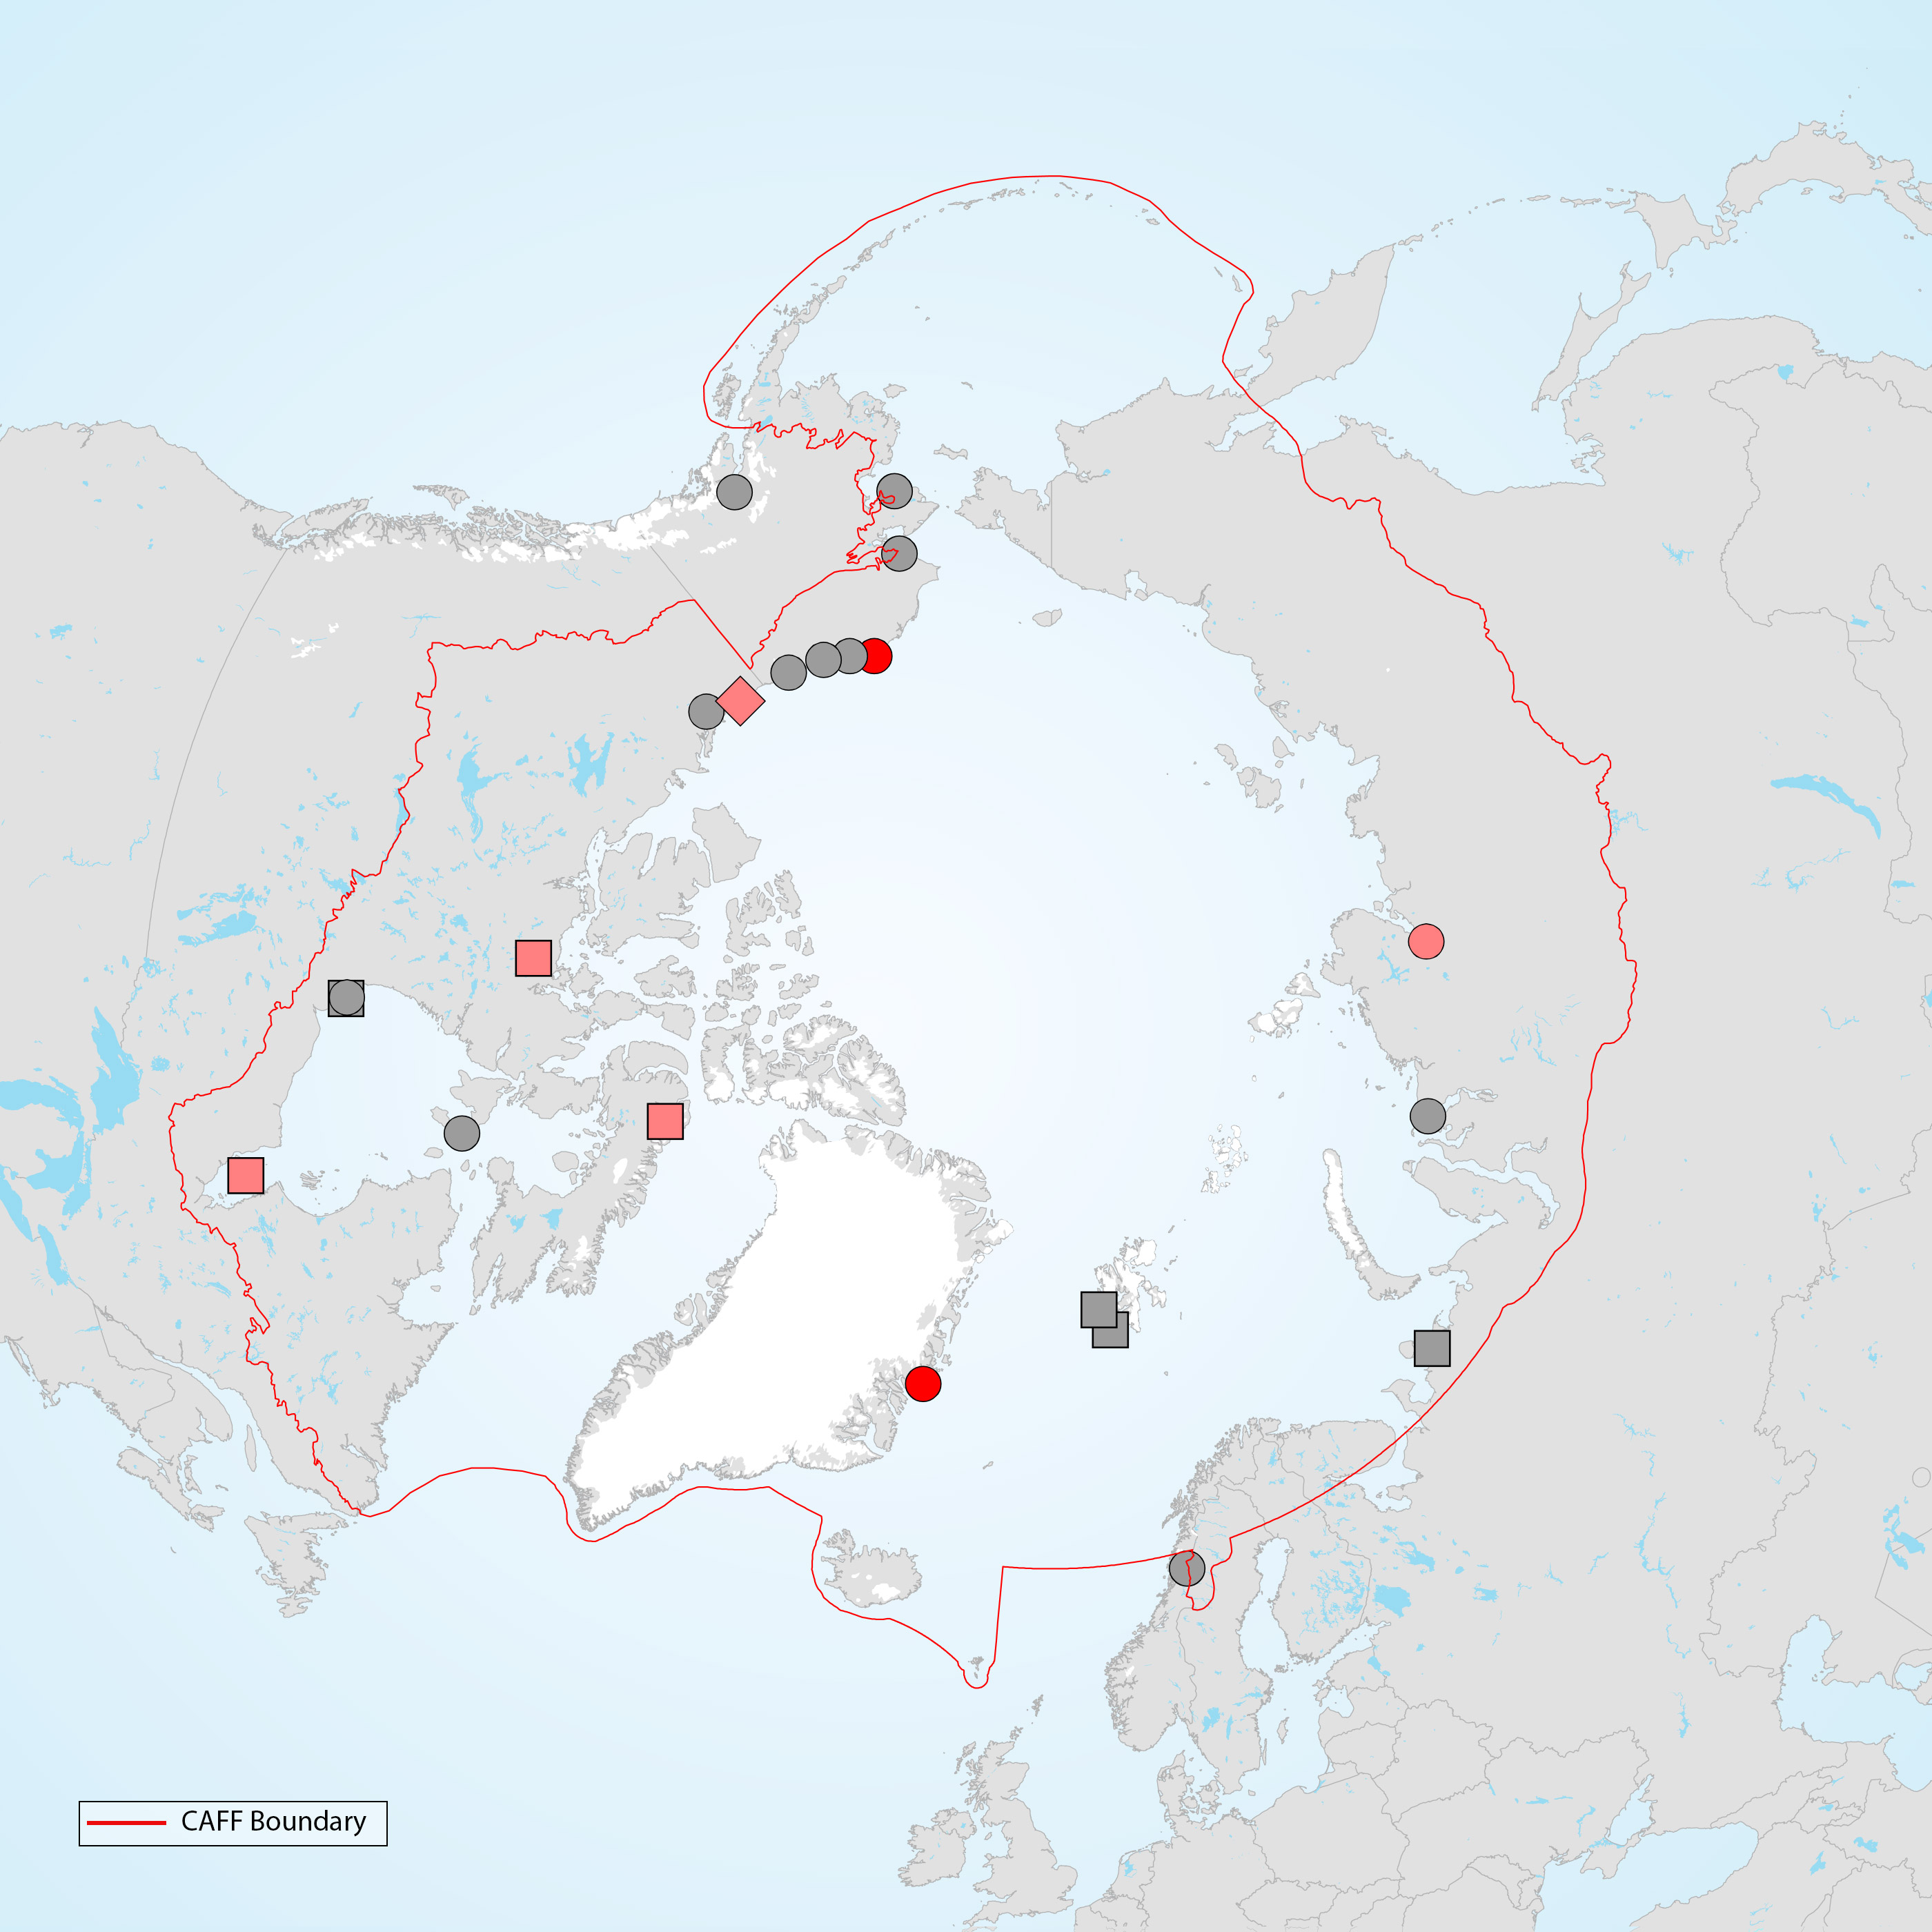
Study sites across the Arctic where phenological mismatches between timing of reproduction and peak abundance in food have been studied for terrestrial bird species. Grey symbols show study sites where this phenomenon has been studied for <10 years, light red symbols show sites with >10 years of data but no strong evidence of an increasing mismatch, and dark red symbols indicate sites with >10 years of data and strong evidence of an increasing mismatch. Circles indicate studies of shorebirds, squares for waterfowl and diamonds(triancle) for both shorebirds and passerines. Graphic: Thomas Lameris, adapted from Zhemchuzhnikov (submitted). STATE OF THE ARCTIC TERRESTRIAL BIODIVERSITY REPORT - Chapter 3 - Page 65 - Figure Box 3.3