 CAFF - Arctic Biodiversity Data Service (ABDS)
CAFF
Type of resources
Available actions
Topics
Keywords
Contact for the resource
Provided by
Years
Formats
Representation types
Update frequencies
status
Scale
-
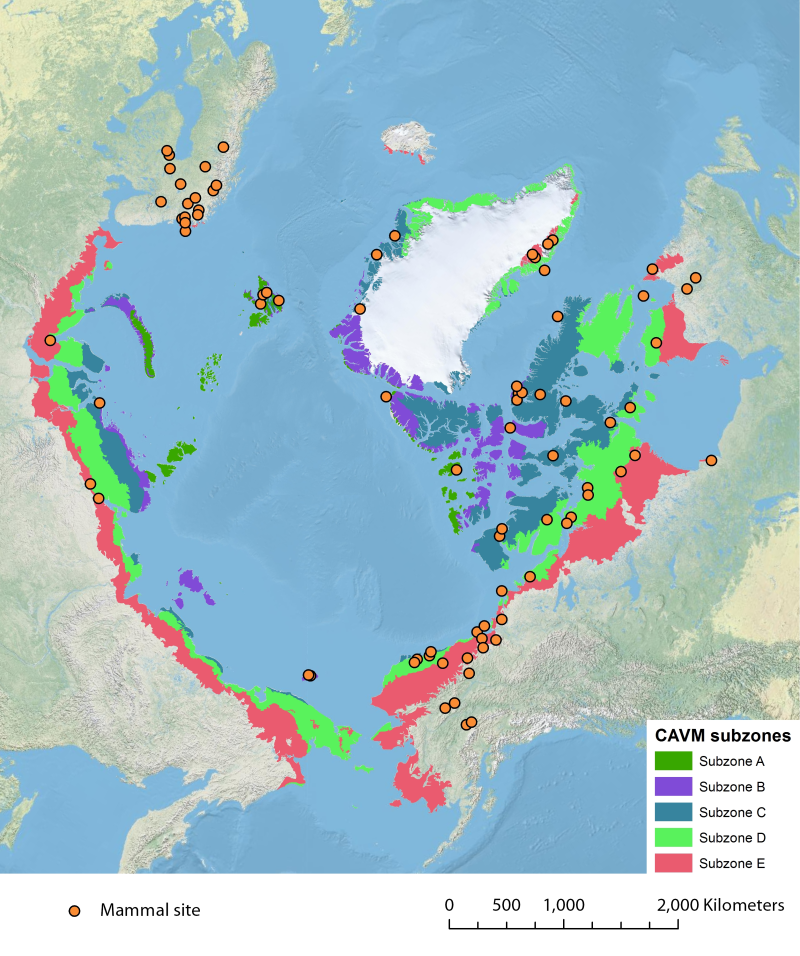
Location of long-term mammal monitoring sites and programs. Comes from the Arctic Terrestrial Biodiversity Monitoring Plan is developed to improve the collective ability of Arctic traditional knowledge holders, northern communities and scientists to detect, understand and report on long-term change in Arctic terrestrial ecosystems and biodiversity..
-
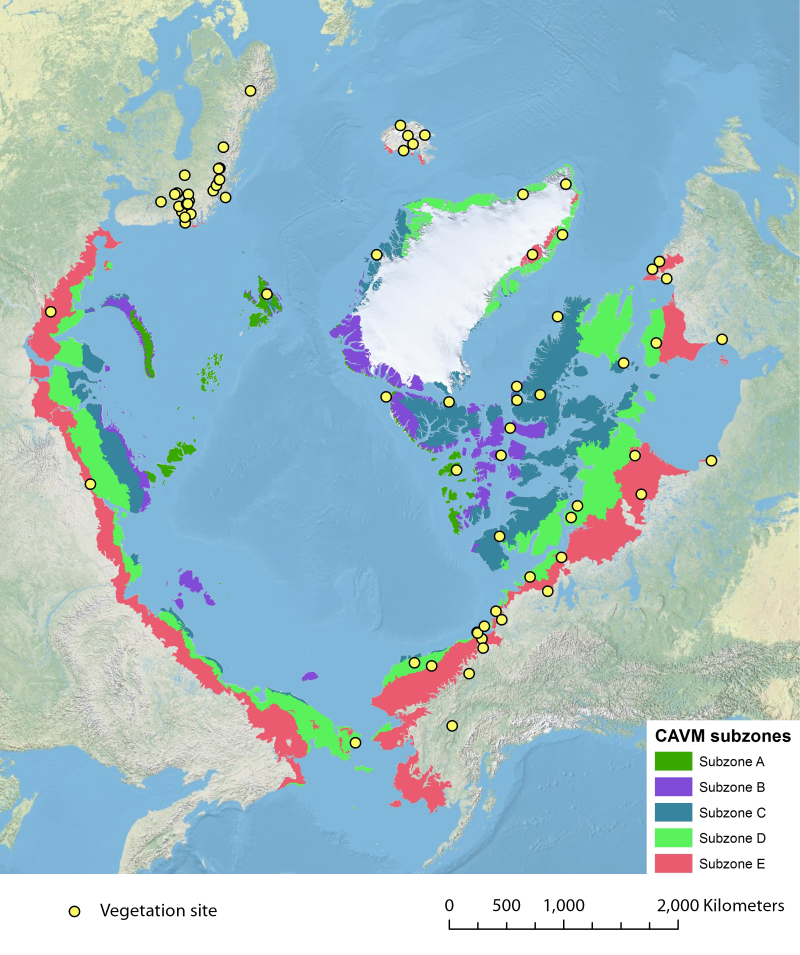
Location of long-term vegetation (including fungi, non-vascular and vascular plants) monitoring sites and programs. Comes from the Arctic Terrestrial Biodiversity Monitoring Plan is developed to improve the collective ability of Arctic traditional knowledge holders, northern communities and scientists to detect, understand and report on long-term change in Arctic terrestrial ecosystems and biodiversity. The report can be seen here http://www.caff.is/publications/view_document/256-arctic-terrestrial-biodiversity-monitoring-plan The monitoring locations are place over the Circumpolar Arctic bioclimate subzones (CAVM Team 2003) http://www.caff.is/flora-cfg/circumpolar-arctic-vegetation-map
-
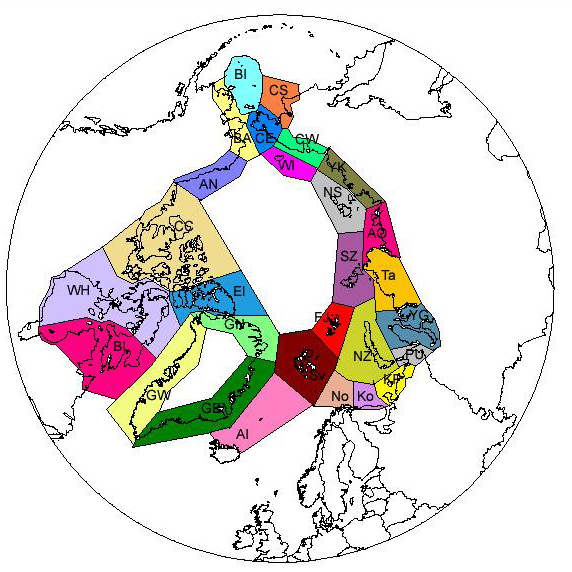
Subdivision of the Arctic into 28 sectors follows mainly the division used in the Pan Arctic Flora (PAF) project. In a few cases some islands are separated from their mainland in the beginning, thus representing very small sectors. Some of them have now been united like in the PAF project, for example Jan Mayen with Arctic Iceland and Bear Island with Svalbard. Others, like the Beringian Islands are still kept separate from the mainland on both sides. - <a href="http://www.caff.is/assessment-series/32-pan-arctic-checklist-of-lichens-and-lichenicolous-fungi" target="_blank"> Pan-Arctic Checklist of Lichens and Lichenicolous Fungi (2011)</a>
-
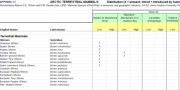
Appendix 3.1 Arctic Terrestrial mammals: Distribution (X = present; Introd = Introduced by humans) by broad geographic region and low or high arctic zones Nomenclature follows D.E. Wilson and D.M. Reeder (eds.) 2005. Mammal Species of the World: a taxonomic and geographic reference. 3rd Ed. Johns Hopkins University Press, Baltimore.
-
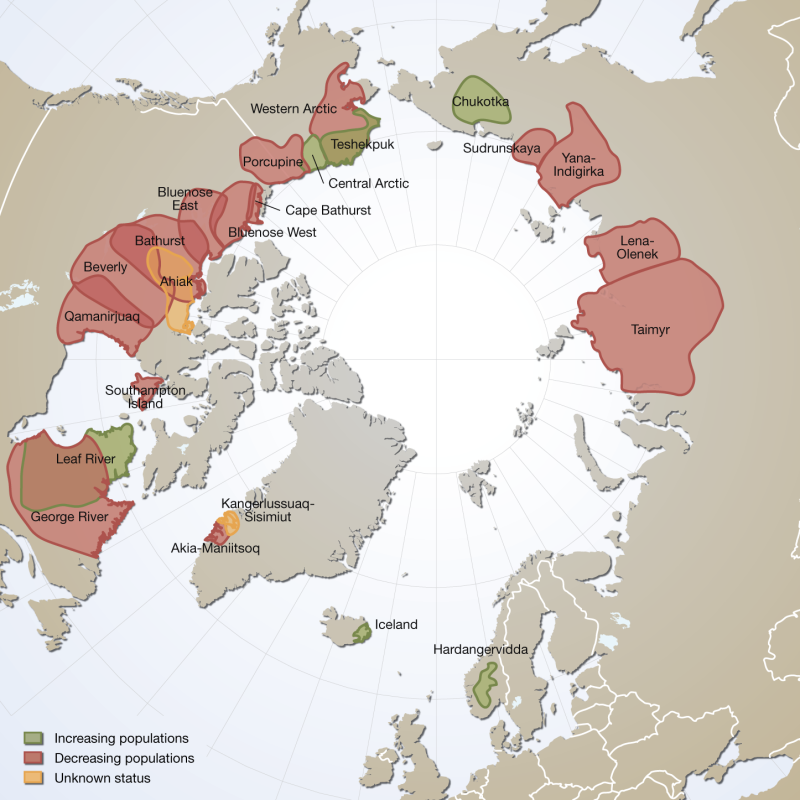
Distribution and observed trends of wild Rangifer populations throughout the circumpolar Arctic (from The Circum Arctic Rangifer Monitoring and Assessment Network, CARMA). Note: Wild boreal forest reindeer have not been mapped by CARMA and thus are not represented here. Published in the Arctic Biodiversity Trends 2010 - Selected indicators of change, INDICATOR #02 - released in 2010
-
The Arctic Terrestrial Biodiversity Monitoring Plan is developed to improve the collective ability of Arctic traditional knowledge holders, northern communities and scientists to detect, understand and report on long-term change in Arctic terrestrial ecosystems and biodiversity.
-
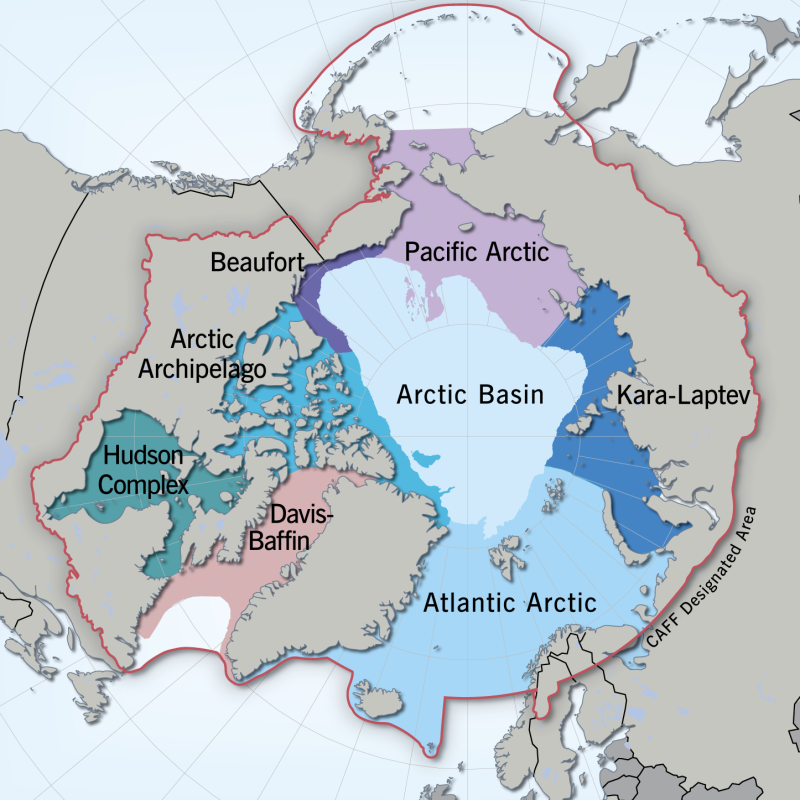
Regional divisions of the marine Arctic, as determined by the Marine Expert Monitoring Group of the Circumpolar Biodiversity Monitoring Programme (CBMP). The Circumpolar Marine Biodiversity Monitoring plan identifies eight Arctic Marine Areas where a suite of common parameters, sampling approaches and indicators will be used. Regionally specific parameters may also be applied. Exact boundaries may change over time to reflect changing bio-physical conditions. <a href="http://caff.is/marine/marine-monitoring-publications/3-arctic-marine-biodiversity-monitoring-plan" target="_blank"> Published in the Arctic Marine Biodiversity Monitoring Plan, Chapter 2, page20 - released in 2011 </a>
-
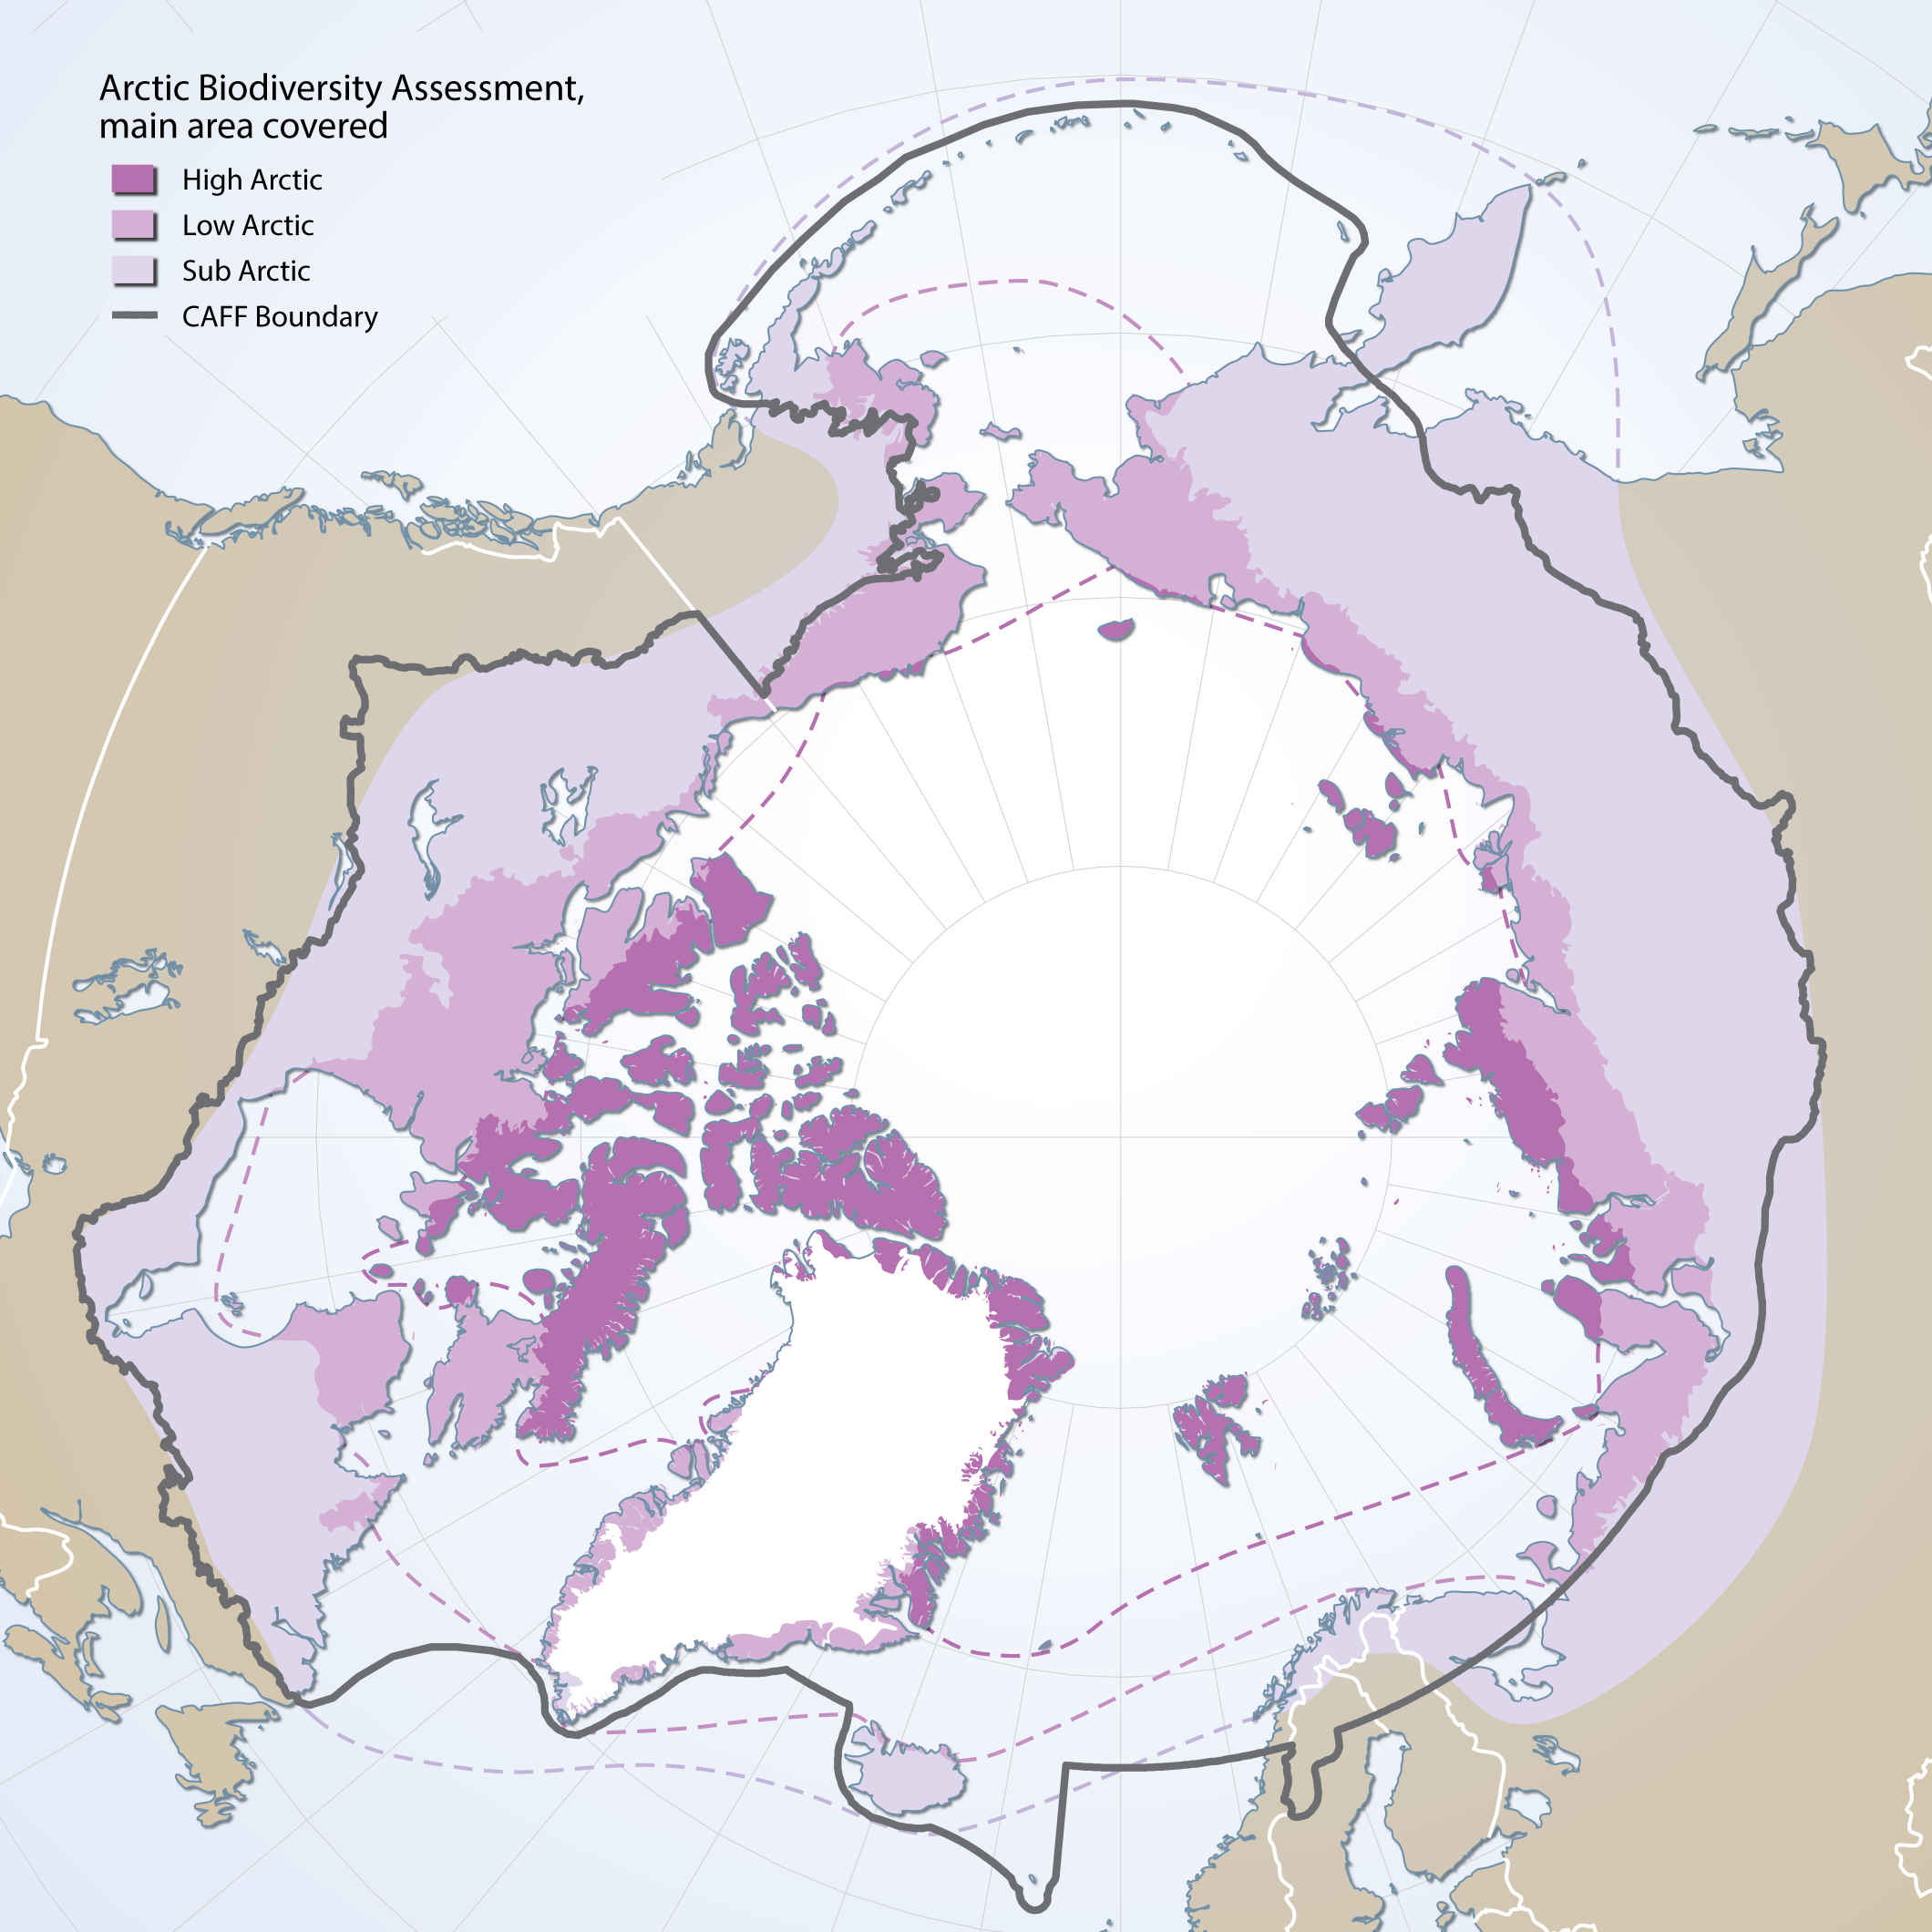
Boundaries of the geographic area covered by the Arctic Biodiversity Assessment. Includes sub, low and high Arctic bounbaries
-
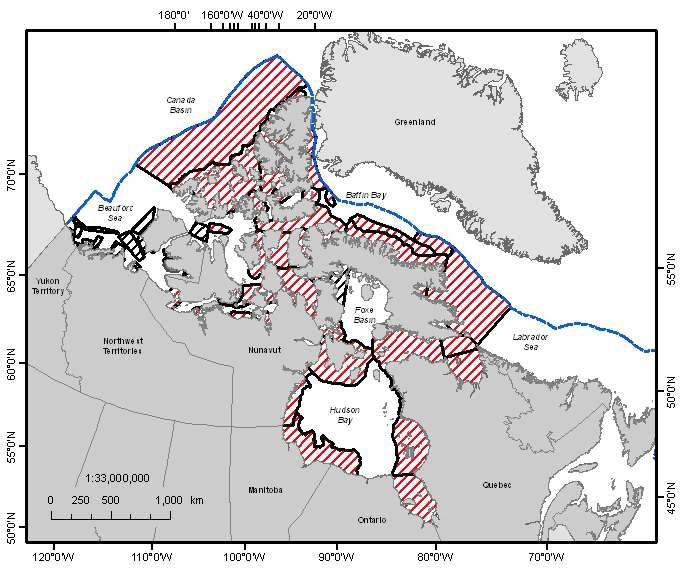
A national Canadian Science Advisory Secretariat (CSAS) science advisory process was held in Winnipeg, Manitoba from June 14-17, 2011 to provide science advice on the identification of Ecologically and Biologically Significant Areas (EBSAs) in the Canadian Arctic based on guidance developed by Fisheries and Oceans Canada. This science advisory process focused on the identification of EBSAs within the following marine biogeographic units: the Hudson Bay Complex, the Arctic Basin, the Western Arctic, the Canadian Arctic Archipelago and the Eastern Arctic. Source: <a href="http://www.dfo-mpo.gc.ca/Library/344747.pdf" target="_blank">Fisheries and Oceans Canada</a> Reference: DFO. 2011. Identification of Ecologically and Biologically Significant Areas (EBSA) in the Canadian Arctic. DFO Can. Sci. Advis. Sec. Sci. Advis. Rep. 2011/055. DFO. 2011. Identification of Ecologically and Biologically Significant Areas (EBSAs) in the Canadian Arctic; June 14-17, 2011. DFO Can. Sci. Advis. Sec. Proceed. Ser. 2011/047.
-
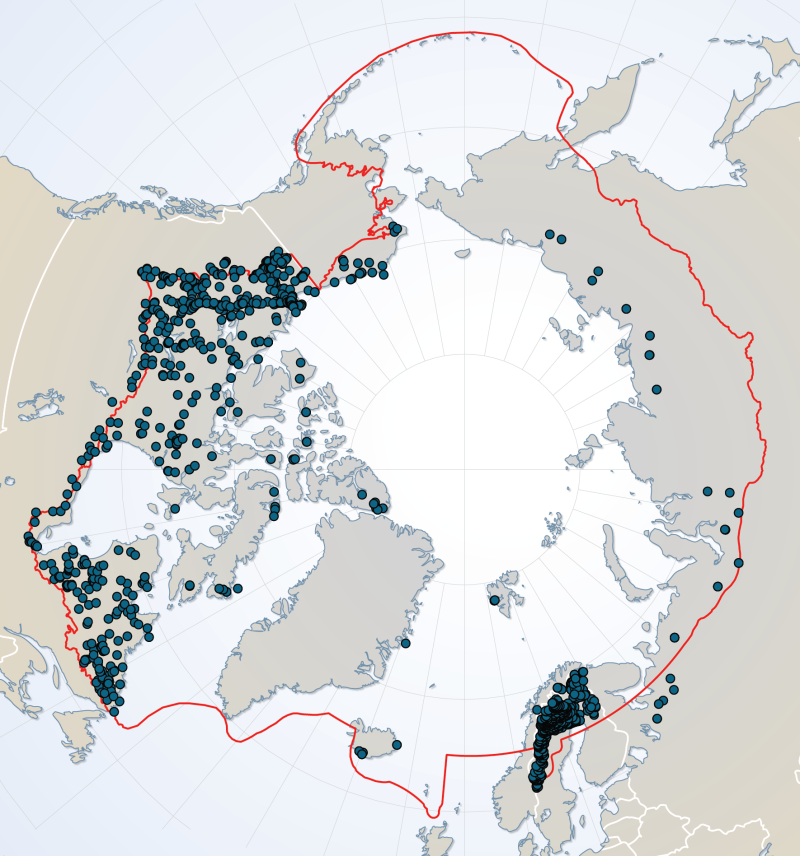
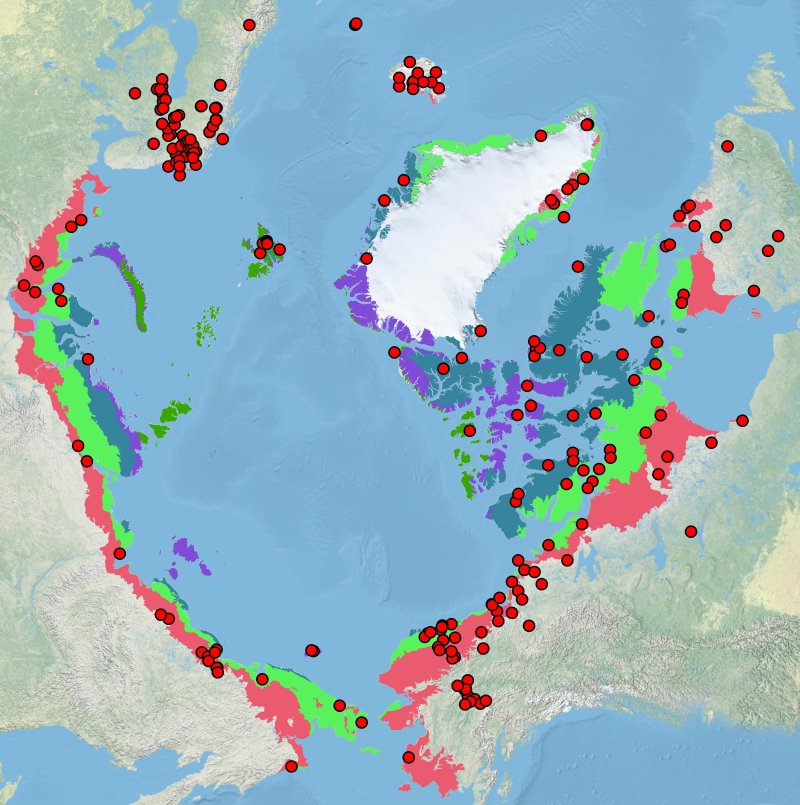
River dataset showing location of study sites in rivers for the Arctic Freshwater Biodiversity Monitoring Plan. Published in the Arctic Freshwater Monitoring Plan Brochure released in 2013 http://www.caff.is/monitoring-series/view_document/277-arctic-freshwater-biodiversity-monitoring-plan-brochure