 CAFF - Arctic Biodiversity Data Service (ABDS)
unknown
Type of resources
Available actions
Topics
Keywords
Contact for the resource
Provided by
Years
Formats
Representation types
Update frequencies
status
Scale
-
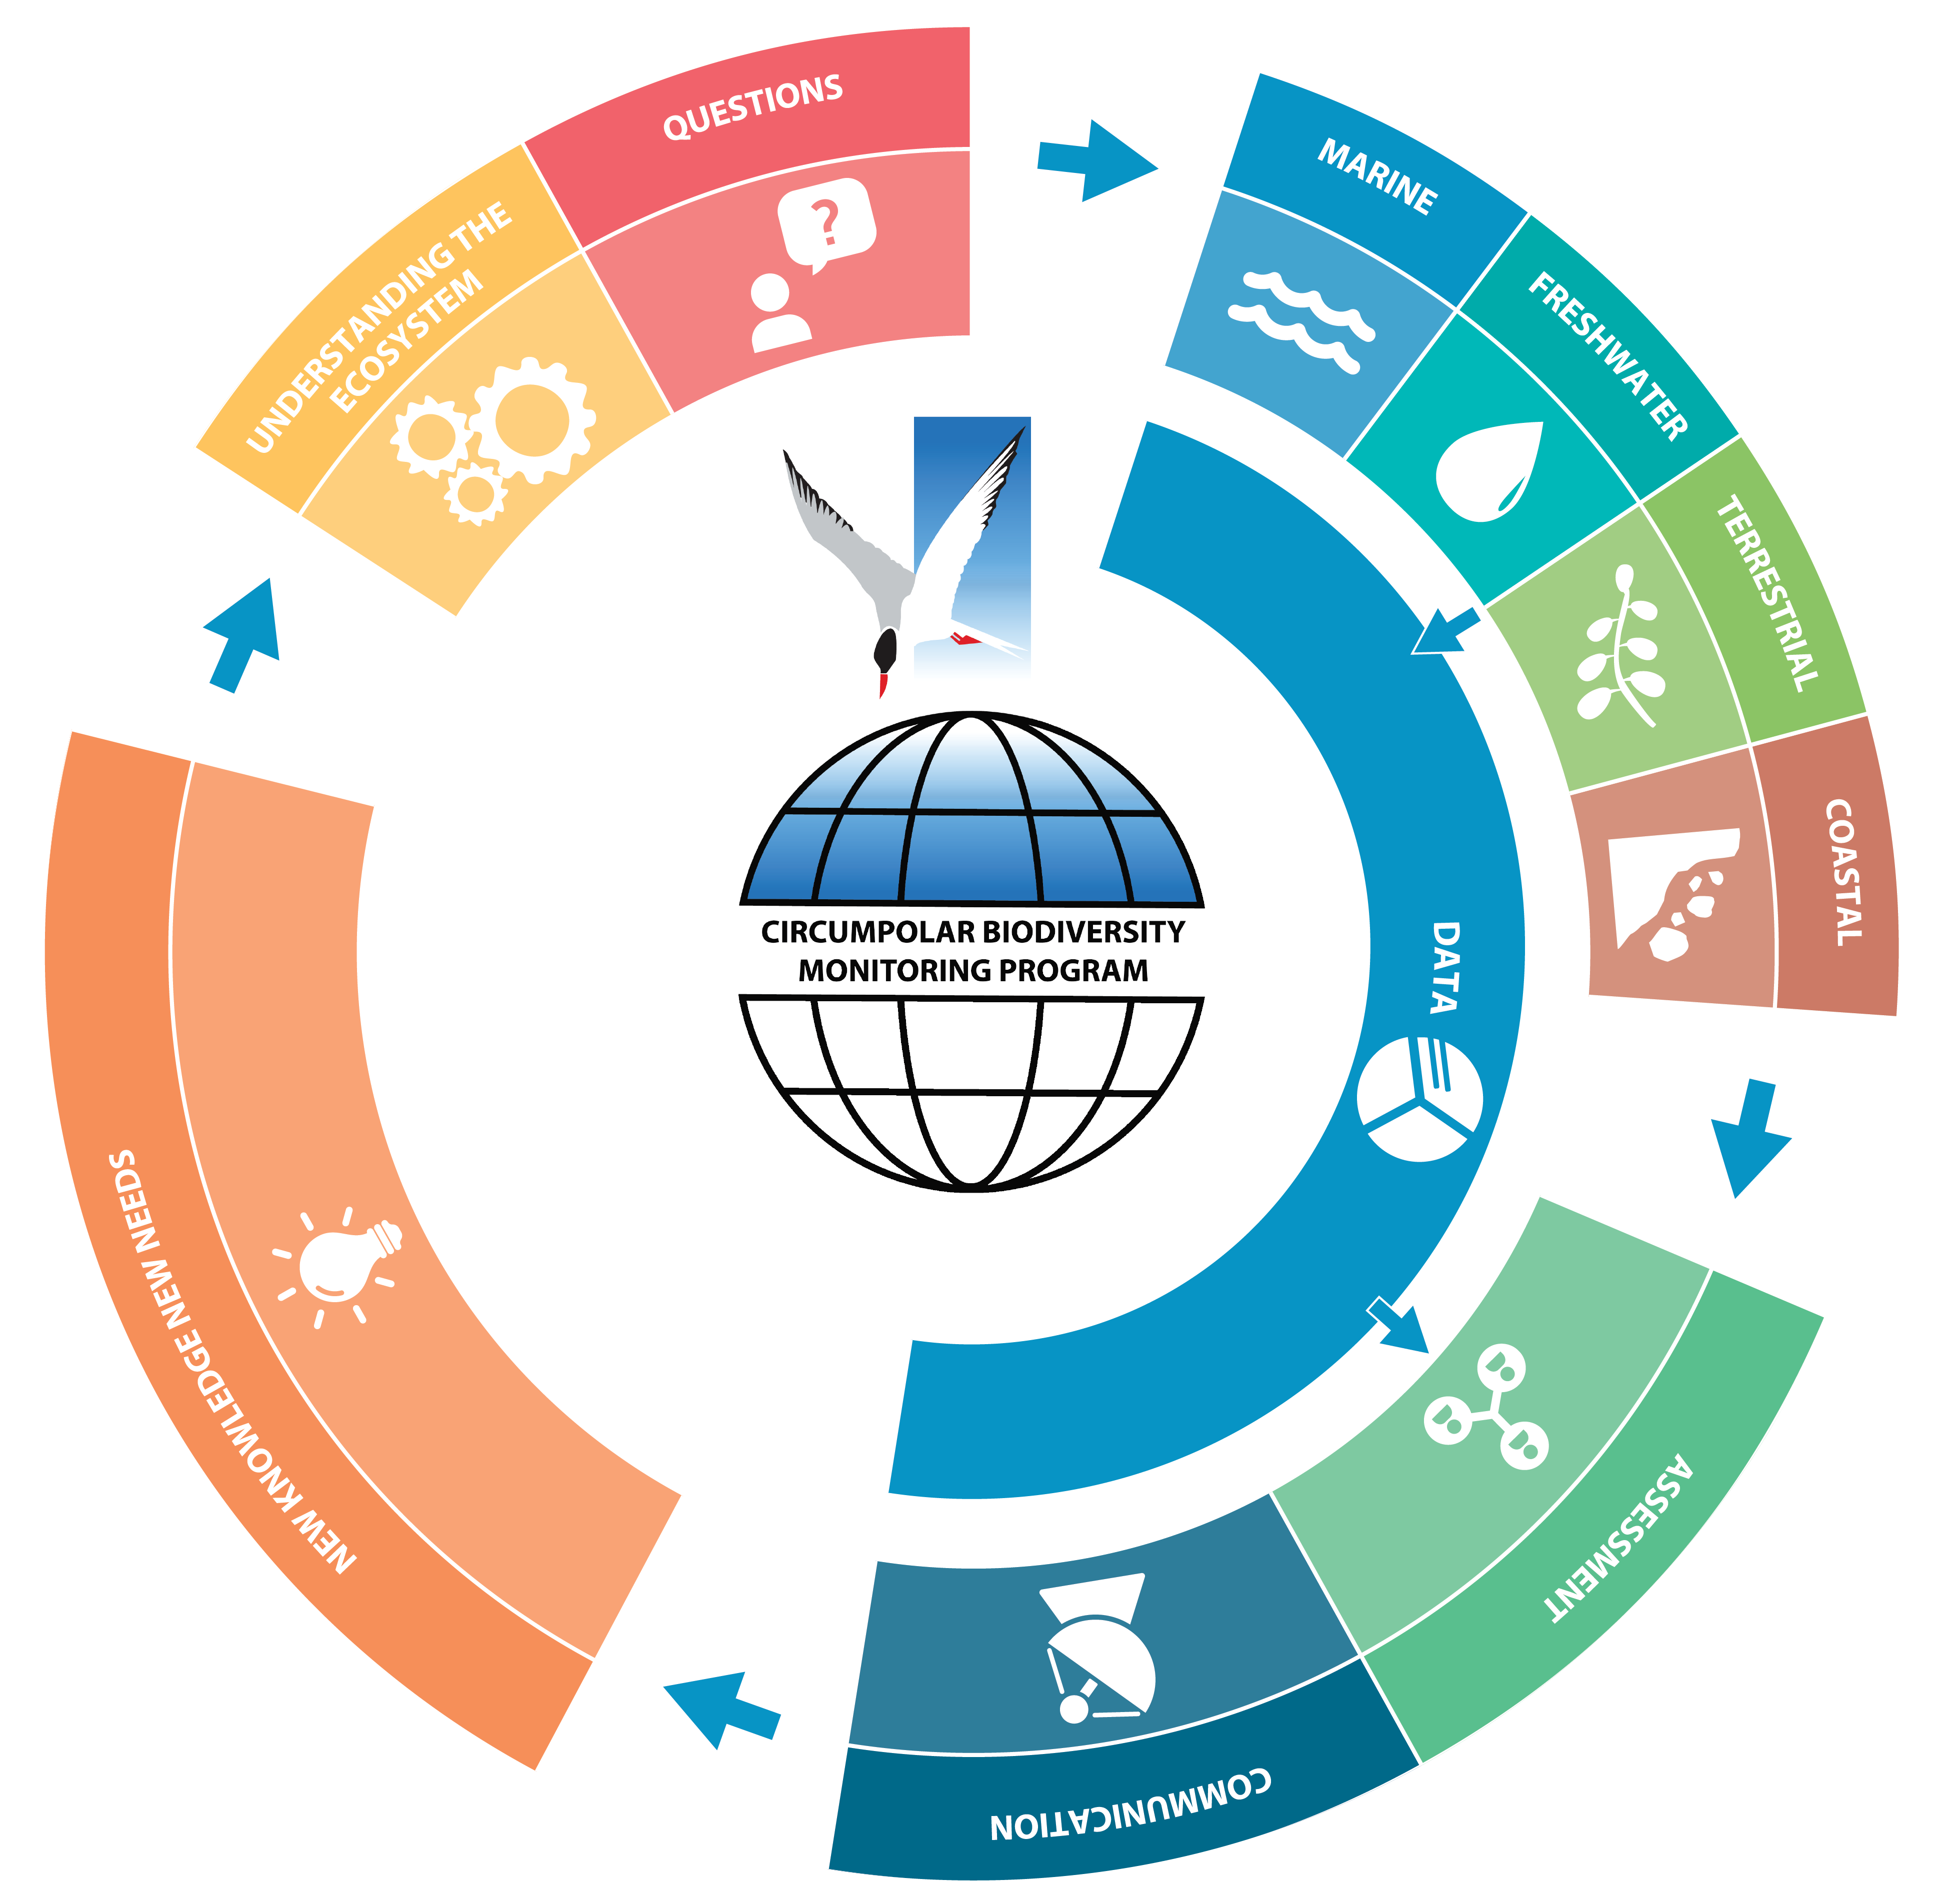
Figure 2-1 The CBMP takes an adaptive Integrated Ecosystem based Approach to monitoring and data creation. This figure illustrates how management questions, conceptual ecosystem models based on science and Traditional Knowledge (TK), and existing monitoring networks are designed to guide the four CBMP Steering Groups (marine, freshwater, terrestrial, and coastal) in their development. Monitoring outputs (data) are designed to feed into the assessment and decision-making processes (data, communication and reporting). The findings are then intended to feed back into the monitoring program. State of the Arctic Freshwater Biodiversity Report - Chapter 2 - Page 15 - Figure 2-1
-
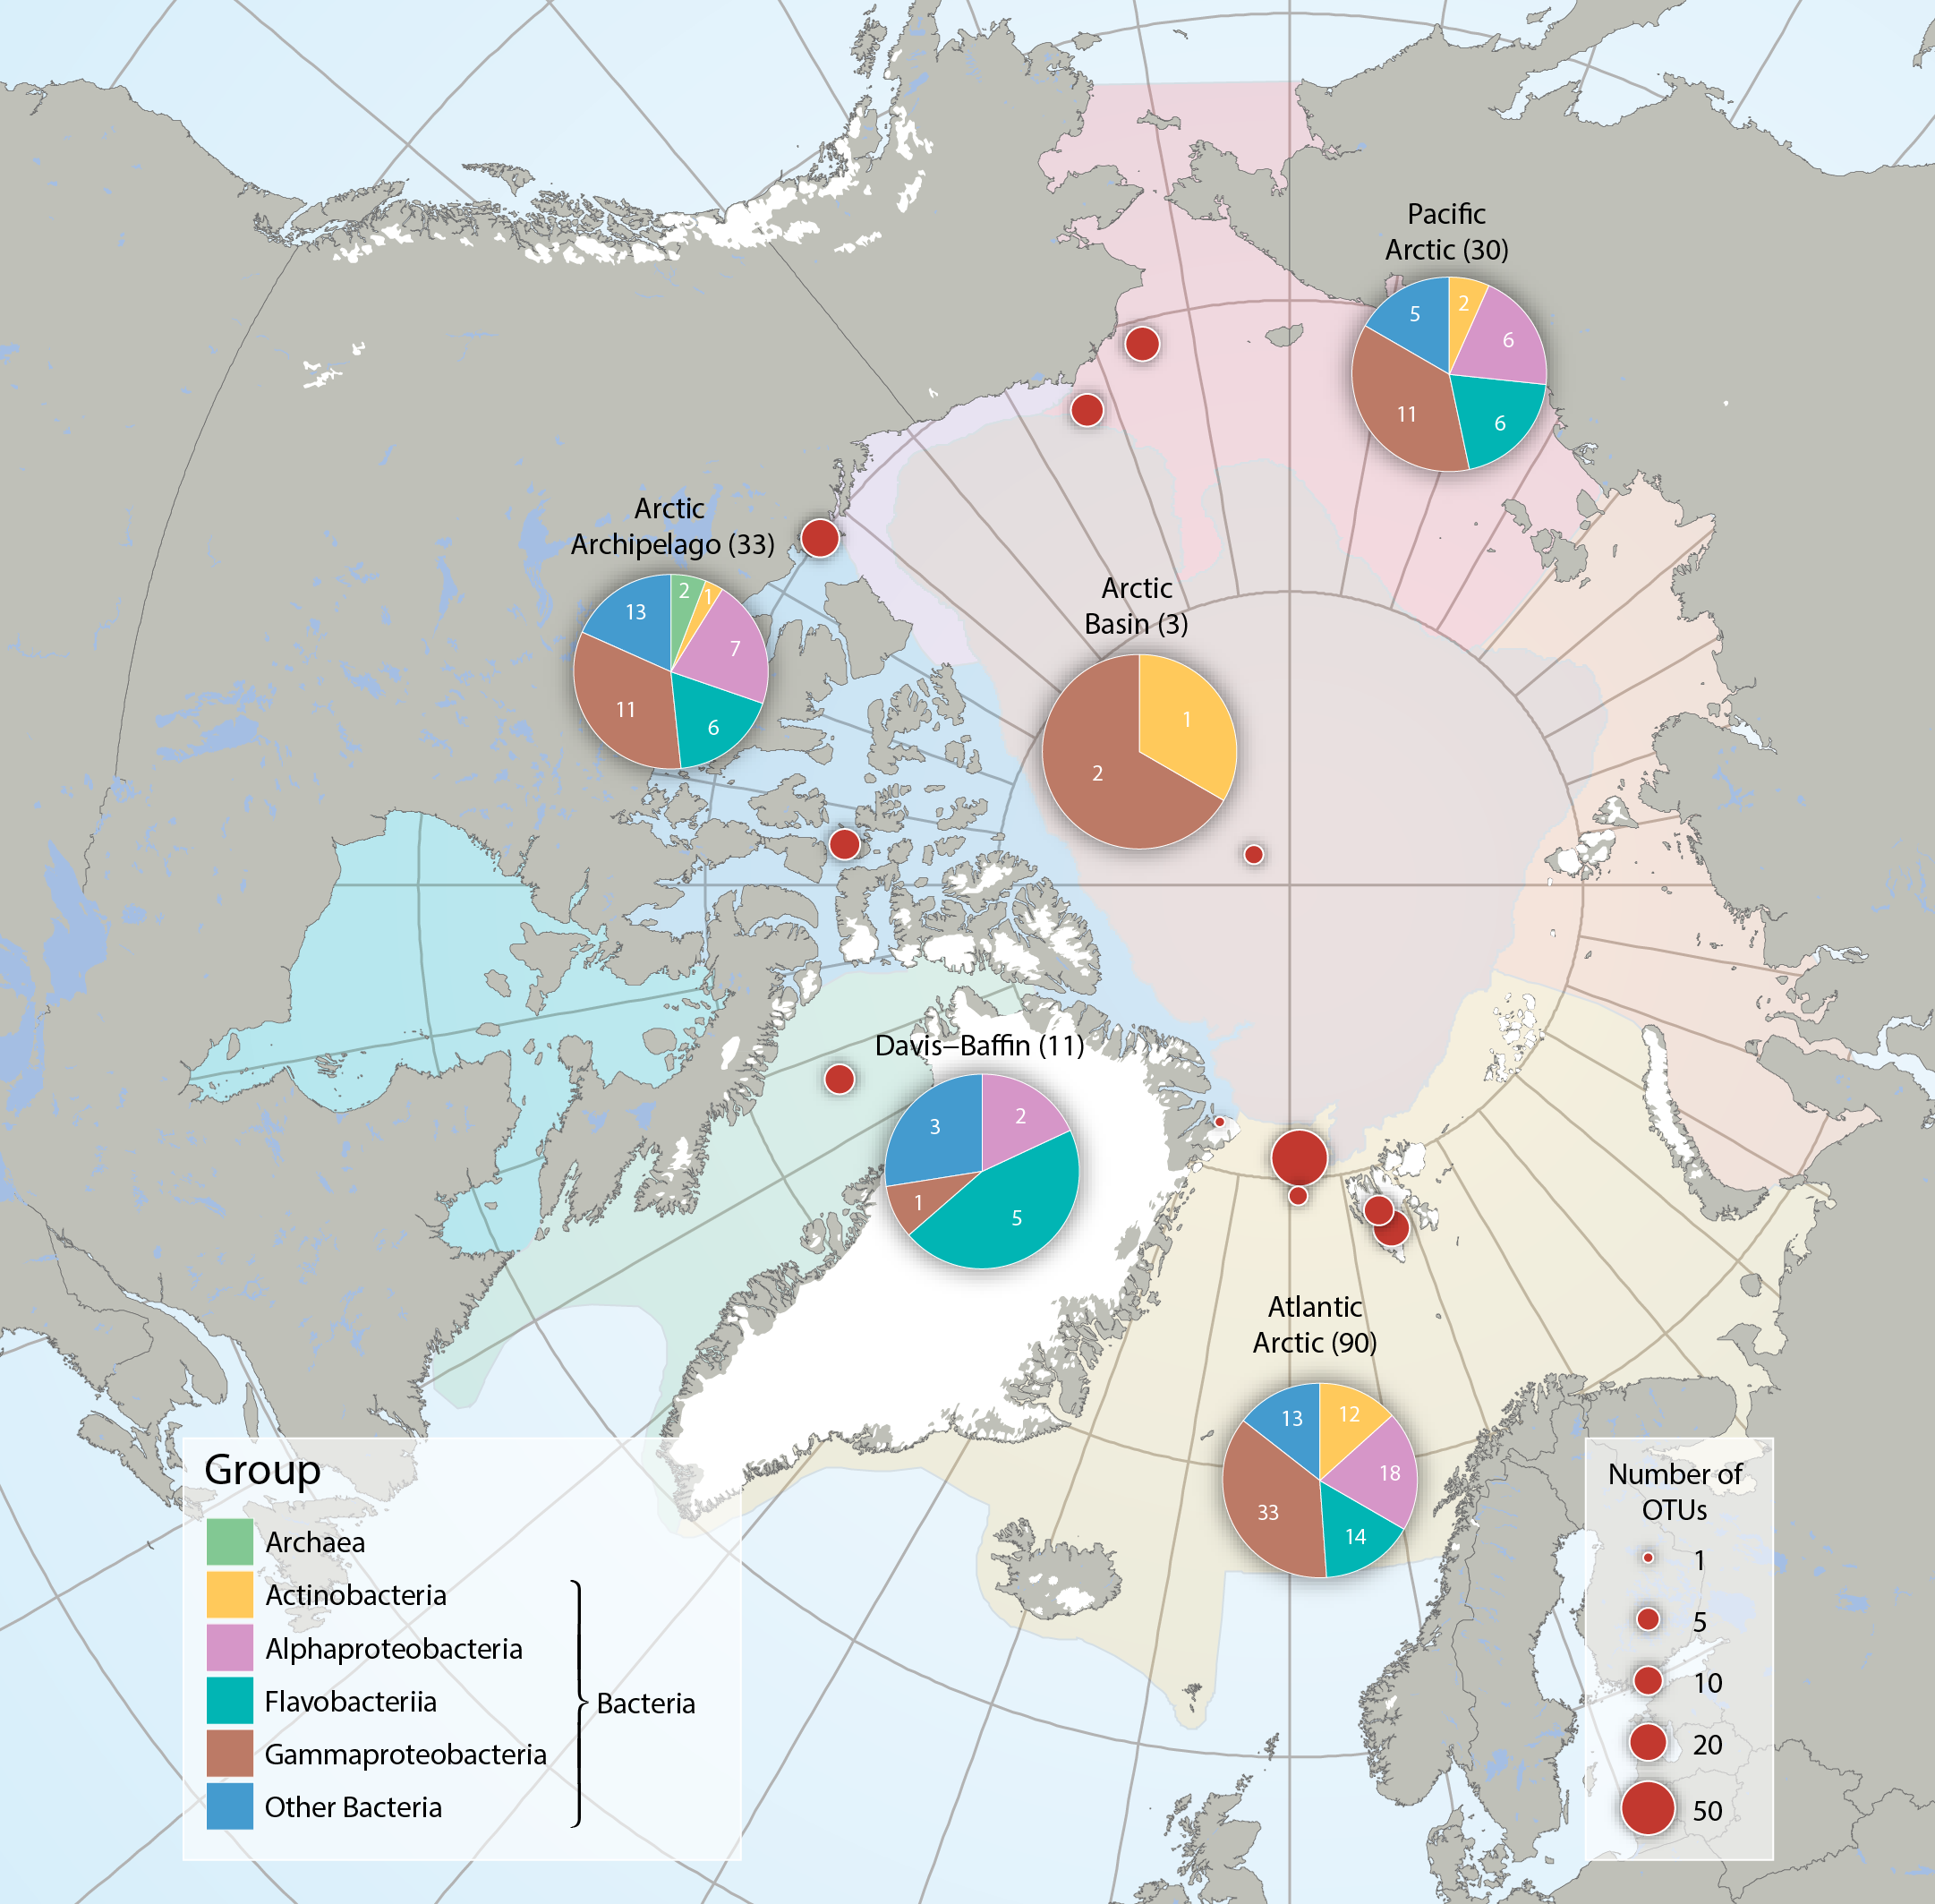
Bacteria and Archaea across five Arctic Marine Areas based on number of operational taxonomic units (OTUs), or molecular species. Composition of microbial groups, with respective numbers of OTUs (pie charts) and number of OTUs at sampling locations (red dots). Data aggregated by the CBMP Sea Ice Biota Expert Network. Data source: National Center for Biotechnology Information’s (NCBI 2017) Nucleotide and PubMed databases. STATE OF THE ARCTIC MARINE BIODIVERSITY REPORT - <a href="https://arcticbiodiversity.is/findings/sea-ice-biota" target="_blank">Chapter 3</a> - Page 38 - Figure 3.1.2 From the report draft: "Synthesis of available data was performed by using searches conducted in the National Center for Biotechnology Information’s “Nucleotide” (http://www.ncbi.nlm.nih.gov/guide/data-software/) and “PubMed” (http://www.ncbi.nlm.nih.gov/pubmed) databases. Aligned DNA sequences were downloaded and clustered into OTUs by maximum likelihood phylogenetic placement."
-
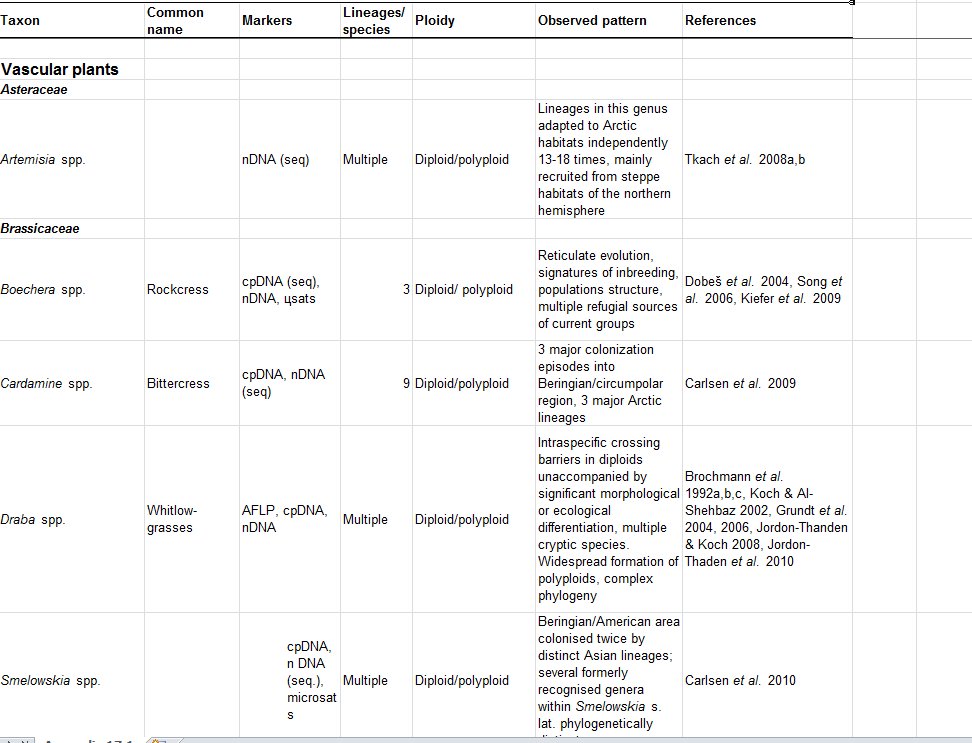
Appenidx 17.1. Selected phylogenetic studies of (or including) Arctic taxa.
-
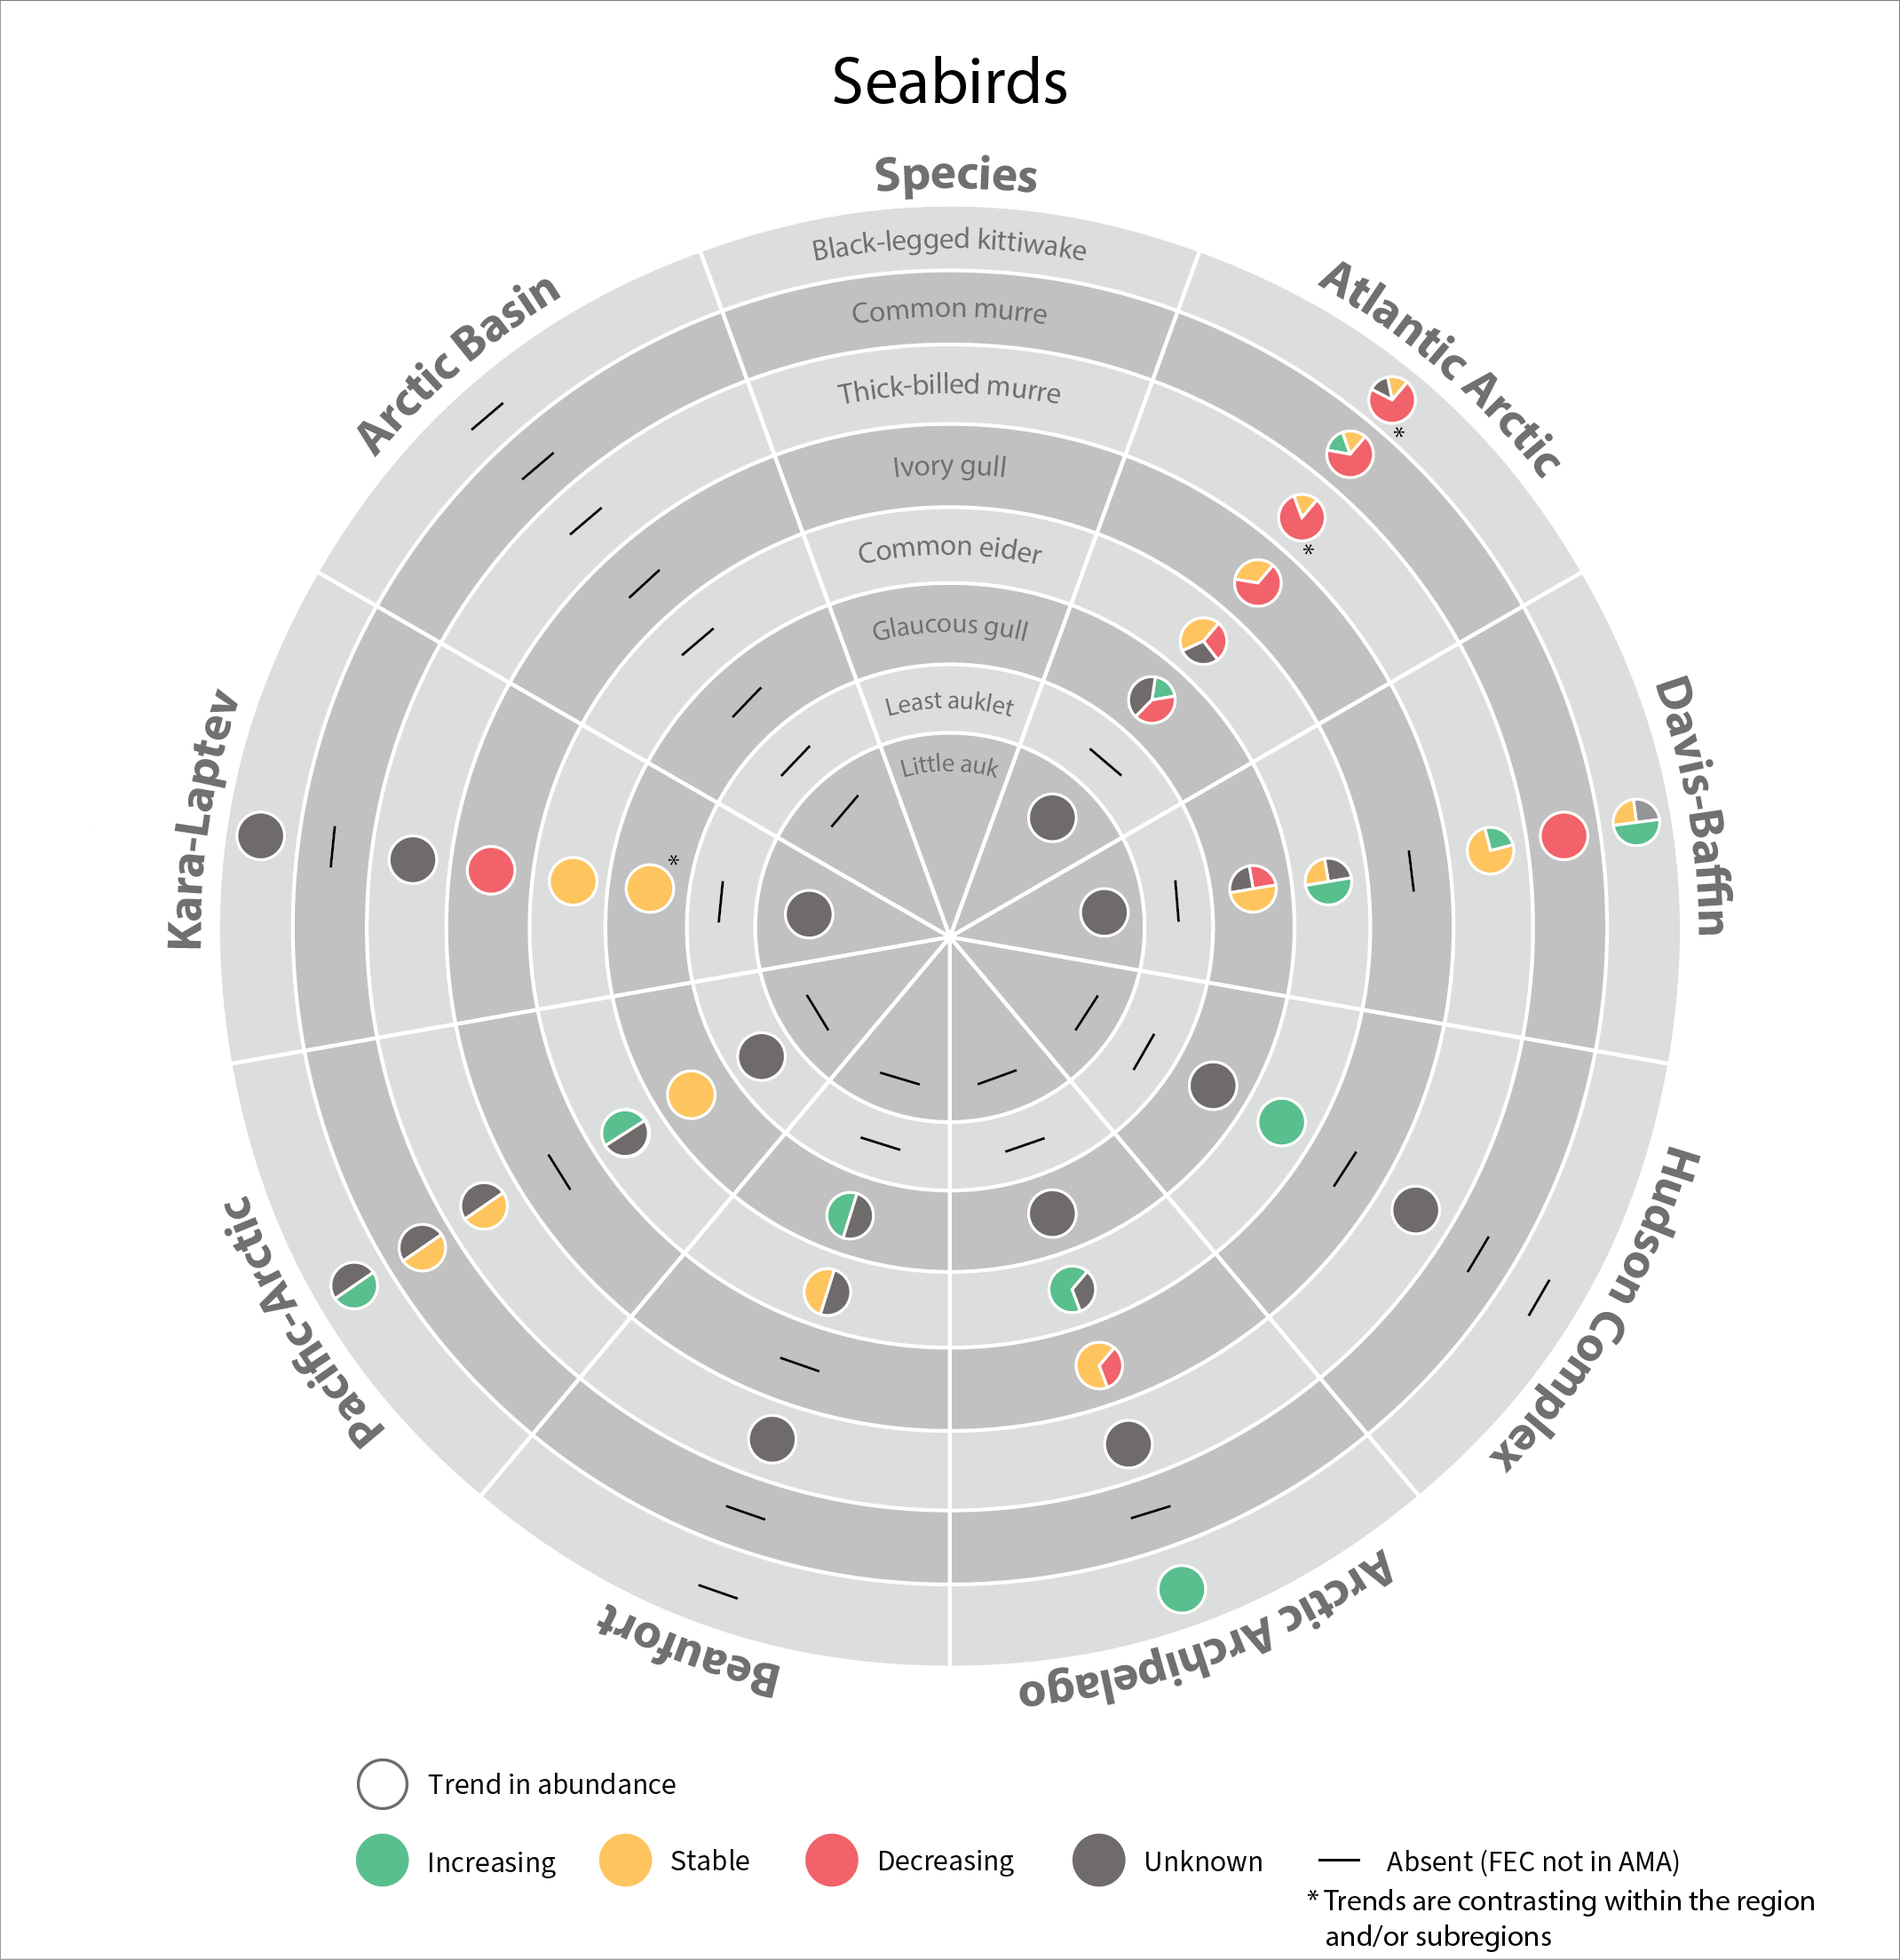
In 2017, the SAMBR synthesized data about biodiversity in Arctic marine ecosystems around the circumpolar Arctic. SAMBR highlighted observed changes and relevant monitoring gaps using data compiled through 2015. In 2021 an update was provided on the status of seabirds in circumpolar Arctic using data from 2016–2019. Most changes reflect access to improved population estimates, orimproved data for monitoring trends,independent of recognized trends in population size.
-
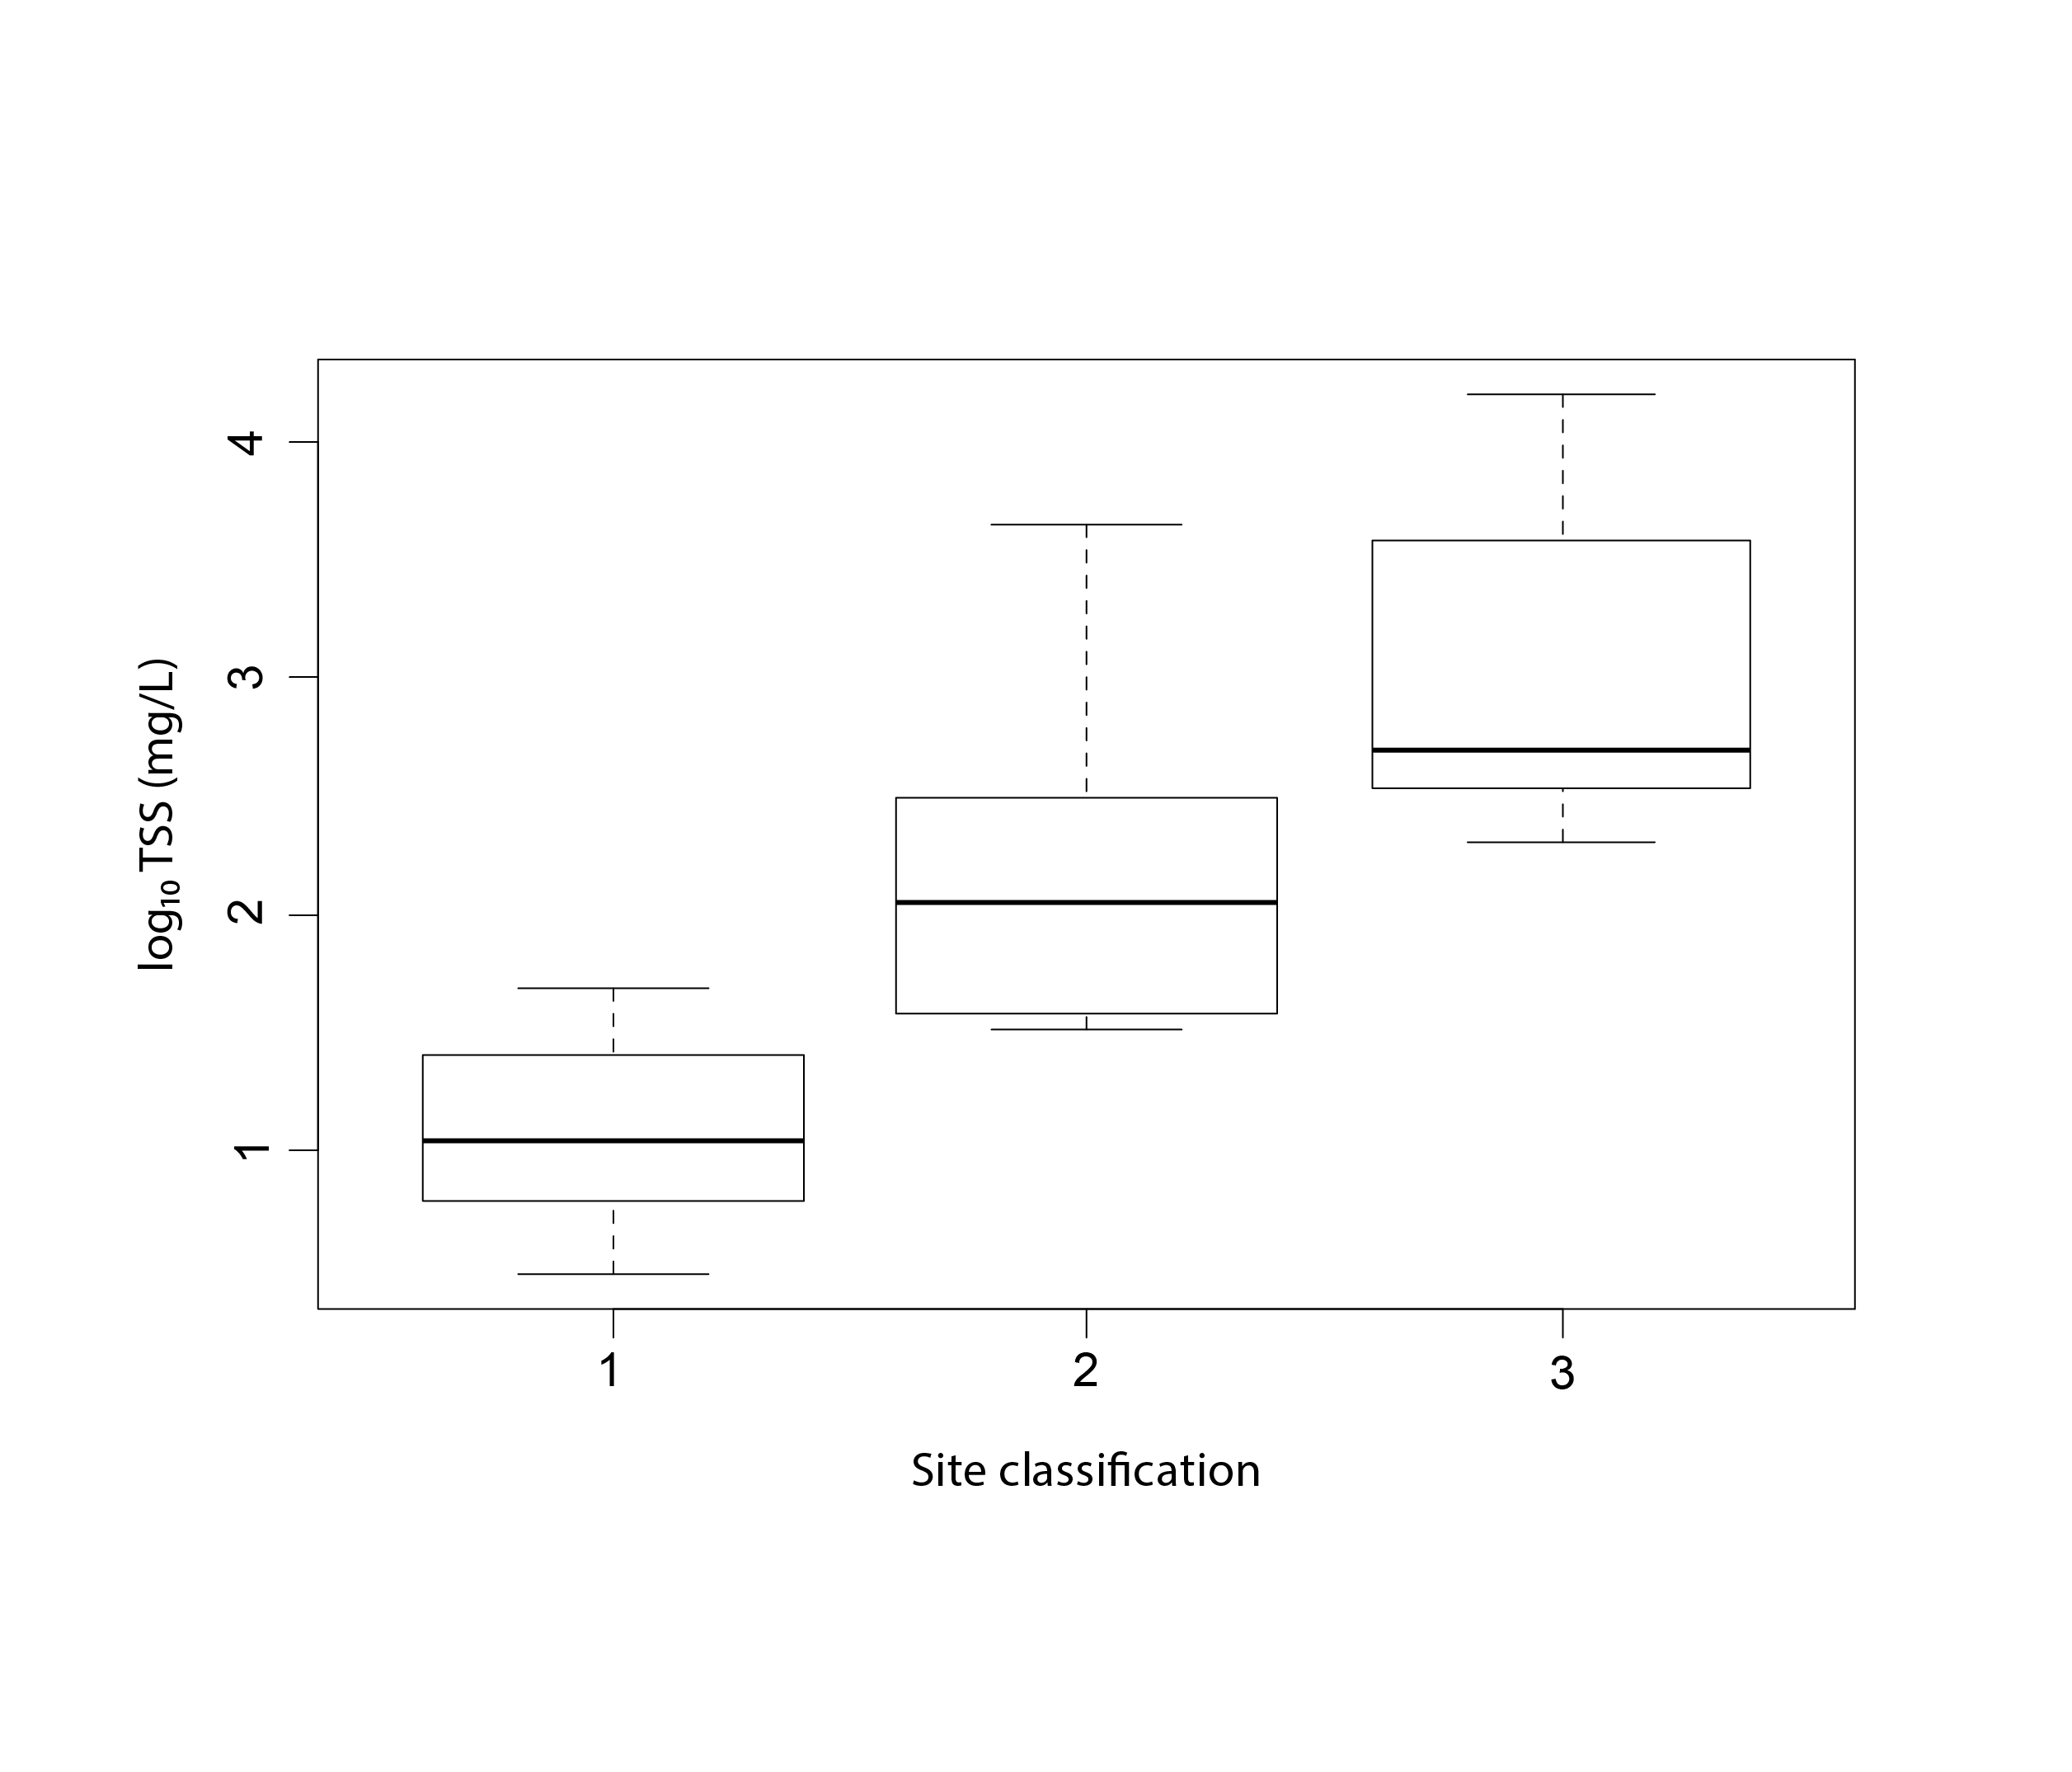
Figure 3-4 Effects of permafrost thaw slumping on Arctic rivers, including (upper) a photo of thaw slump outflow entering a stream on the Peel Plateau, Northwest Territories, Canada, and (lower) log10-transformed total suspended solids (TSS) in (1) undisturbed, (2) 1-2 disturbance, and (3) > 2 disturbance stream sites, with letters indicating significant differences in mean TSS among disturbance classifications Plot reproduced from Chin et al. (2016). State of the Arctic Freshwater Biodiversity Report - Chapter3 - Page 21 - Figure 3-4
-
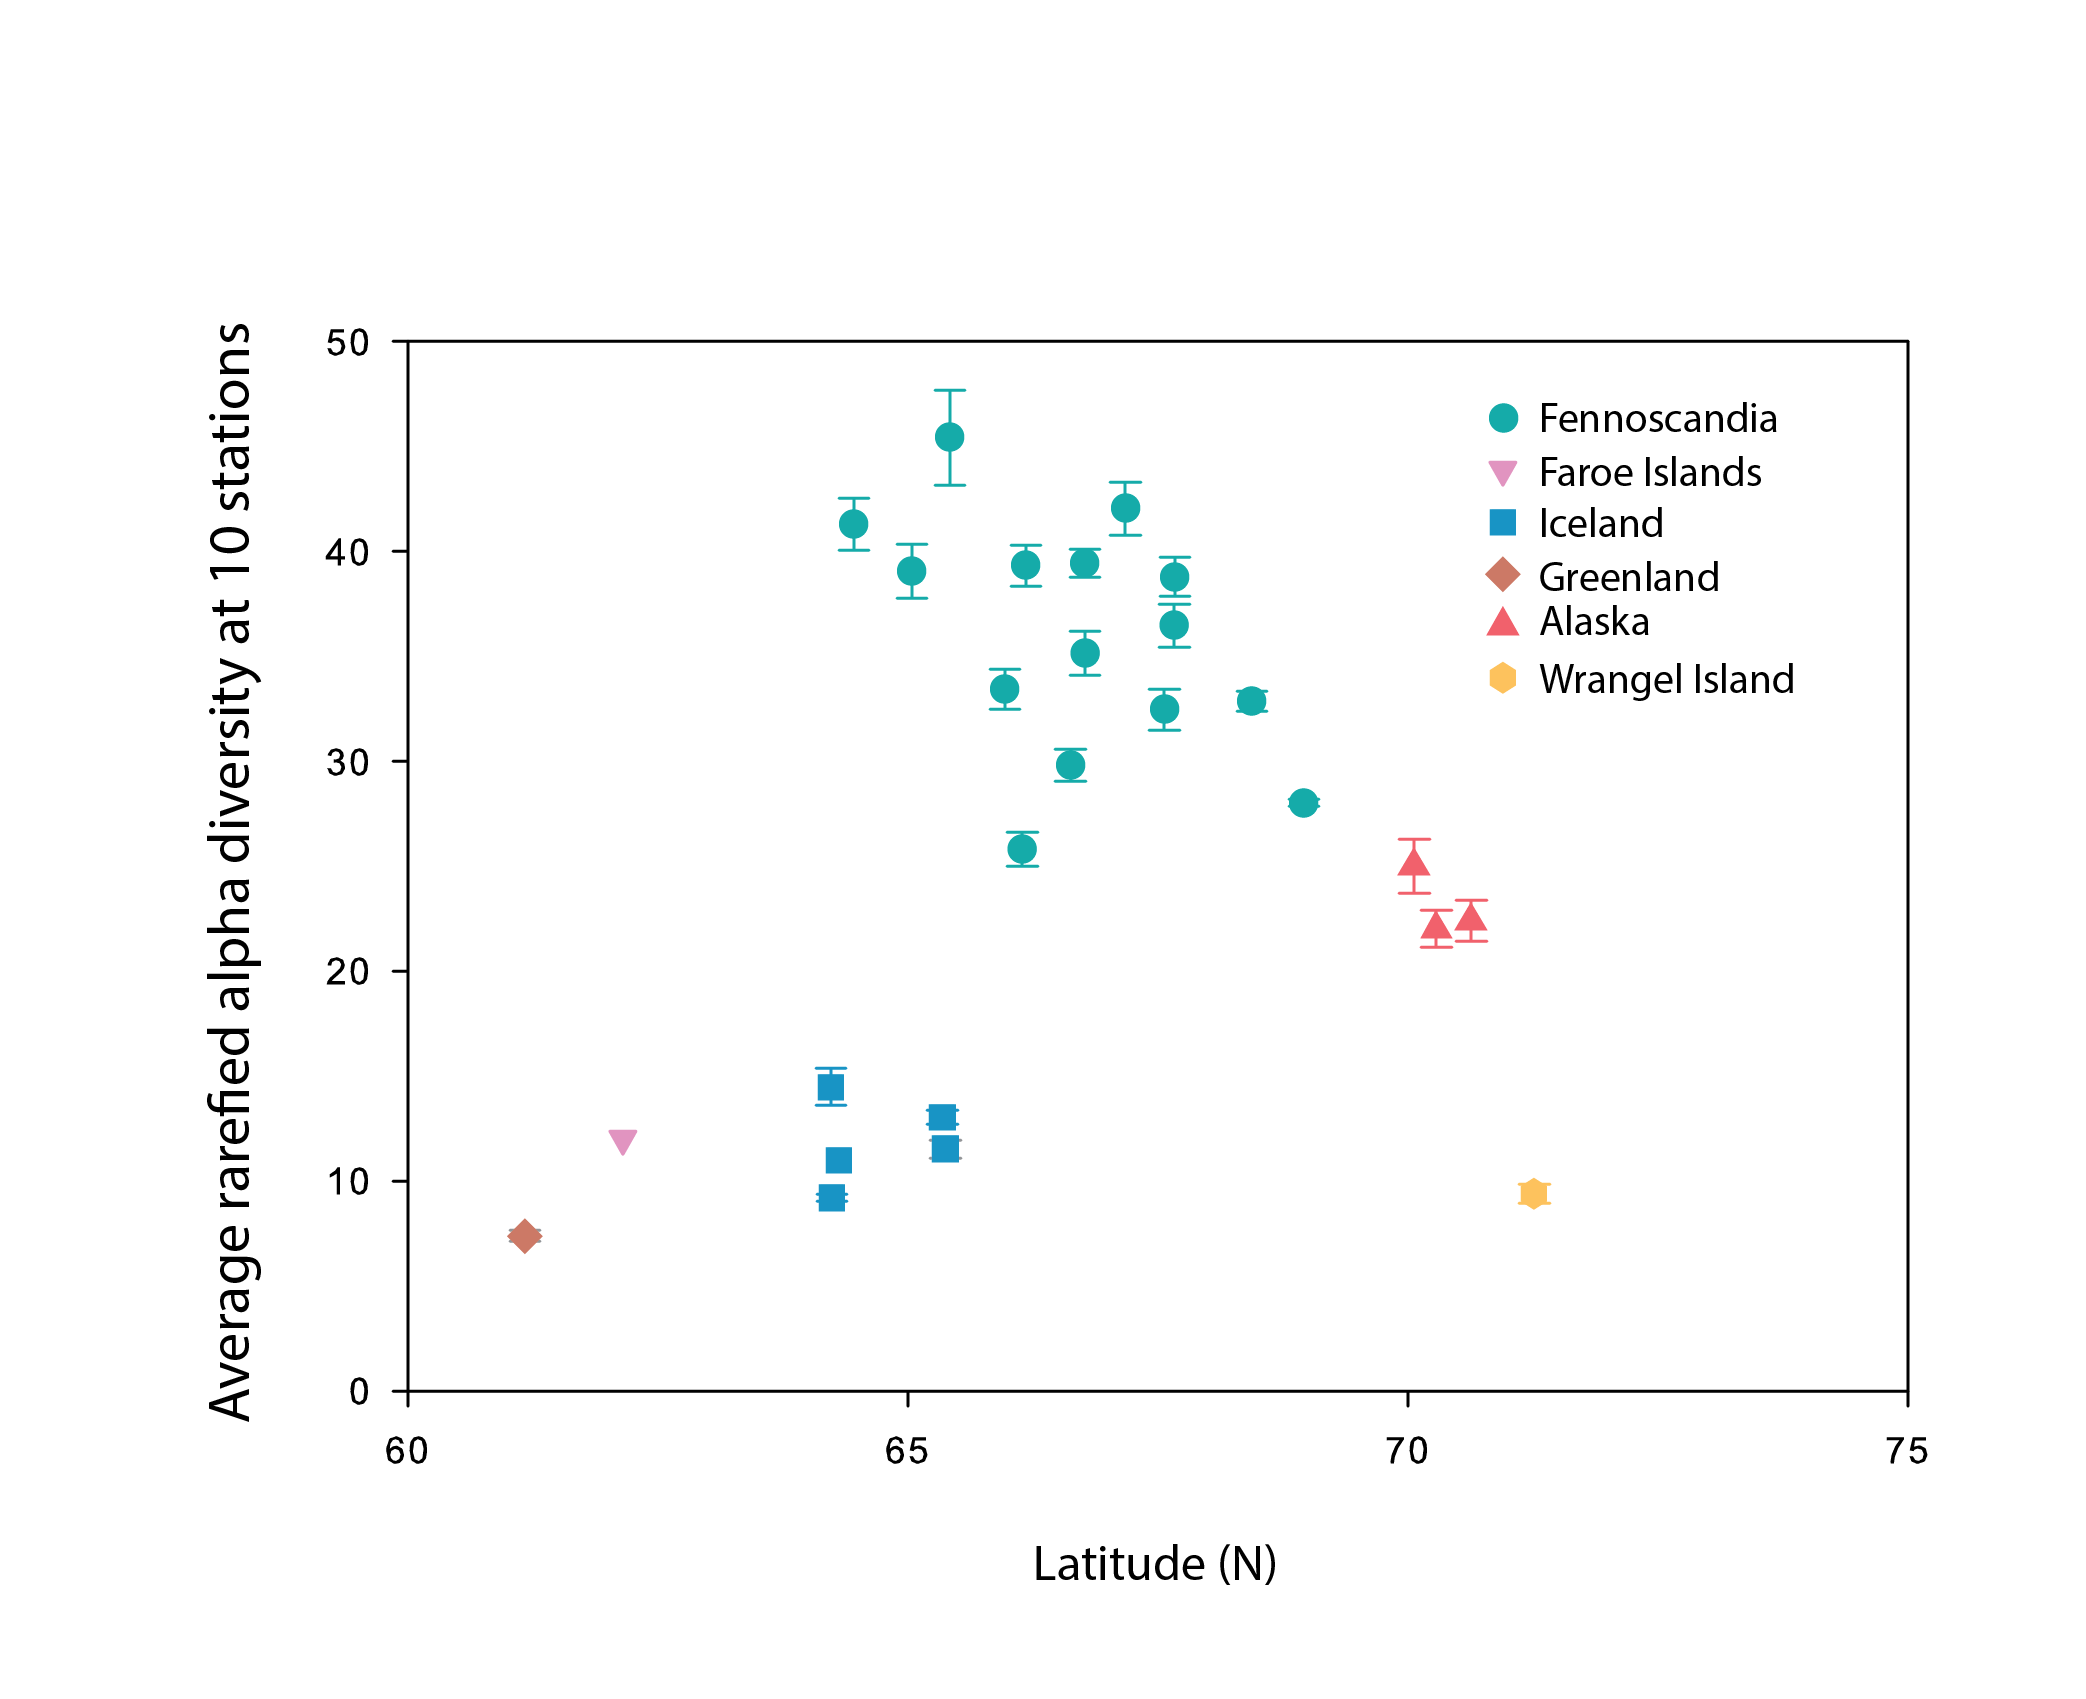
Alpha diversity (rarefied to 10 stations, with error bars indicating standard error) of littoral lake benthic macroinvertebrates plotted as a function of the average latitude of stations in each hydrobasin. Hydrobasins are coloured by country/region. State of the Arctic Freshwater Biodiversity Report - Chapter 4- Page 68 - Figure 4-31
-
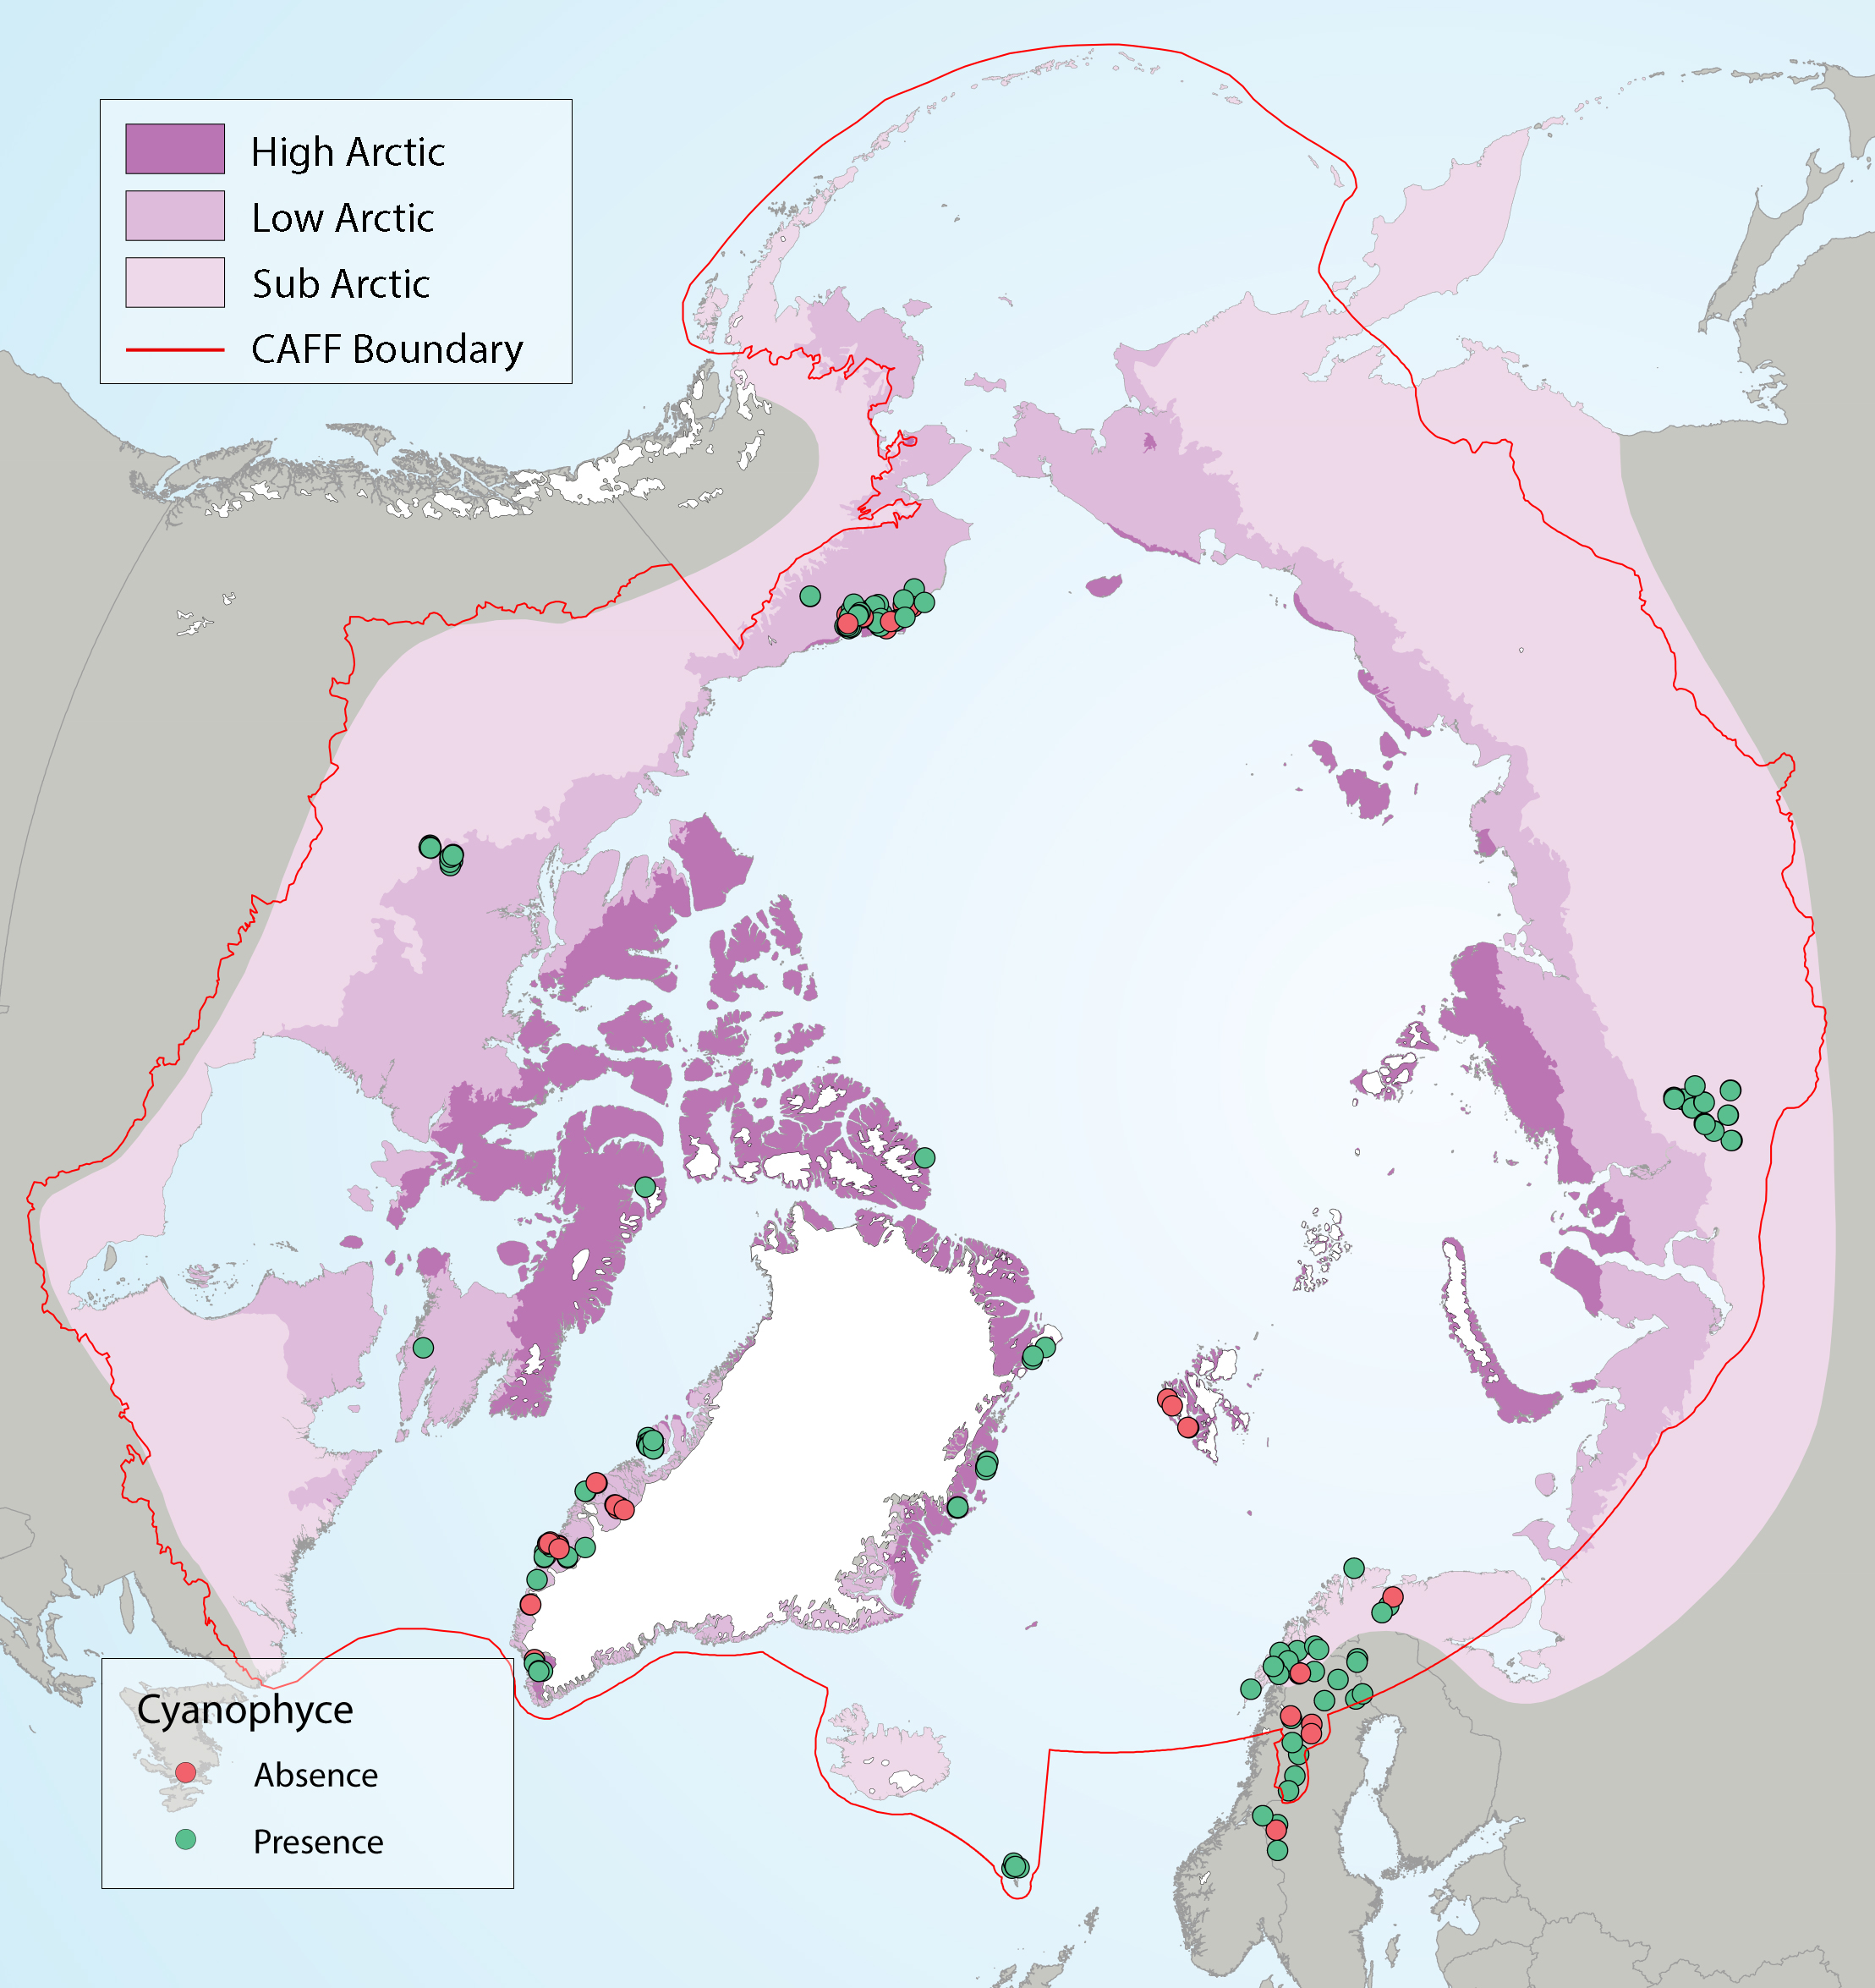
Circumpolar Arctic distribution of Cyanophyceae using presence- absence data from all sites sampled between 1980-2015. State of the Arctic Freshwater Biodiversity Report - Chapter 4 - Page 50 - Figure 4-21
-
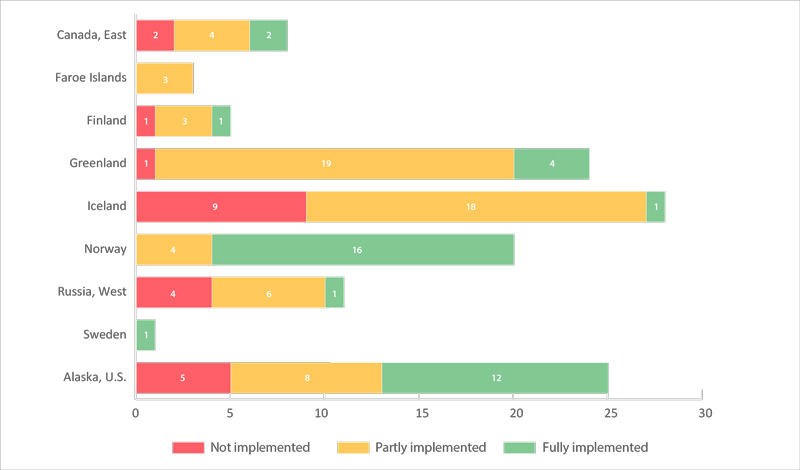
The number of key sites (monitored colonies) for seabirds (in 22 CSMP ecoregions) by country (a total of 125 sites). Sites are categorized as having fully, partially, or not met the CSMP criteria for parameters monitored (see 2.6.2). Data were from Appendix 3 of the CSMP (Irons et al. 2015); the degree of implementation may have changed at some sites since this summary was compiled. STATE OF THE ARCTIC MARINE BIODIVERSITY REPORT - <a href="https://arcticbiodiversity.is/findings/seabirds" target="_blank">Chapter 3</a> - Page 134 - Figure 3.5.2
-
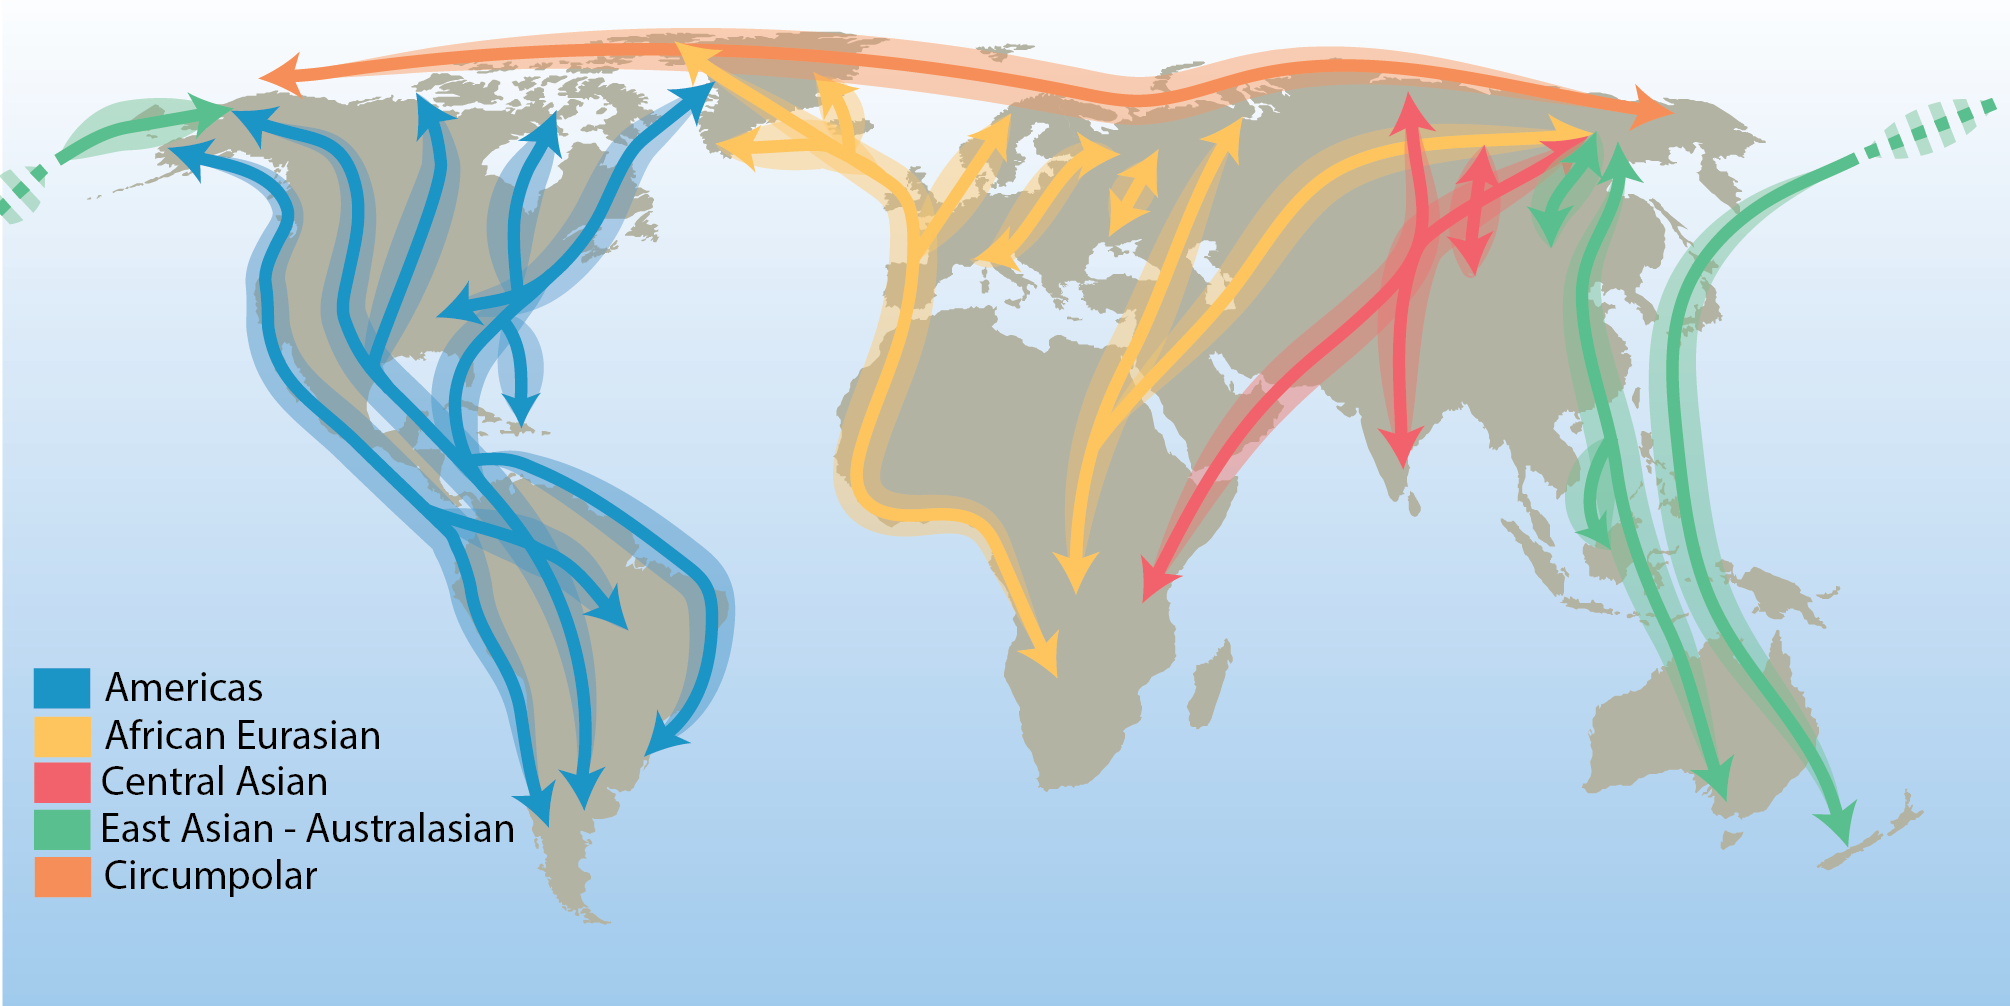
There are few true Arctic specialist birds that remain in the Arctic throughout their annual cycle. They include the willow and rock ptarmigan (Lagopus lagopus and L. muta), gyrfalcon (Falco rusticolus), snowy owl (Bubo scandiacus), Arctic redpoll (Carduelis hornemanni) and northern raven (Corvus corax)—a cosmopolitan species with resident populations in the Arctic. All other terrestrial Arctic-breeding bird species migrate to warmer regions during the northern winter, connecting the Arctic to all corners of the globe. Hence, their distributions are influenced by the routes they follow. These distinct migration routes are referred to as flyways and are defined by a combination of ecological and political boundaries and differ in spatial scale. The CBMP refers to the traditional four north–south flyways, in addition to a circumpolar flyway representing the few species that remain largely within the Arctic year-round (Figure 3-20). STATE OF THE ARCTIC TERRESTRIAL BIODIVERSITY REPORT - Chapter 3 - Page 48- Figure 3.20
-
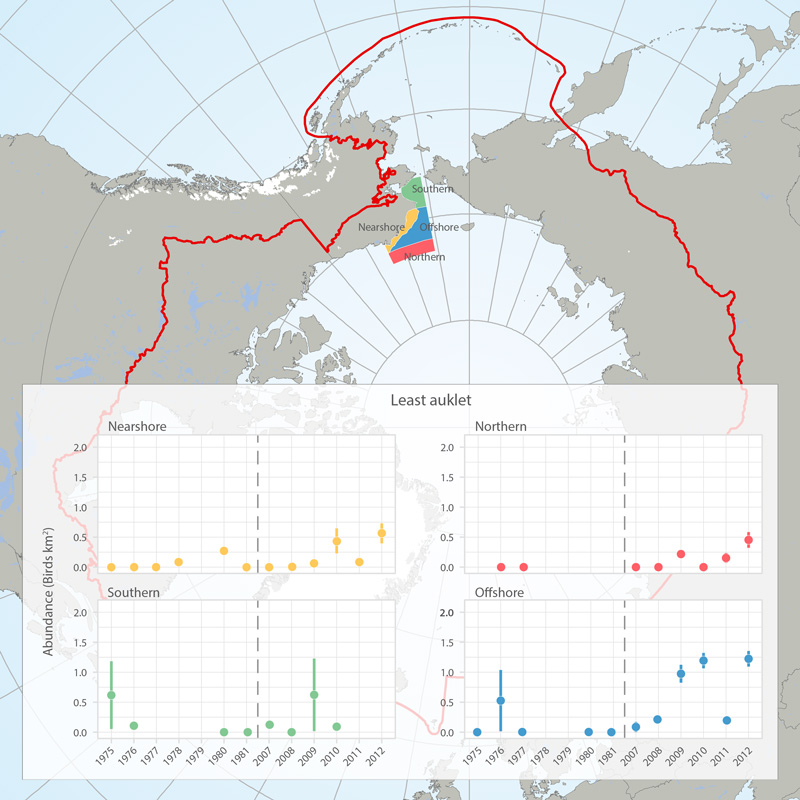
Abundance (birds/km2) of least auklets in four regions (see map) of the eastern Chukchi Sea, 1975-1981 and 2007-2012, based on at-sea surveys (archived in the North Pacific Pelagic Seabird Database). Figures provided by Adrian Gall, ABR, Inc. and reprinted with permission. STATE OF THE ARCTIC MARINE BIODIVERSITY REPORT - <a href="https://arcticbiodiversity.is/findings/seabirds" target="_blank">Chapter 3</a> - Page 138 - Box fig. 3.5.1 The shapefile outlines 4 regions of the eastern Chukchi Sea that were surveyed for seabirds during the open-water seasons of 1976-2012. We compared the density of seabirds in these regions among two time periods (1975-1981 and 2008-2012) to assess changes in seabird abundance over the past 4 decades. We also include a figure showing abundance of Least Auklets 1975-2012. Data are from the North Pacific Pelagic Seabird Database, maintained by the USGS (http://alaska.usgs.gov/science/biology/nppsd/index.php).