 CAFF - Arctic Biodiversity Data Service (ABDS)
dataset
Type of resources
Available actions
Topics
Keywords
Contact for the resource
Provided by
Years
Formats
Representation types
Update frequencies
status
Scale
-
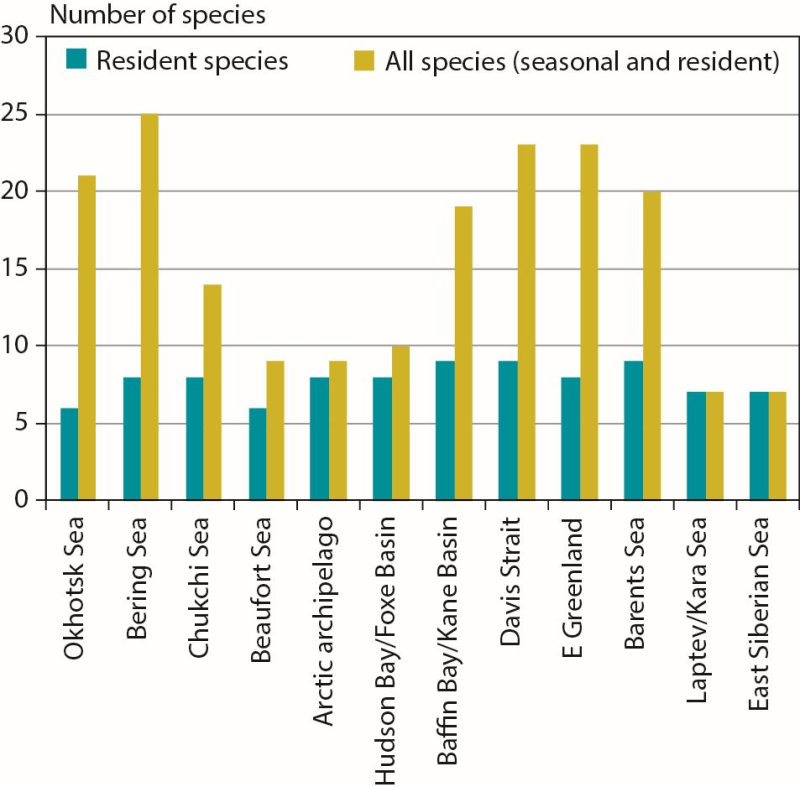
Number of marine mammal species in Arctic marine regions classified by resident species (n = 11 total) or all species (including seasonal visitors, n = 35 total). CAFF 2013. Arctic Biodiversity Assessment. Status and Trends in Arctic biodiversity. Conservation of Arctic Flora and Fauna, Akureyri - Mammal (Chapter 3) page 84
-
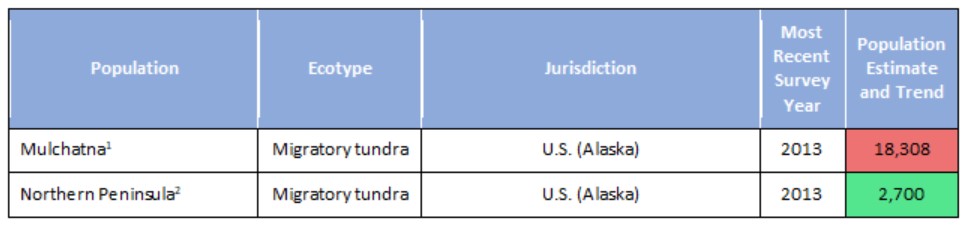
Population estimates and trends for Rangifer populations of the migratory tundra, Arctic island, mountain, and forest ecotypes where their circumpolar distribution intersects the CAFF boundary. Population trends (Increasing, Stable, Decreasing, or Unknown) are indicated by shading. Data sources for each population are indicated as footnotes. STATE OF THE ARCTIC TERRESTRIAL BIODIVERSITY REPORT - Chapter 3 - Page 70 - Table 3.4
-
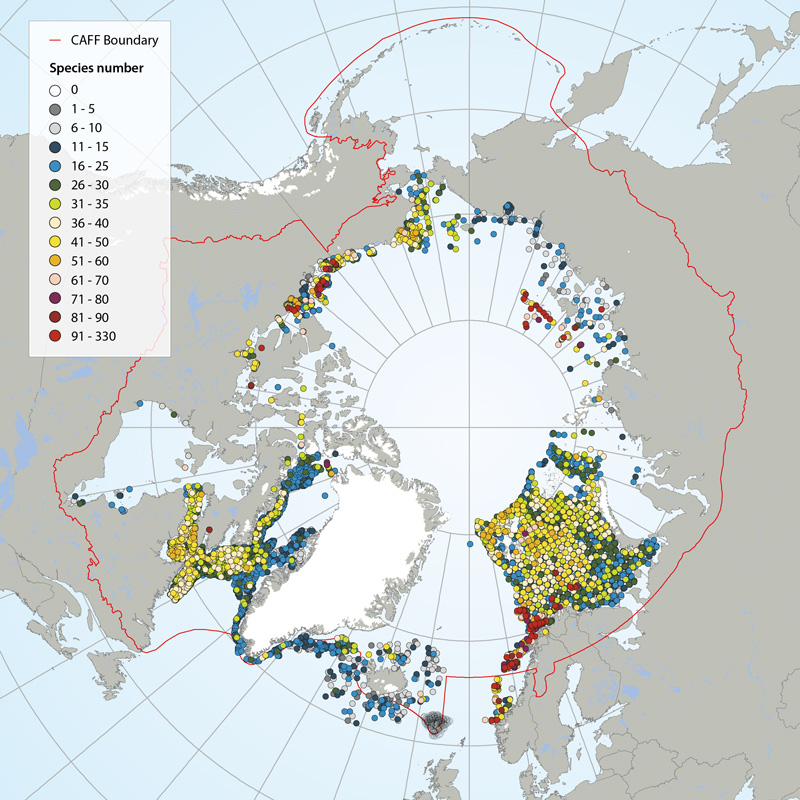
Number of megafauna species/taxa in the Arctic (7,322 stations in total), based on recent trawl investigations. Stations with highest species/taxon number are sorted to the top, meaning that dense concentrations of stations (e.g. Eastern Canada, Barents Sea), with low species numbers are hidden behind stations with higher species numbers. Also note that species numbers are somewhat biased by differing taxonomic resolution between studies. Data from: Icelandic Institute of Natural History, Iceland; Marine Research Institute, Iceland; University of Alaska, Fairbanks, U.S.; Greenland Institute of Natural Resources, Greenland; Zoological Institute of the Russian Academy of Sciences, St. Petersburg, Russia; Université du Québec à Rimouski, Canada; Fisheries and Oceans Canada; Institute of Marine Research, Norway; and Polar Research Institute of Marine Fisheries and Oceanography, Murmansk, Russia. STATE OF THE ARCTIC MARINE BIODIVERSITY REPORT - <a href="https://arcticbiodiversity.is/findings/benthos" target="_blank">Chapter 3</a> - Page 91 - Box figure 3.3.2 Several regions of the Pan Arctic have been sampled with trawl. Even though the trawl configurations and the taxonomic level are different from area to area, we choose to consider the taxonomic richness as relatively comparative.
-
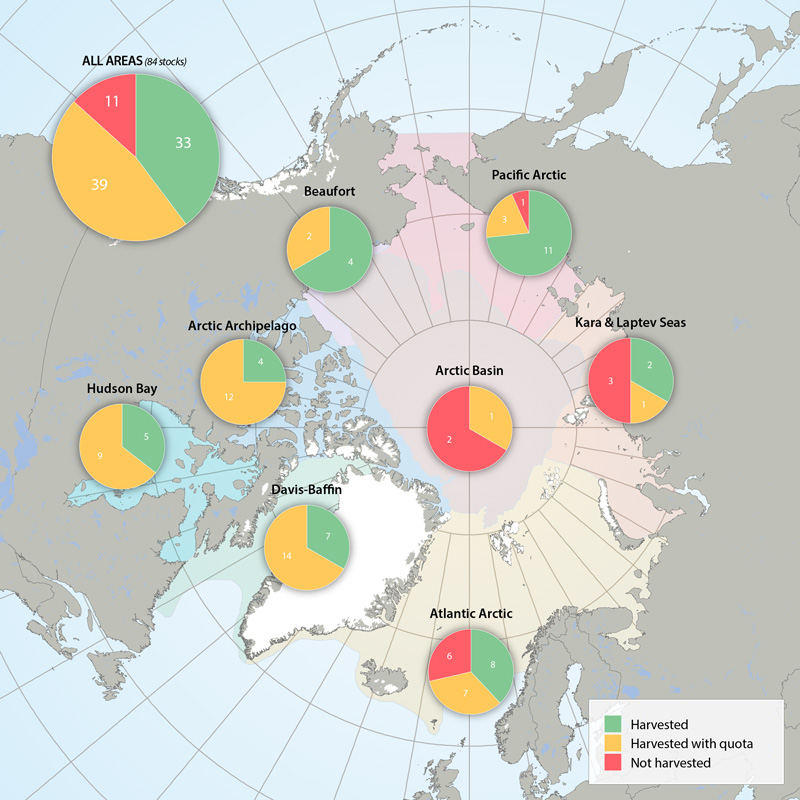
Harvest marine mammal Focal Ecosystem Component stocks in Arctic Marine Areas. Harvested without quotas, with quotas or not harvested. STATE OF THE ARCTIC MARINE BIODIVERSITY REPORT - <a href="https://arcticbiodiversity.is/findings/marine-mammals" target="_blank">Chapter 3</a> - Page 158 - Figure 3.6.4
-

The Arctic terrestrial food web includes the exchange of energy and nutrients. Arrows to and from the driver boxes indicate the relative effect and counter effect of different types of drivers on the ecosystem. STATE OF THE ARCTIC TERRESTRIAL BIODIVERSITY REPORT - Chapter 2 - Page 26- Figure 2.4
-
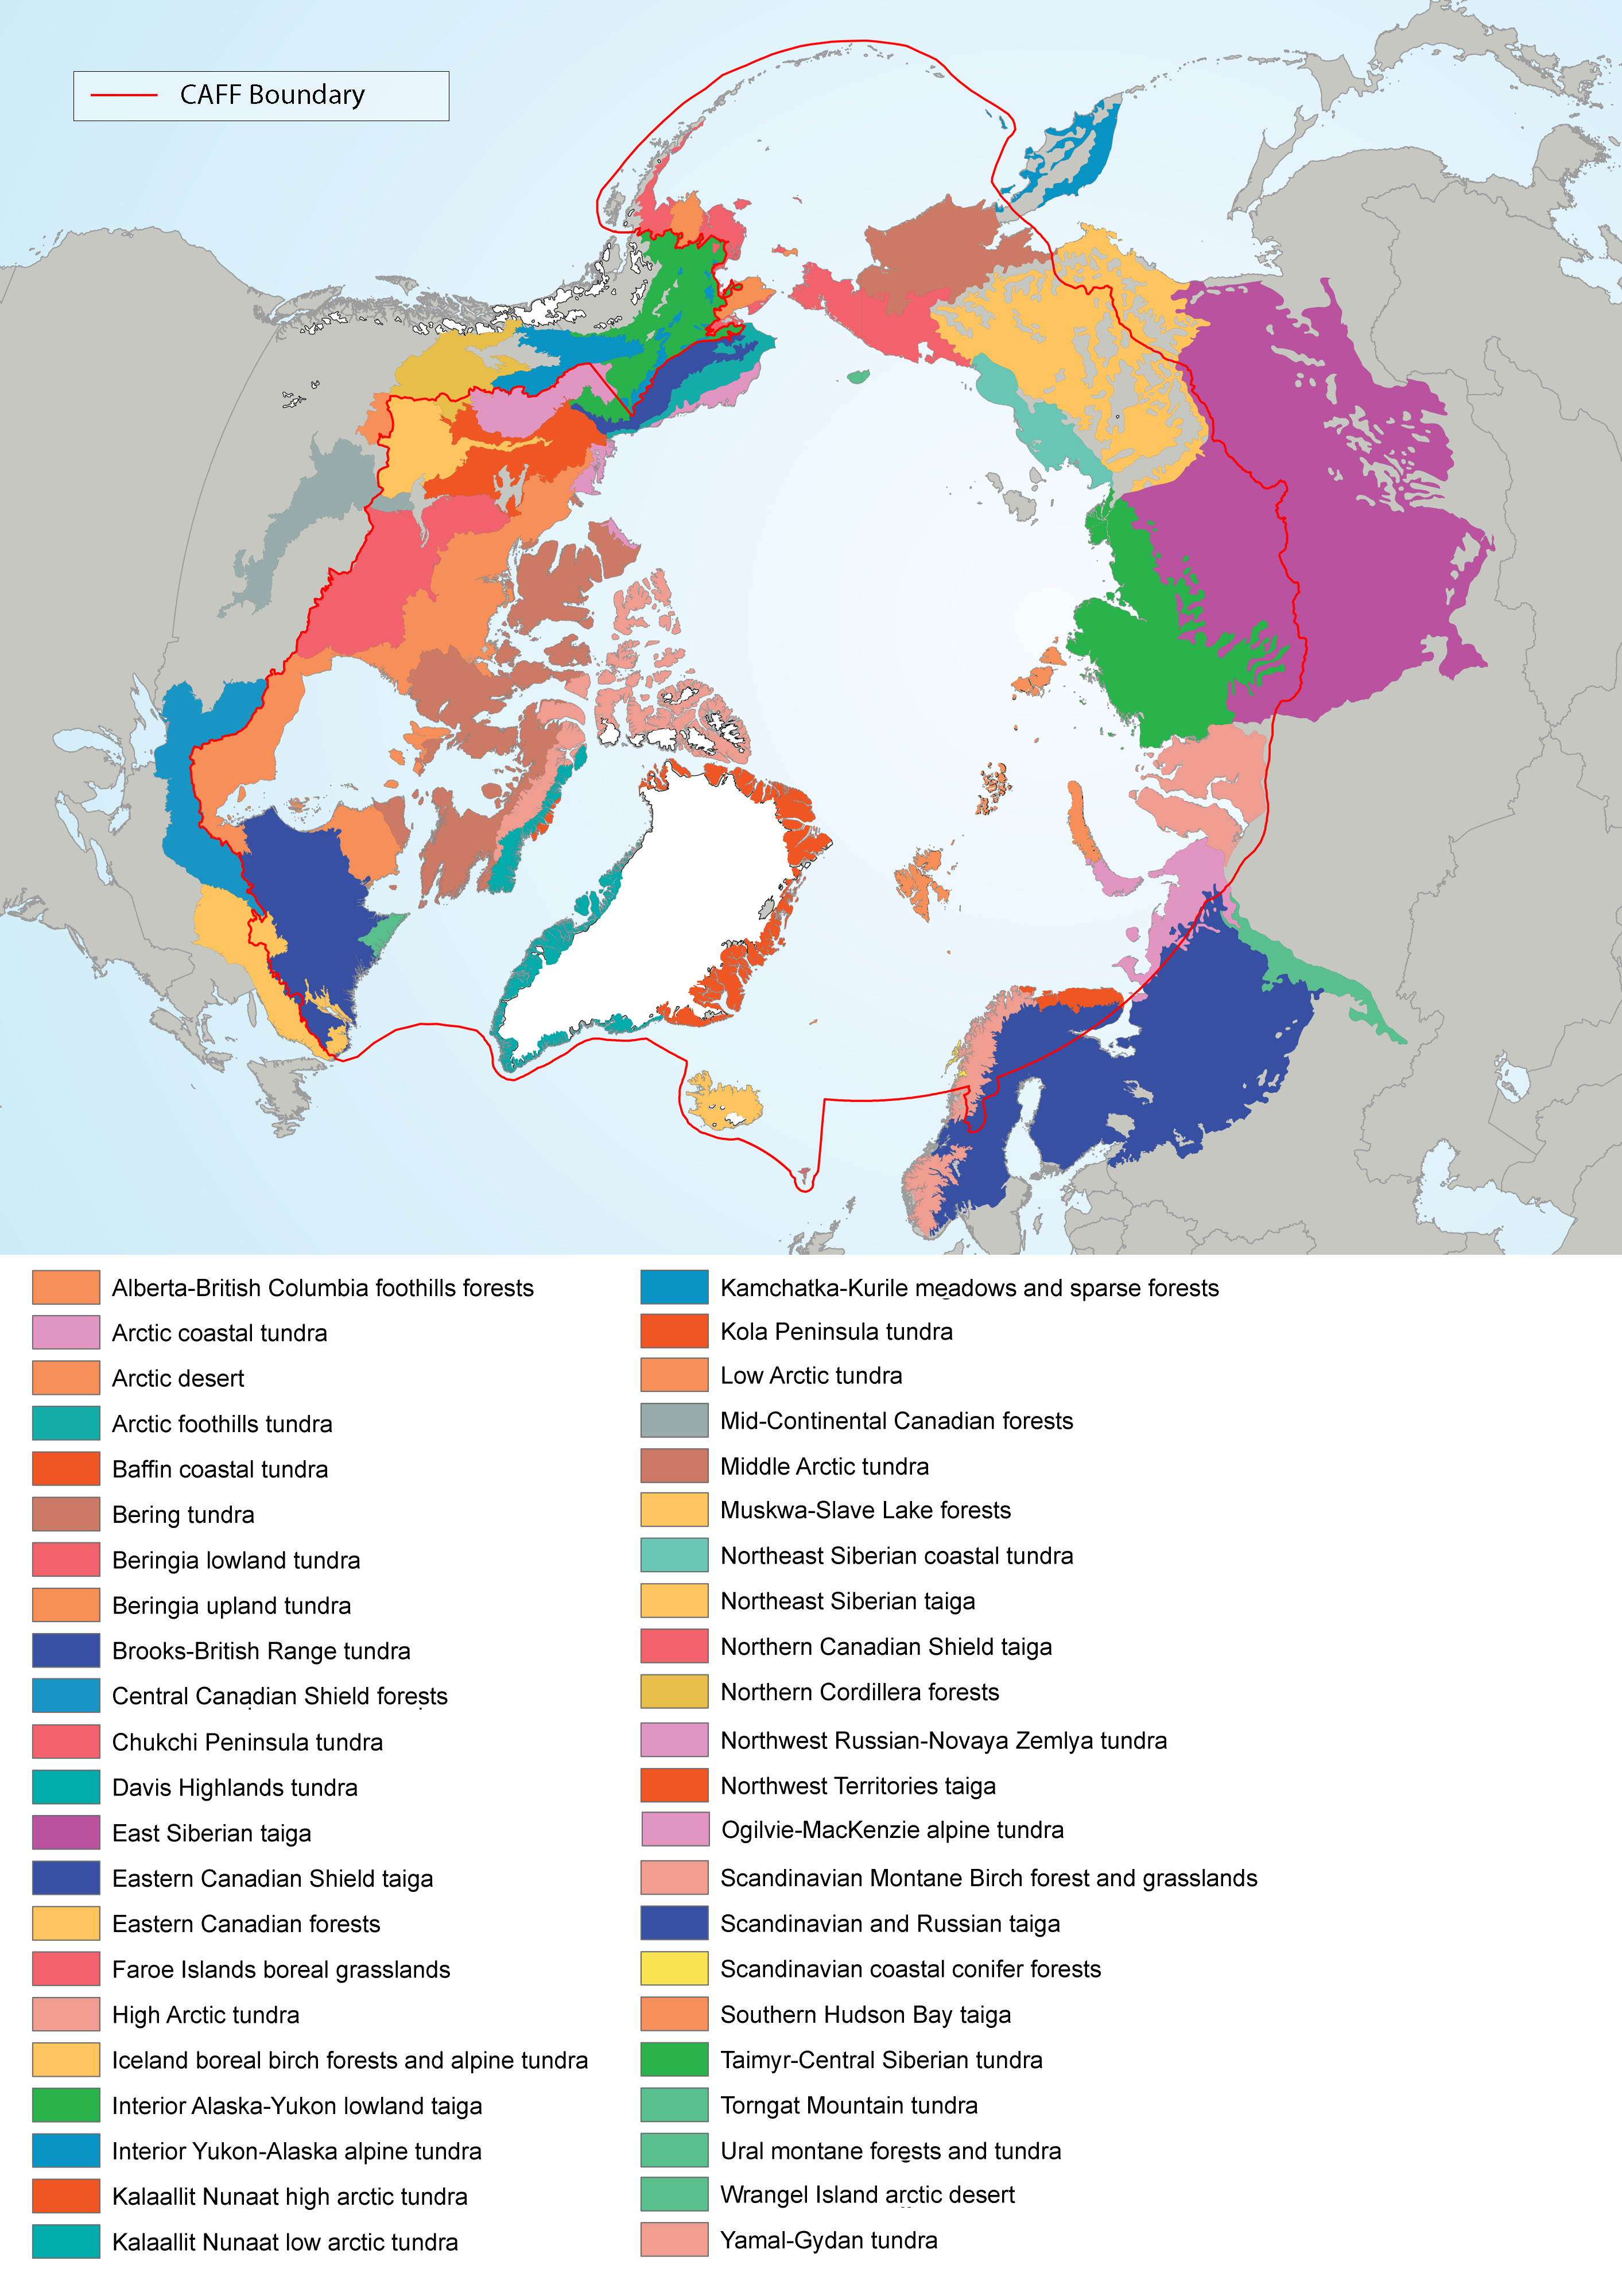
Figure 4-5 Terrestrial ecoregions that are included within the circumpolar region within the CAFF boundary and/or the ABA boundaries. Source: Terrestrial Ecoregions of the World (TEOW; Olson et al. 2001). State of the Arctic Freshwater Biodiversity Report - Chapter 4 - Page 28 - Figure 4-5
-
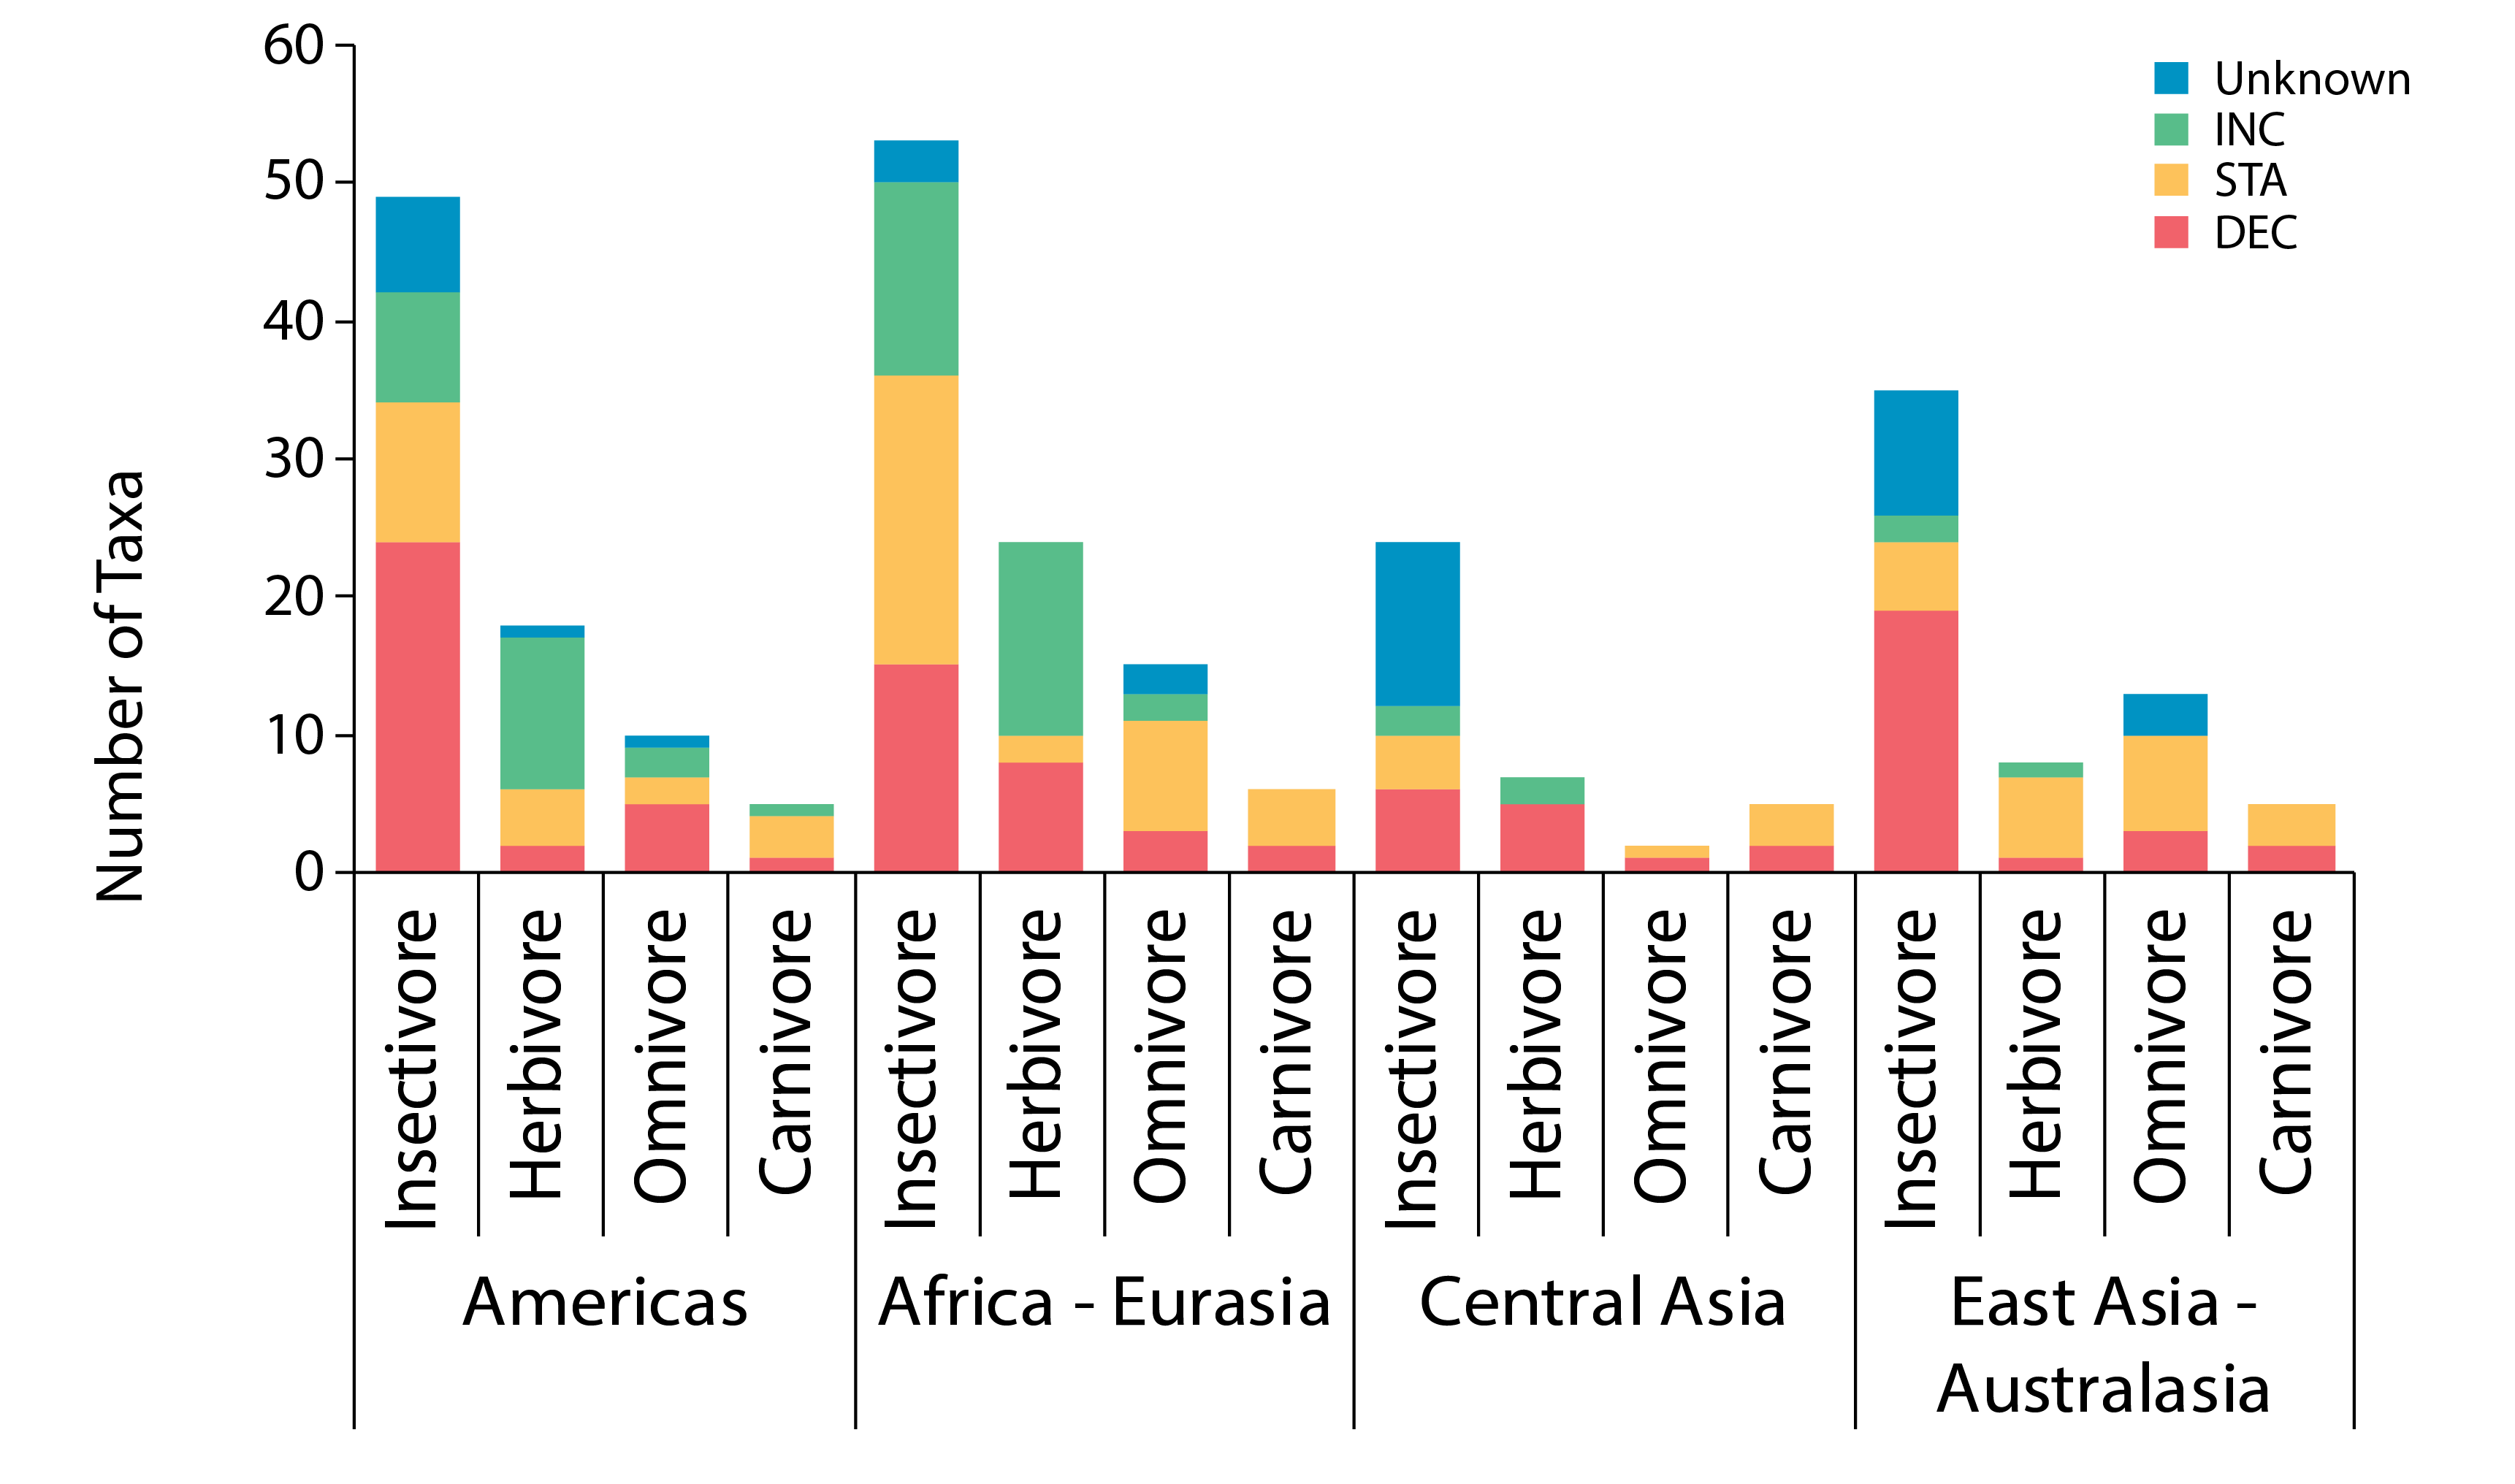
Regional differences are more pronounced in the insectivore guild (Figure 3-24). Although diversity of waders was moderate in the East Asian–Australasian Flyway, 88% (15 of 17) of taxa with known trends were declining—the largest proportion of any group. Both short-term (the last 15 years) and long-term (more than 30 years) trends were available for 157 taxa. Trends were unchanged over the two time periods for 80% of taxa, improved for 11% and worsened for 9%.. STATE OF THE ARCTIC TERRESTRIAL BIODIVERSITY REPORT - Chapter 3 - Page 56 - Figure 3.24
-
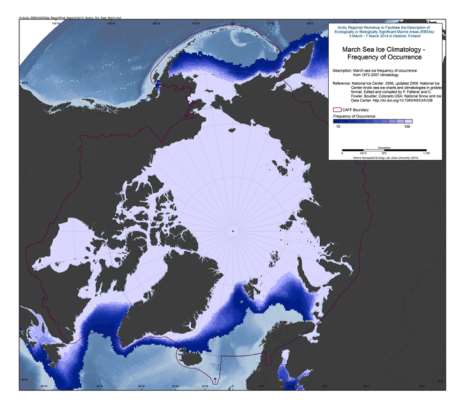
The U.S. National Ice Center (NIC) is an inter-agency sea ice analysis and forecasting center comprised of the Department of Commerce/NOAA, the Department of Defense/U.S. Navy, and the Department of Homeland Security/U.S. Coast Guard components. Since 1972, NIC has produced Arctic and Antarctic sea ice charts. This data set is comprised of Arctic sea ice concentration climatology derived from the NIC weekly or biweekly operational ice-chart time series. The charts used in the climatology are from 1972 through 2007; and the monthly climatology products are median, maximum, minimum, first quartile, and third quartile concentrations, as well as frequency of occurrence of ice at any concentration for the entire period of record as well as for 10-year and 5-year periods. NIC charts are produced through the analyses of available in situ, remote sensing, and model data sources. They are generated primarily for mission planning and safety of navigation. NIC charts generally show more ice than do passive microwave derived sea ice concentrations, particularly in the summer when passive microwave algorithms tend to underestimate ice concentration. The record of sea ice concentration from the NIC series is believed to be more accurate than that from passive microwave sensors, especially from the mid-1990s on (see references at the end of this documentation), but it lacks the consistency of some passive microwave time series. Source: <a href="http://nsidc.org/data/G02172" target="_blank">NSIDC</a> Reference: National Ice Center. 2006, updated 2009. National Ice Center Arctic sea ice charts and climatologies in gridded format. Edited and compiled by F. Fetterer and C. Fowler. Boulder, Colorado USA: National Snow and Ice Data Center. Source: <a href="http://nsidc.org/data/G02172" target="_blank">NSIDC</a>
-
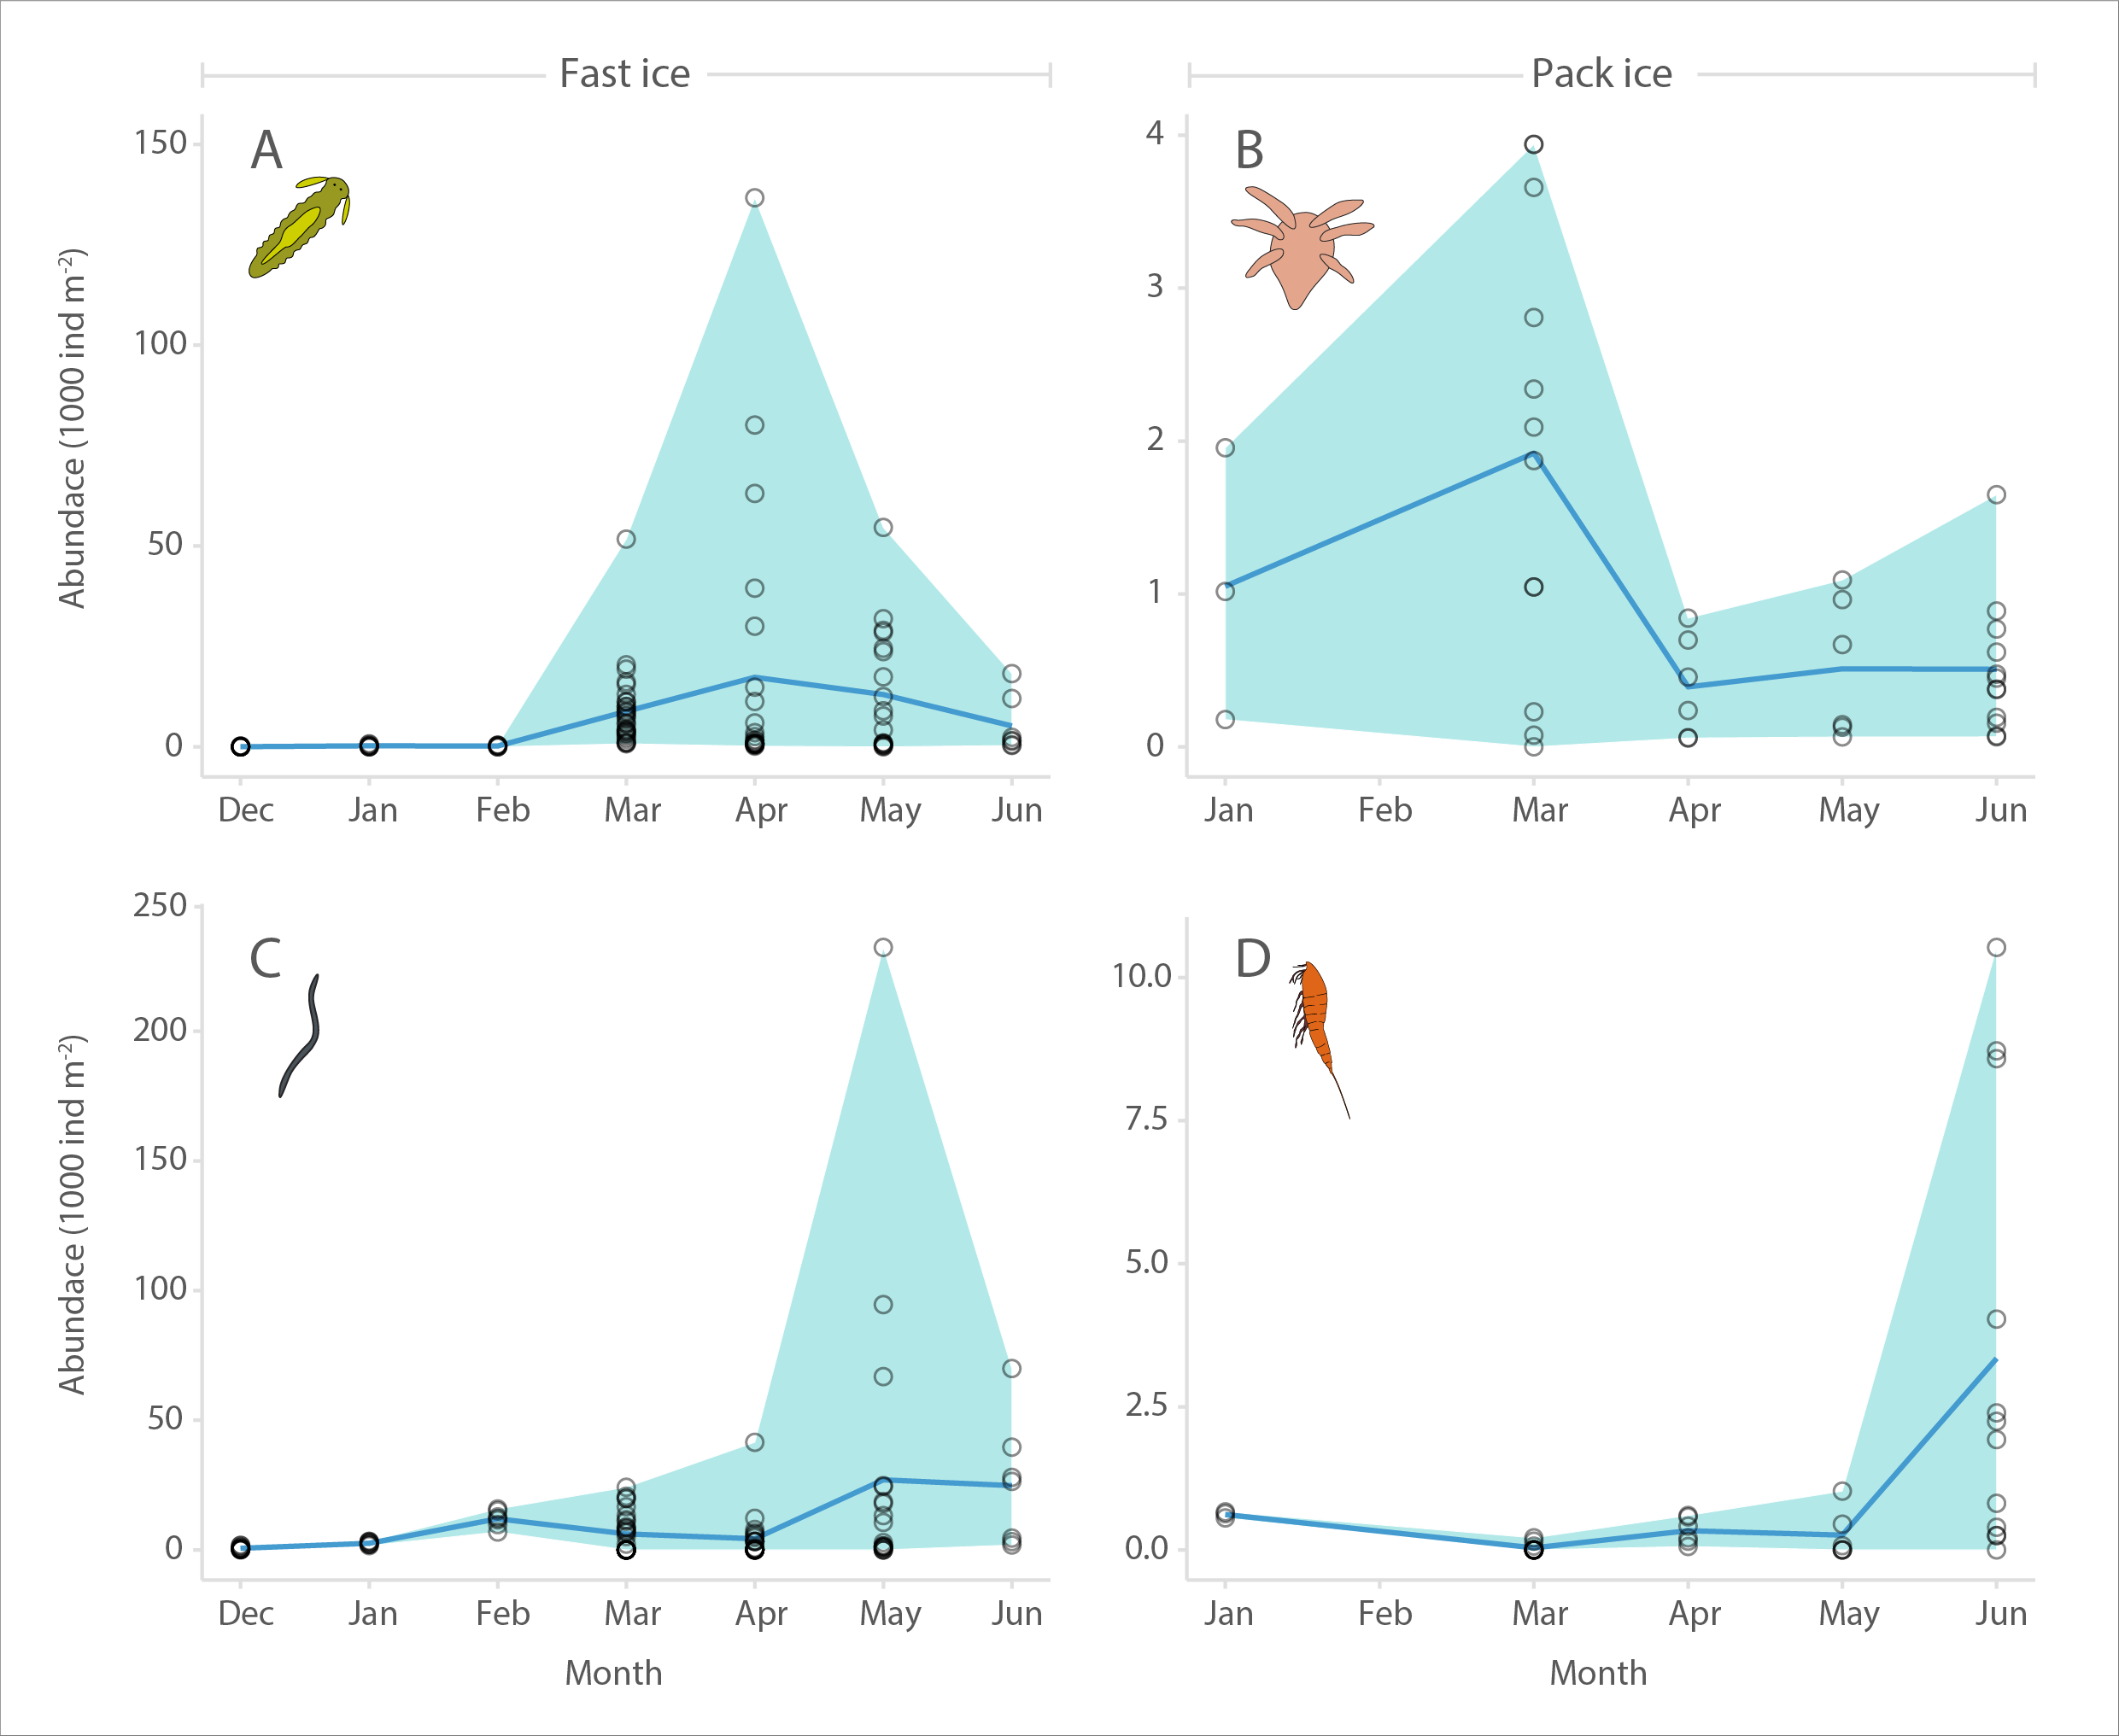
Seasonal abundance (1000 individuals m- 2) of sea ice meiofauna at landfast sea ice (Barrow, 2005-2006, A and C) and pack ice (North of Svalbard, 2015, B and D). A and B show larval stages (polychaete juveniles and nauplii, respectively), while C and D show nematodes and harpacticoid copepods, respectively. Circles represent individual cores (n = 107 for A and C, and 39 for B and D), shading the extent of minimum as well as maximum values, and blue line indicates mean values. STATE OF THE ARCTIC MARINE BIODIVERSITY REPORT - <a href="https://arcticbiodiversity.is/findings/sea-ice-biota" target="_blank">Chapter 3</a> - Page 43 - Figure 3.1.5 From the report draft: "In addition to showing composition and peak abundance ranges, we illustrate the phenology of ice meiofauna over the ice-covered season in the entire combined data set. For this purpose, the data were normalized to the daylight hours at each location during the date of sampling using R package geosphere (Hijmans 2015) and a method described in Forsythe et al. (1995). This was necessary, because ‘spring’ arrives earlier at lower latitudes than at higher latitudes, so that using month or day of year would obscure the pan-Arctic integration of the data. Other influential factors such as snow depth, ice thickness and nutrient concentrations were not accounted for in this analysis."
-
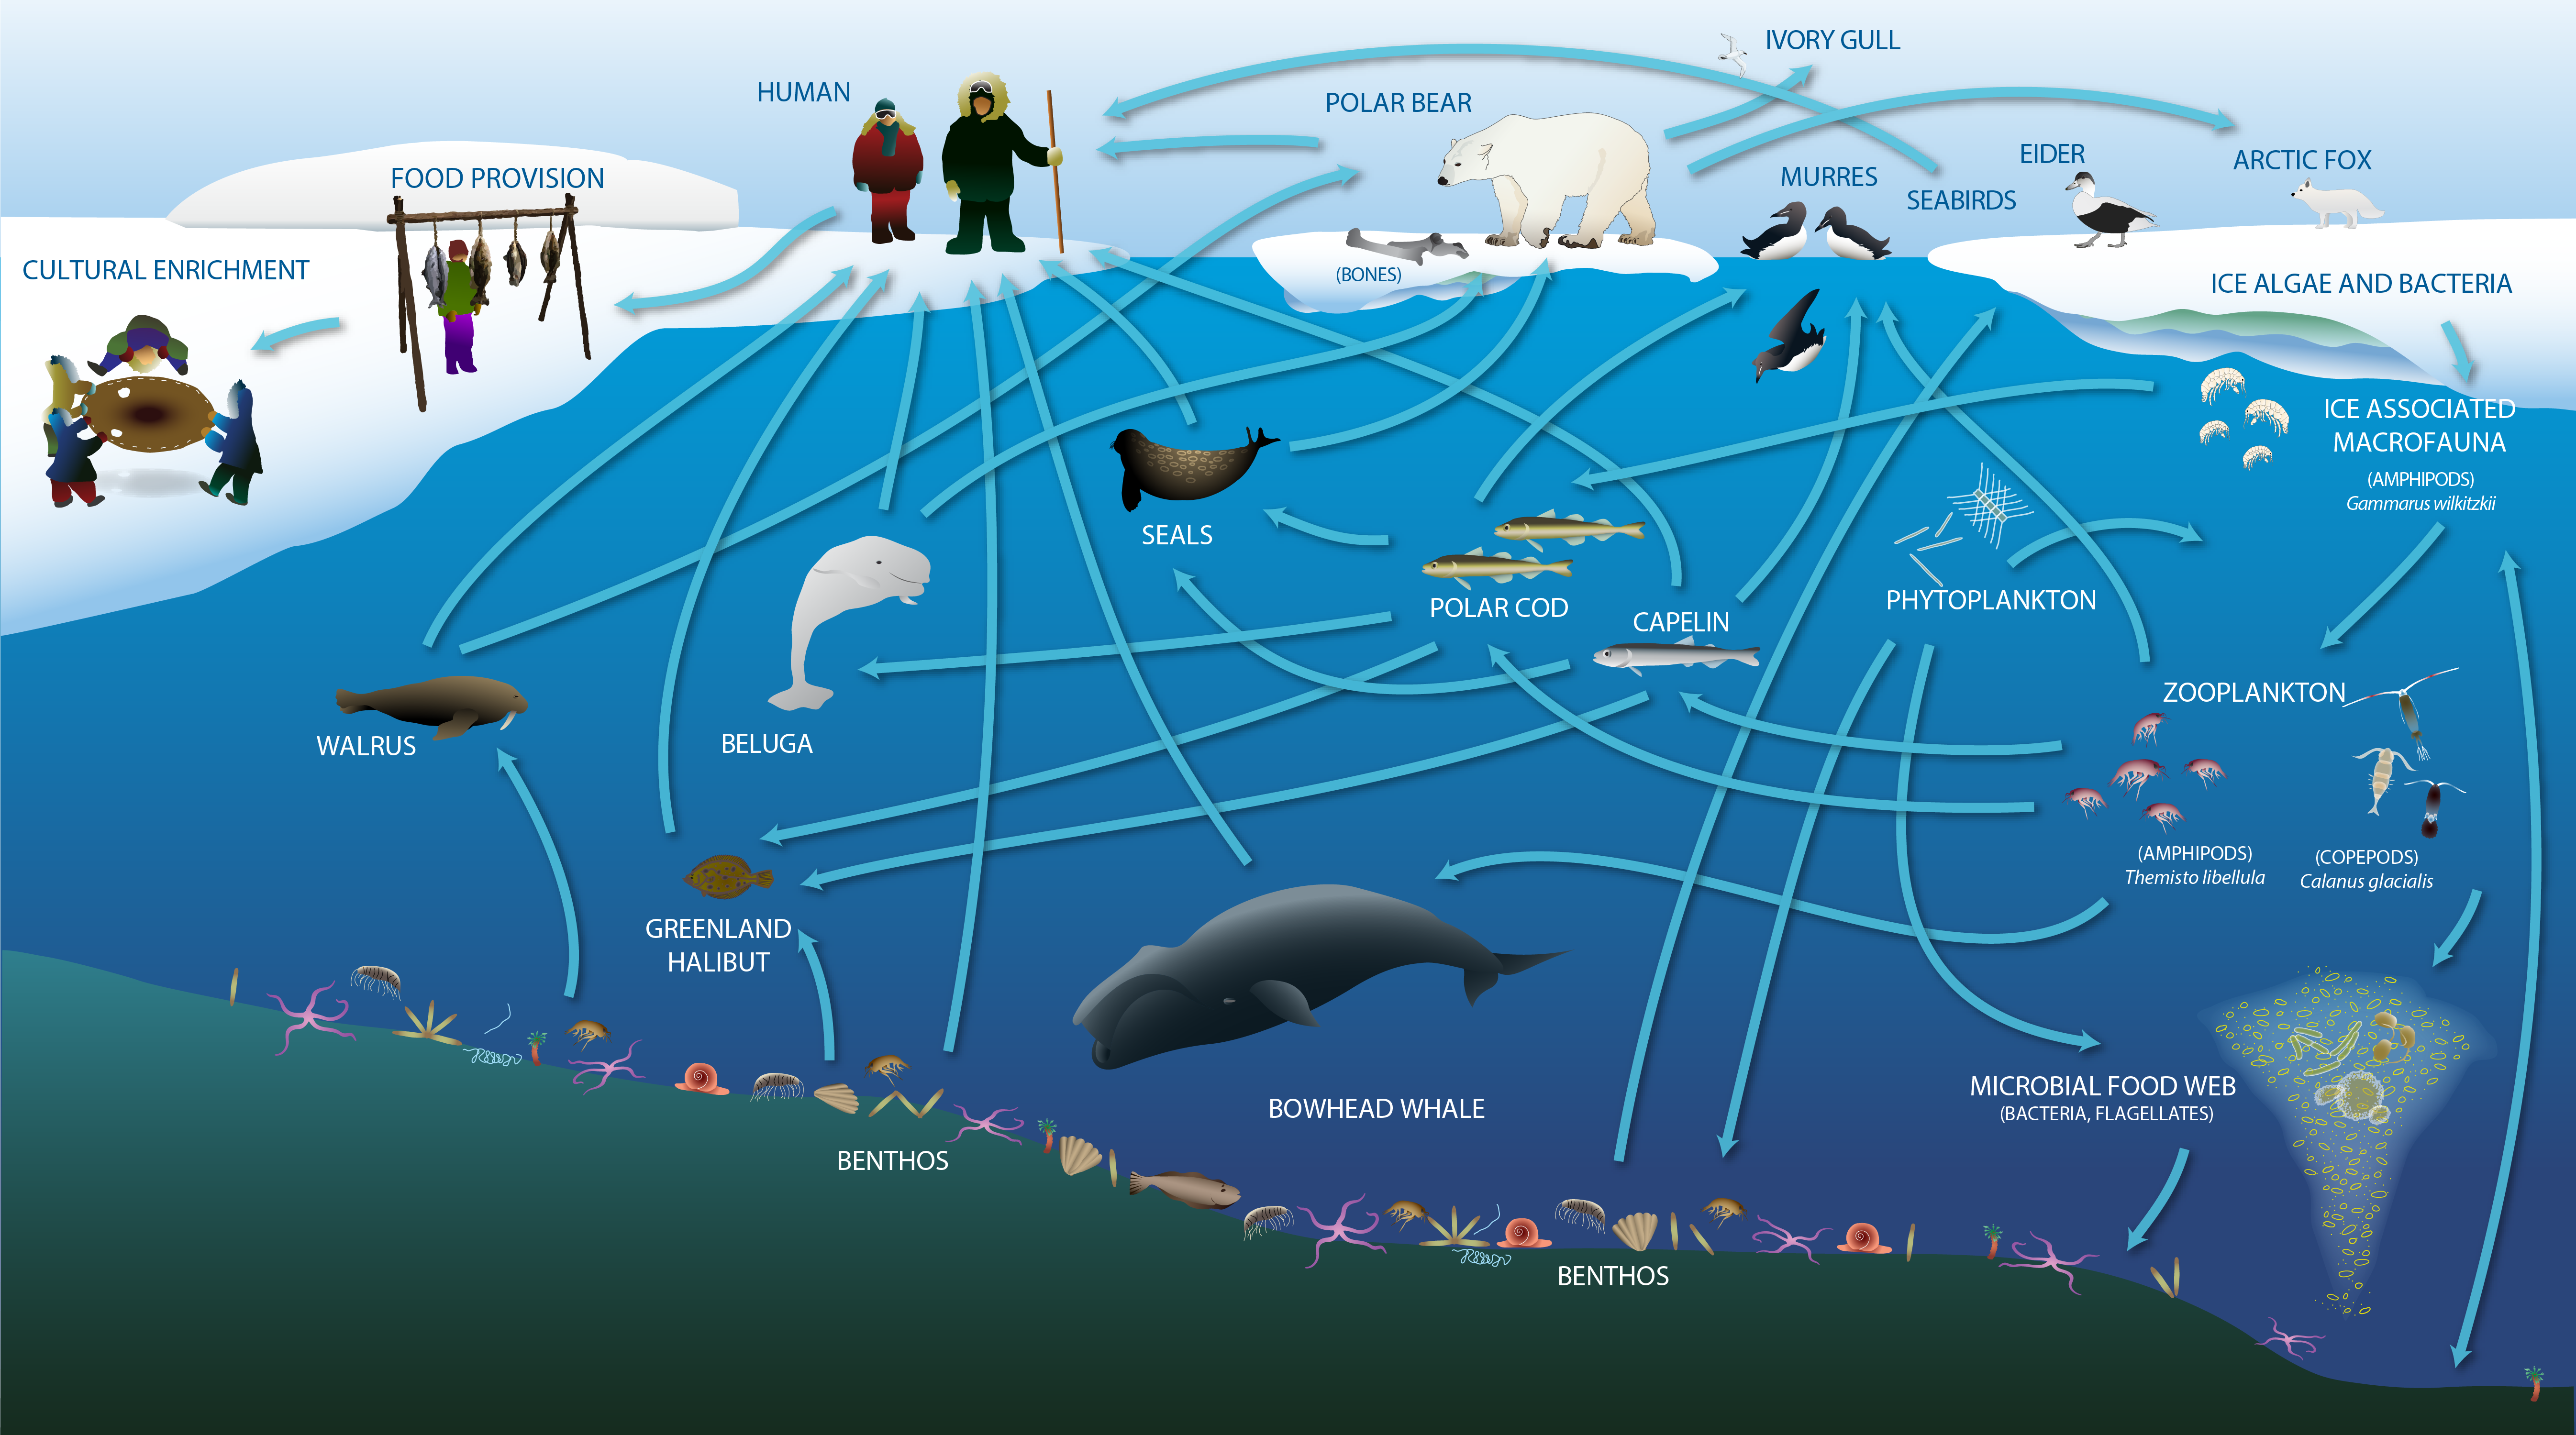
The Arctic marine food web includes the exchange of energy and nutrition, and also provides cultural, social and spiritual meaning for human communities. Adapted from Darnis et al. (2012) and Inuit Circumpolar Council-Alaska (2015). STATE OF THE ARCTIC MARINE BIODIVERSITY REPORT - <a href="https://arcticbiodiversity.is/marine" target="_blank">Chapter 2</a> - Page 23 - Figure 2.2a