 CAFF - Arctic Biodiversity Data Service (ABDS)
Conservation of Arctic Flora and Fauna (CAFF)
Type of resources
Available actions
Topics
Keywords
Contact for the resource
Provided by
Years
Formats
Representation types
Update frequencies
status
Service types
Scale
-
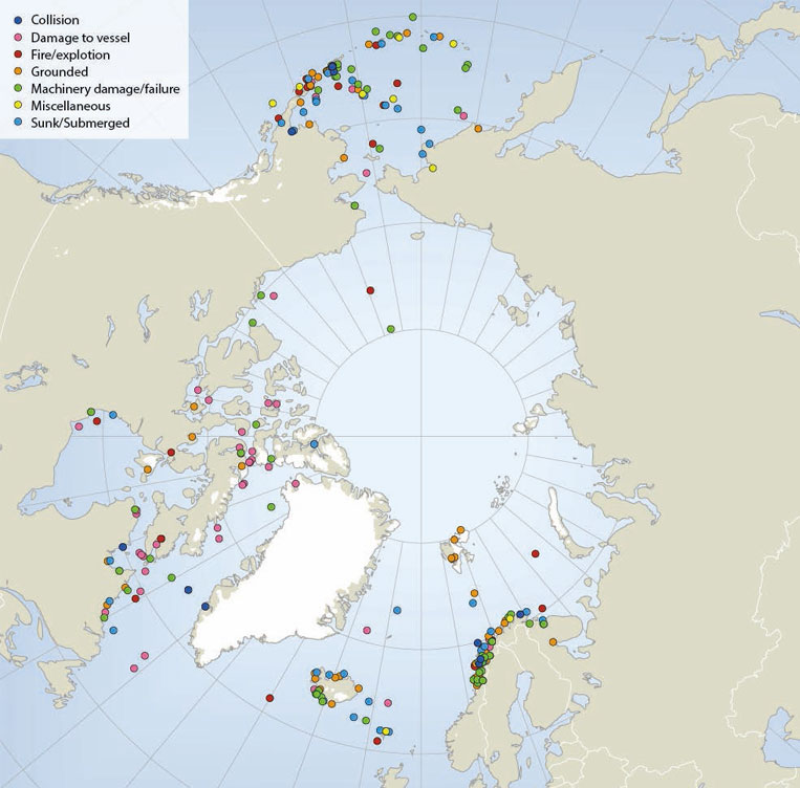
Locations of sub-Arctic and Arctic shipping accidents and incident causes, 1995-2004 (source: Arctic Marine Shipping Assessment 2009). Published in the Arctic Biodiversity Assessment (ABA) released in 2014.
-
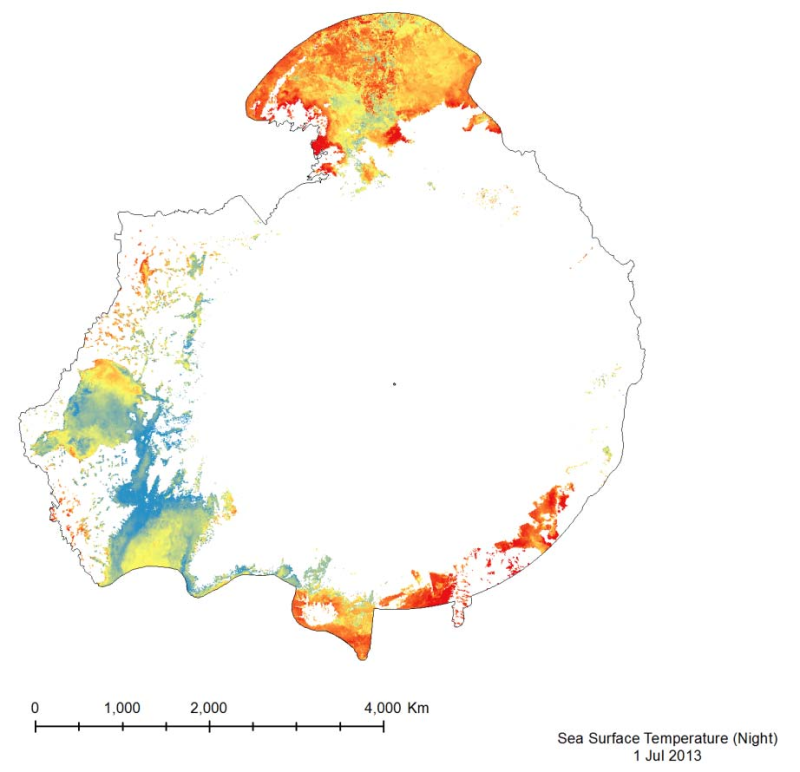
The MODIS Sea Surface Temperature (SST) product provided is a 4km spatialresolution monthly composite made from nighttime measurements from the Aqua Satellite.The nighttime measurements are used to collect a consistent temperature measurement that isunaffected by the warming of the top layer of water by the sun.
-
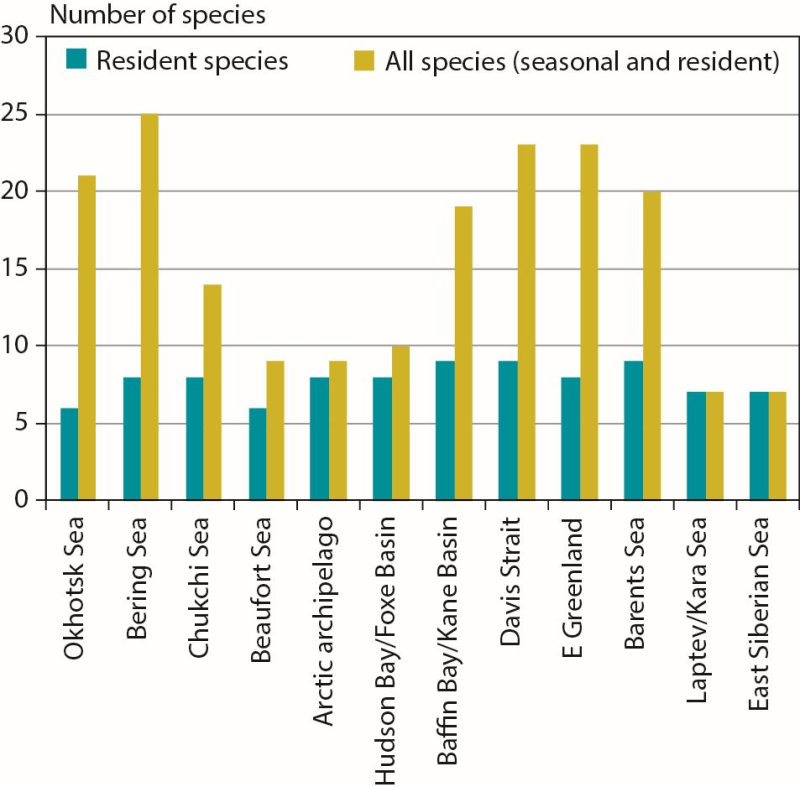
Number of marine mammal species in Arctic marine regions classified by resident species (n = 11 total) or all species (including seasonal visitors, n = 35 total). CAFF 2013. Arctic Biodiversity Assessment. Status and Trends in Arctic biodiversity. Conservation of Arctic Flora and Fauna, Akureyri - Mammal (Chapter 3) page 84
-
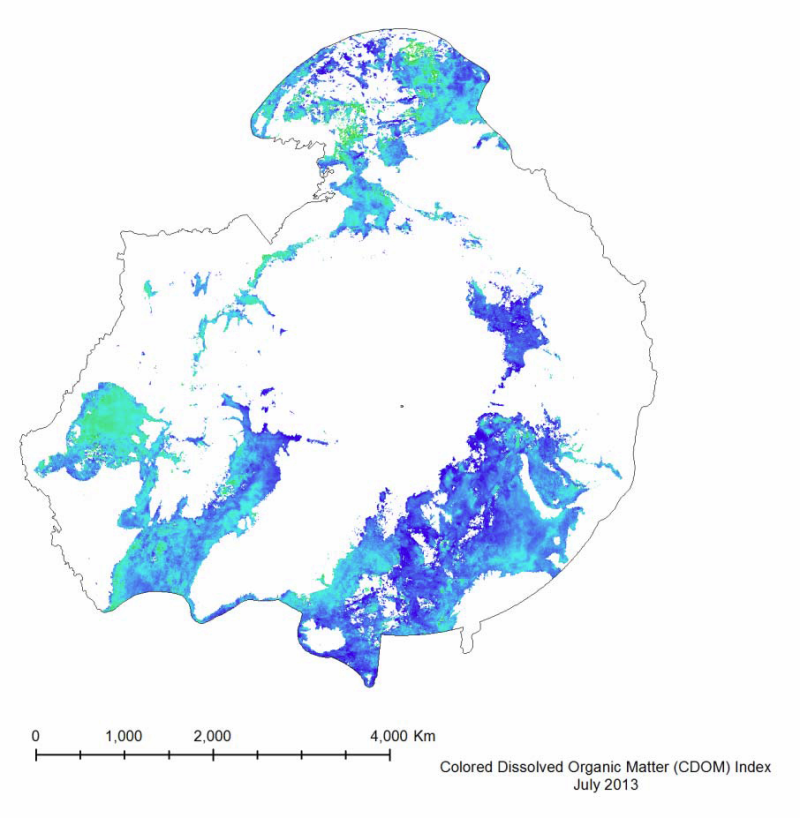
Colored Dissolved Organic Matter (CDOM) is a measurement of the absorption of light in the UV and visible spectrum by the colored components of dissolved organic carbon. It is essentially the yellow substance in water as a result of decaying detritus. It is important to measure because it limits the amount of sunlight penetration, and thus restricts the growth of plankton populations. It is measured in a unit-less CDOM index. Data generated as part of CAFFs Circumpolar Biodiversity Monitoring Program (CAFF) and its Land Cover Change Initiative (LCC) Trends visible in the MODIS dataset show an overall decrease in the mean CDOM from 2003 to 2012, with a percent change of -31.7%. This trend can be seen in Figure 40. This decrease corresponds to the increase in total yearly primary productivity (Figure 30), as a decrease in the CDOM allows for sunlight to penetrate deeper into the water, boosting chlorophyll concentrations and thus primary productivity.
-
Extensive oil and gas activity has occurred in the Arctic, primarily land-based, with Russia extracting 80% of the oil and 99% of the gas to date (AMAP 2008). Furthermore, the Arctic still contains large petroleum hydrocarbon reserves and potentially holds one fifth of the world’s yet undiscovered resources, according to the US Geological Survey (USGS 2008) (Fig. 14.4). While much of the currently known Arctic oil and gas reserves are in Russia (75% of oil and 90% of gas; AMAP 2008), more than half of the estimated undiscovered Arctic oil reserves are in Alaska (offshore and onshore), the Amerasian Basin (offshore north of the Beaufort Sea) and in W and E Greenland (offshore). More than 70% of the Arctic undiscovered natural gas is estimated to be located in the W Siberian Basin (Yamal Peninsula and offshore in the Kara Sea), the E Barents Basin and in Alaska (offshore and onshore) (AMSA 2009). Associated with future exploration and development, each of these regions would require vastly expanded Arctic marine operations, and several regions such as offshore Greenland would require fully developed Arctic marine transport systems to carry hydrocarbons to global markets. In this context, regions of high interest for economic development face cumulative environmental pressure from anthropogenic activities such as hydrocarbon exploitation locally, together with global changes associated with climatic and oceanographic trends. Conservation of Arctic Flora and Fauna, CAFF 2013 - Akureyri . Arctic Biodiversity Assessment. Status and Trends in Arctic biodiversity. - Marine ecosystems (Chapter 14 - page 501). Figure adapted from the USGS
-
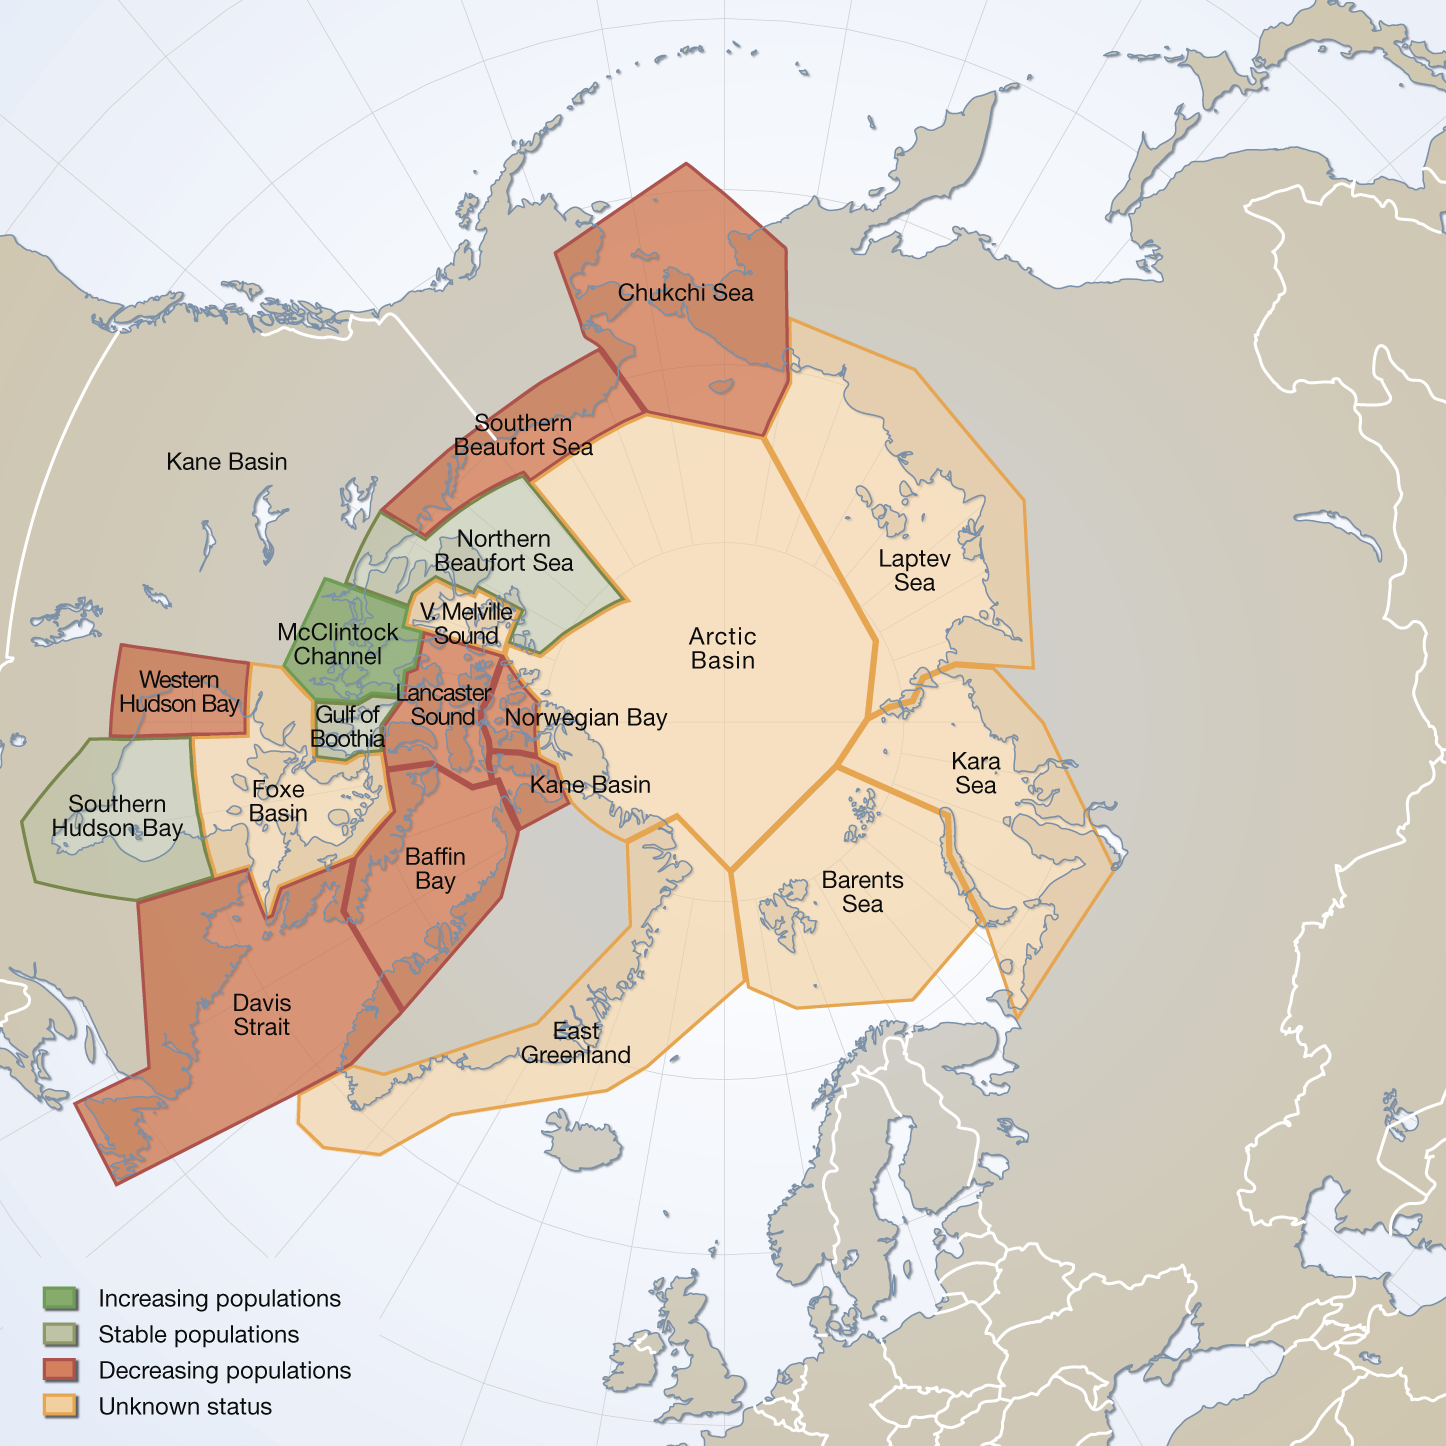
Circumpolar map of all polar bear subpopulation as recognized by the IUCN/Polar Bear Specialist Group in 2009 (PBSG 2010a). Total area covered = 24 mill. km(2). Vongraven, D and Peacock, E. Development of a pan-Arctic monitoring plan for polar bears:background paper. Published in the Arctic Biodiversity trends 2010, Indicator #01 - released in May 2010 Updated in feb.2025 with spatial data from 2022
-
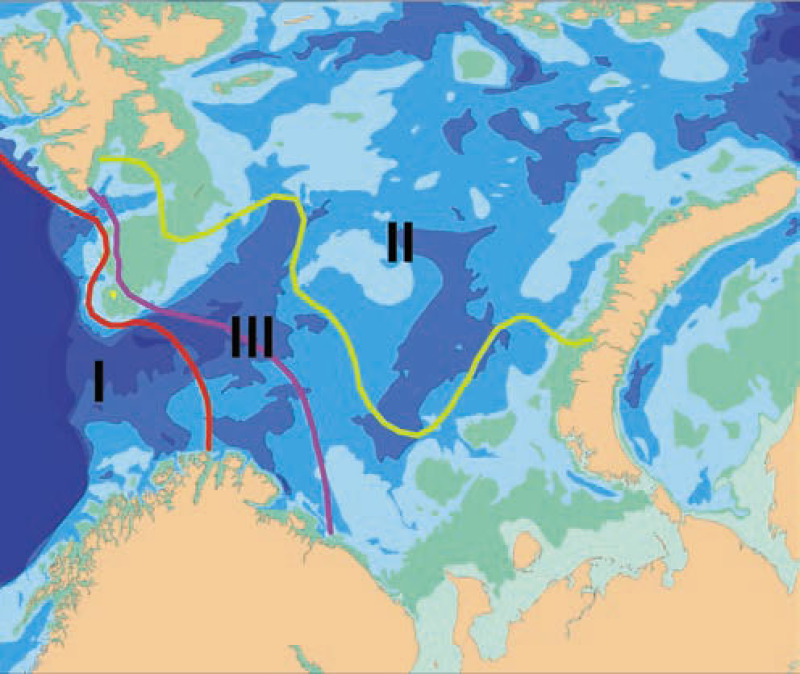
Biogeographic borders in the Barents Sea based on species distributions of bryozoans. Average position of the border with 50:50% of Atlantic boreal and Arctic species numbers is indicated by the pink line, and the red and green lines indicate the extreme positions of the border in cold and warm periods respectively. Area III between them is the transitional zone between the Atlantic boreal and the Arctic regions. Thus, area I always has > 50% Atlantic boreal species, and area II always > 50% Arctic species (after Denisenko 1990).
-
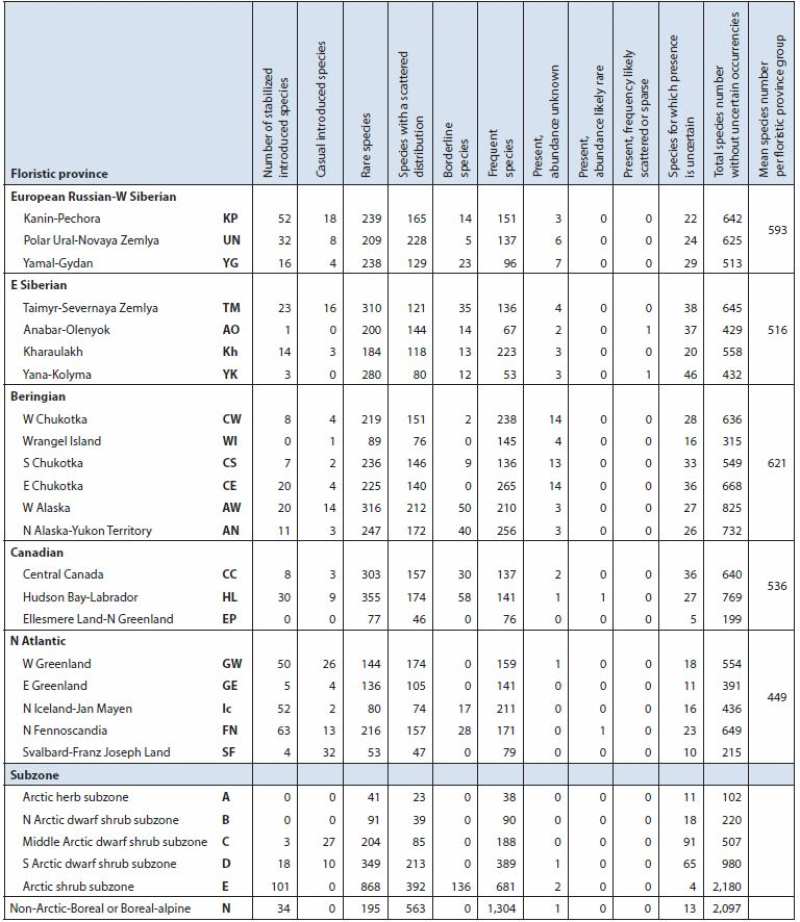
Summary of Arctic vascular plant species and distribution by Arctic flora province and subzone based on Elven (2007). Arctic floristic provinces, subzones (A-E), neighbouring boreal or boreal-alpine zone (N) and distribution derived from Elven (2007). Arctic Biodiversity Assessment - Table 9.1 Conservation of Arctic Flora and Fauna, CAFF 2013 - Akureyri . Arctic Biodiversity Assessment. Status and Trends in Arctic biodiversity. - Plants(Chapter 9) page 321
-
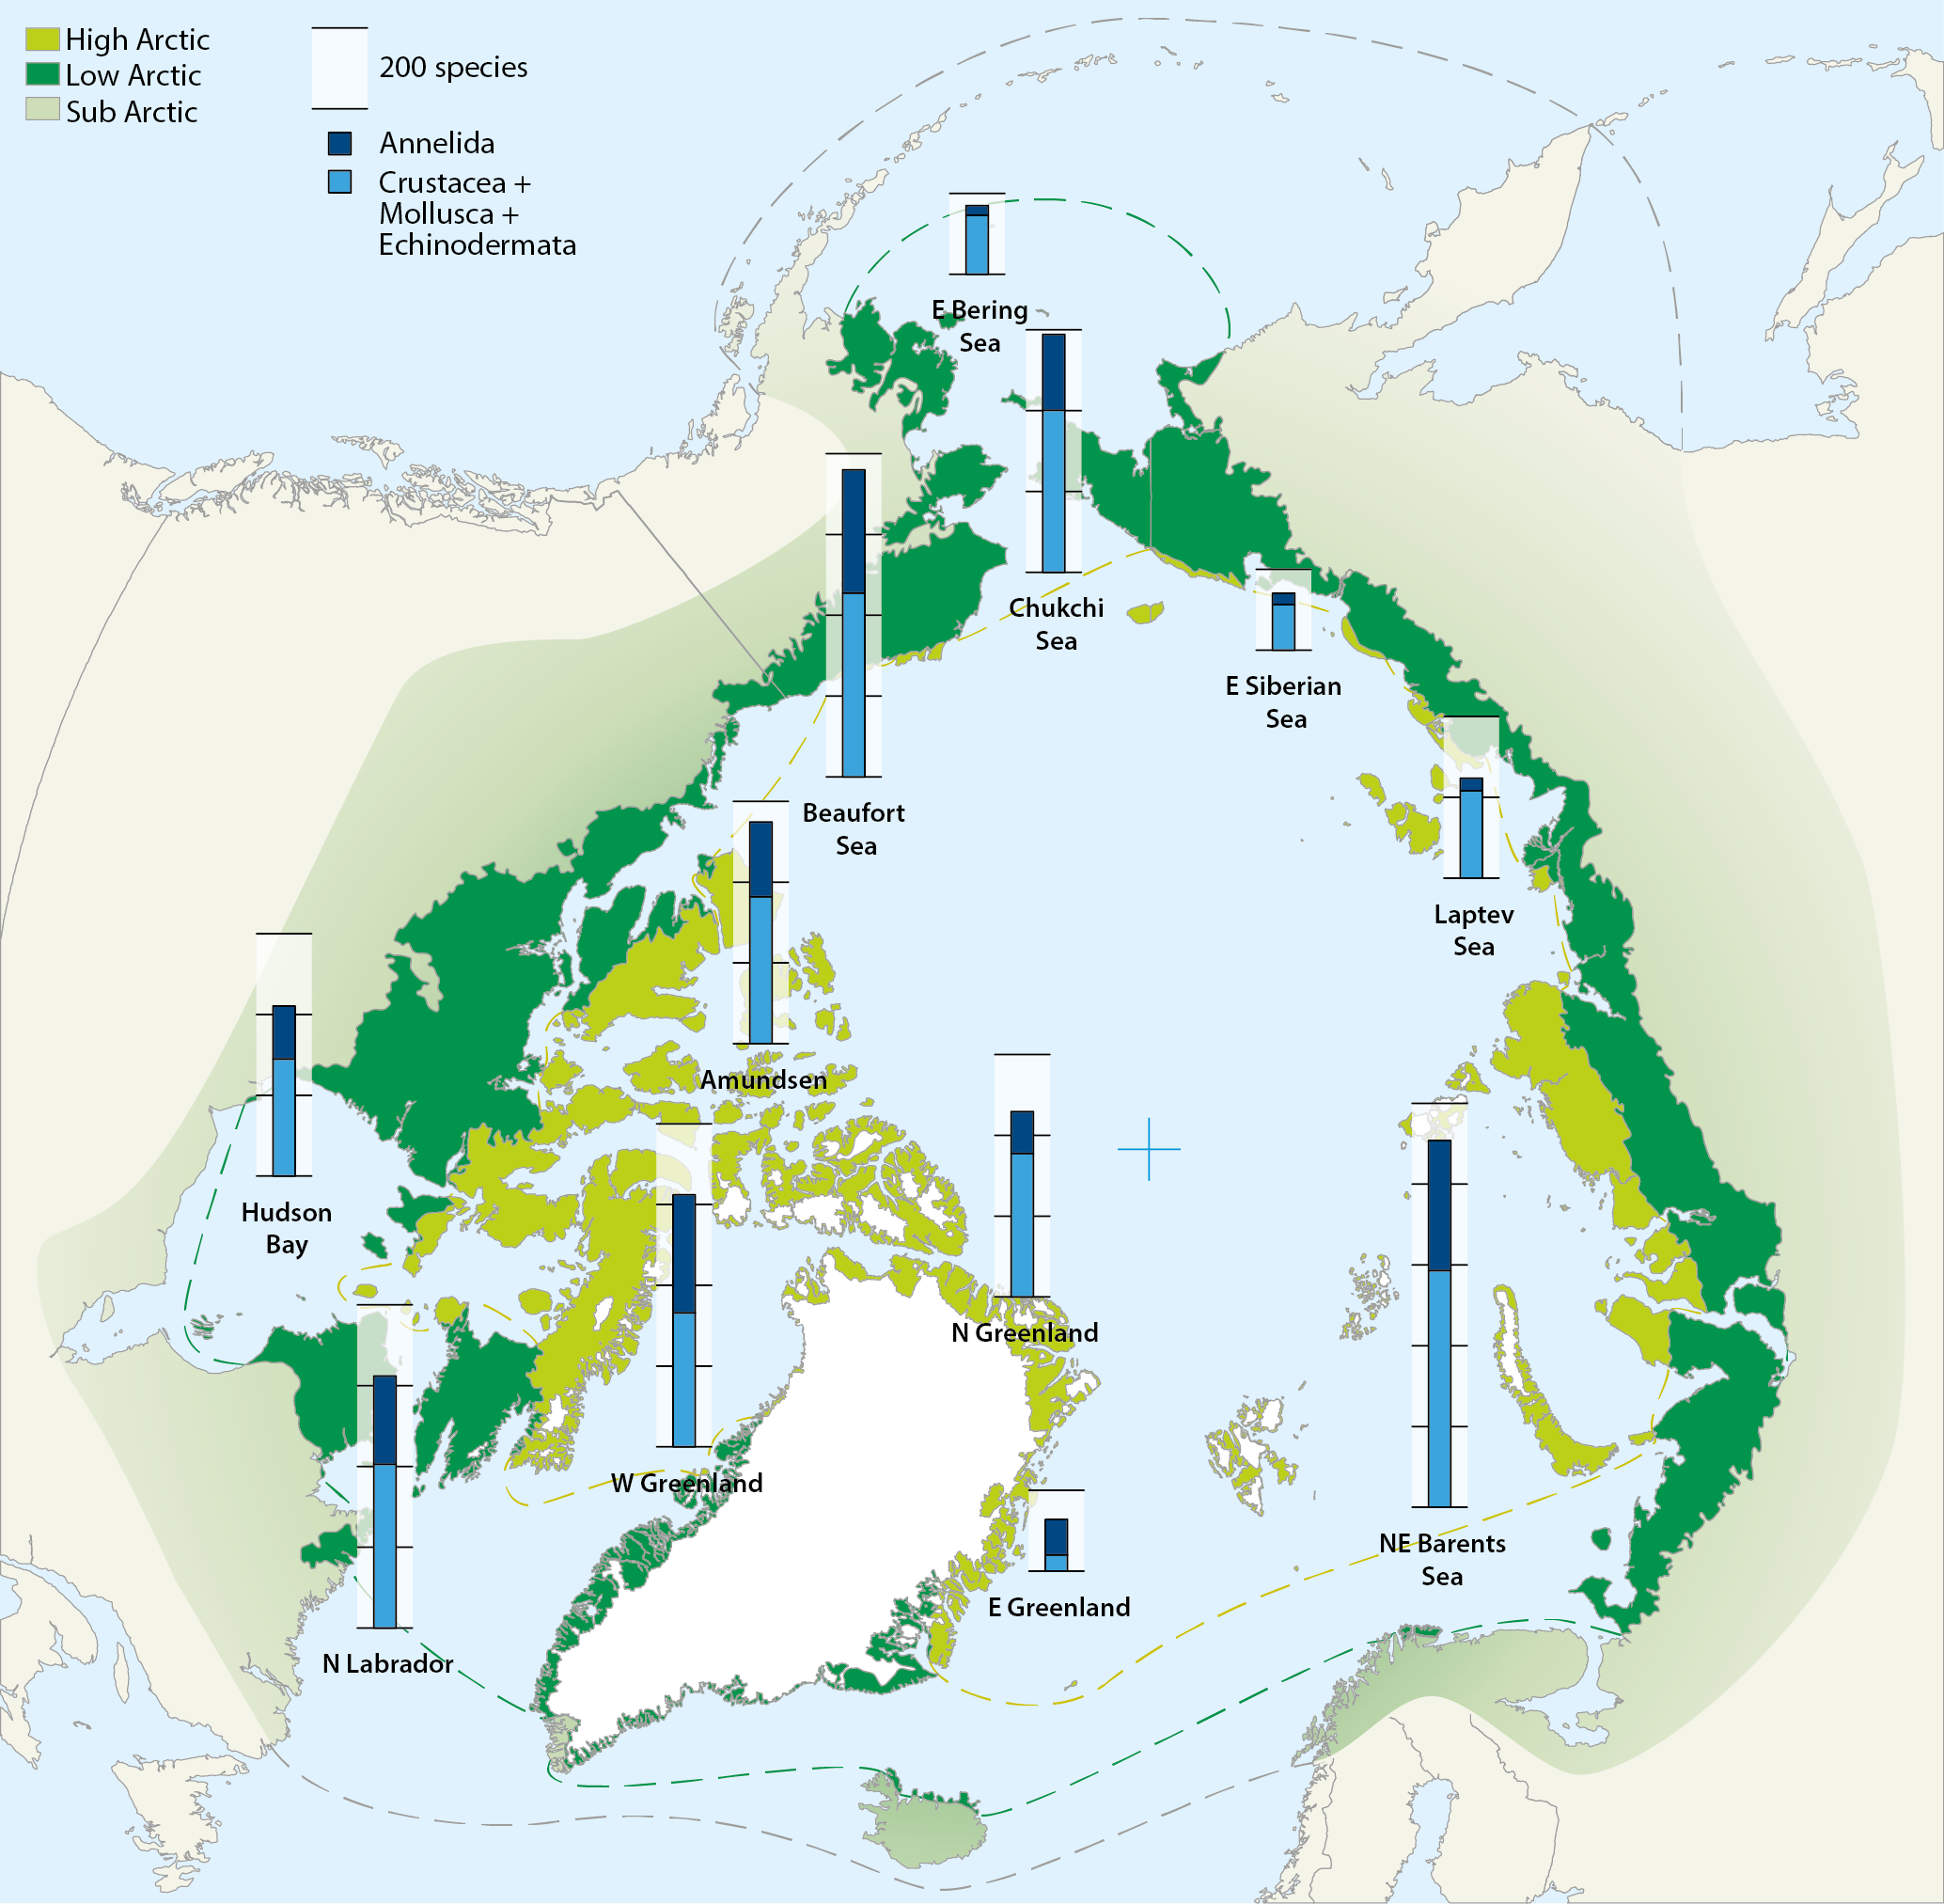
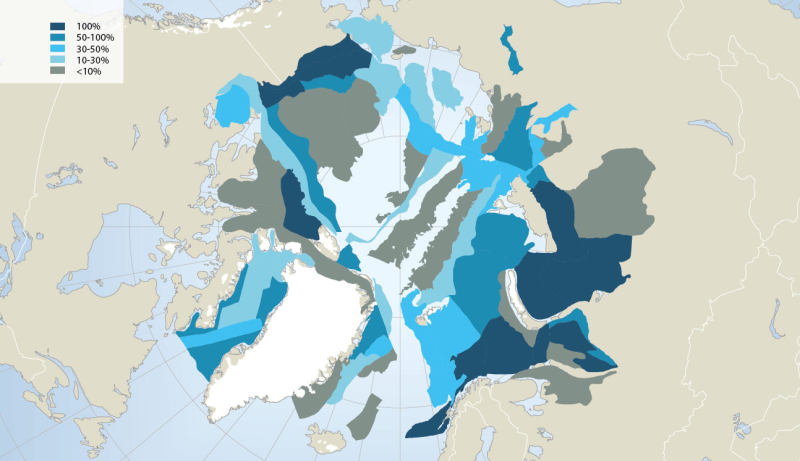
Map of the Arctic Ocean with superimposed stacked bars representing species numbers of macrozoobenthos from different shelf sea areas: Crustacea+Mollusca+Echinodermata (blue) and Annelida (black). Compiled by Piepenburg et al. (2011). Conservation of Arctic Flora and Fauna, CAFF 2013 - Akureyri . Arctic Biodiversity Assessment. Status and Trends in Arctic biodiversity. - Marine Invertebrates(Chapter 8) page 282
-
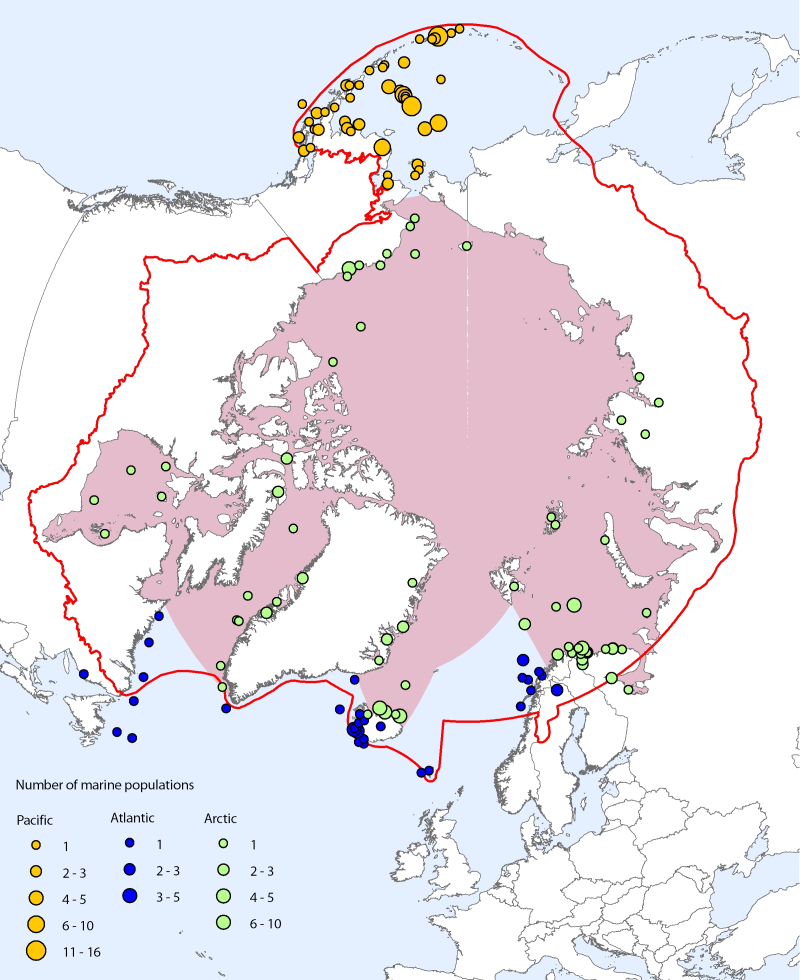
<img src="http://geo.abds.is/geonetwork/srv/eng//resources.get?uuid=59d822e4-56ce-453c-b98d-40207a2e9eec&fname=cbmp_small.png" alt="logo" height="67px" align="left" hspace="10px"> The Arctic marine data set contains a total of 111 species and 310 population time series from 170 locations. Species coverage is about 34% of Arctic marine vertebrate species (100% of mammals, 53% of birds, and 27% of fishes) (Bluhm et al. 2011). At the species level, even though the representation of Arctic fish species is lower than that of mammals and birds, the data are dominated by fishes, primarily from the Pacific Ocean (especially the Bering Sea and Aleutian Islands). However, there are more population time series in total for bird species, which is reflective of this group being both better studied historically and also monitored at many small study sites compared to fish and marine mammal species, which are regularly monitored at a much larger scale through stock management. Note that the time span selected for marine analyses is 1970 to 2005 (compared with 1970 to 2007 for the ASTI for all species). CAFF Assessment Series No. 7 April 2012 - <a href=http://caff.is/asti/asti-publications/28-arctic-species-trend-index-tracking-trends-in-arctic-marine-populations" target="_blank"> The Arctic Species Trend Index - Tracking trends in Arctic marine populations </a>