 CAFF - Arctic Biodiversity Data Service (ABDS)
Conservation of Arctic Flora and Fauna (CAFF)
Type of resources
Available actions
Topics
Keywords
Contact for the resource
Provided by
Years
Formats
Representation types
Update frequencies
status
Service types
Scale
-
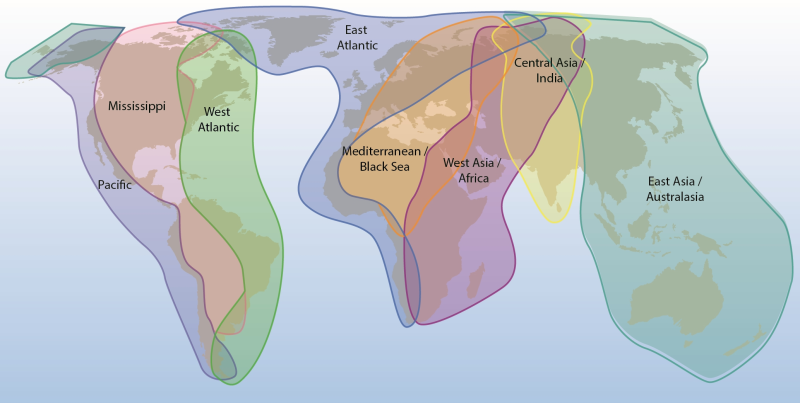
Arctic Biodiversity Assessment (ABA) 2013. Figure 4.2. Major flyways of Arctic birds. Bird migration links Arctic breeding areas to all other parts of the globe (adapted from ACIA 2005). Conservation of Arctic Flora and Fauna, CAFF 2013 - Akureyri . Arctic Biodiversity Assessment. Status and Trends in Arctic biodiversity. - Birds(Chapter 4) page 146
-
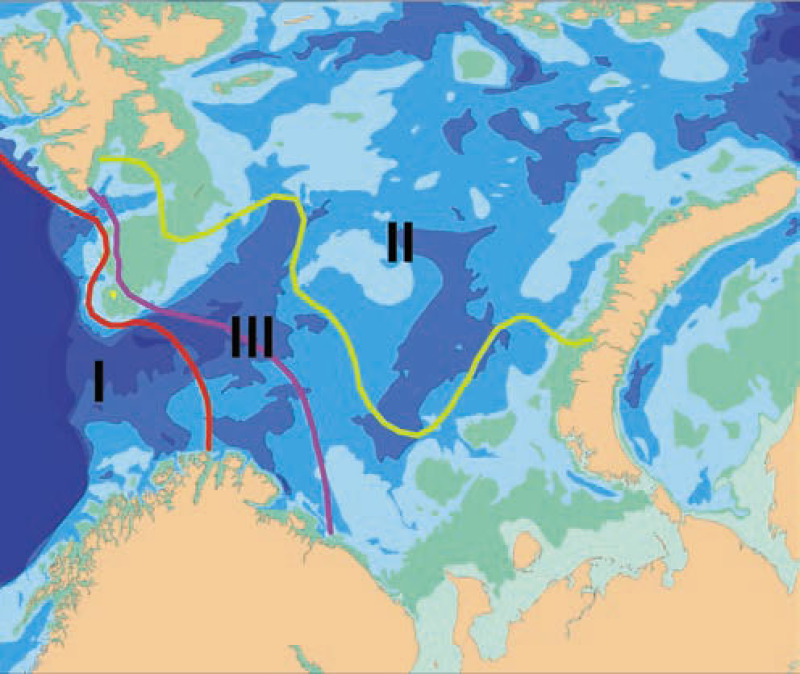
Biogeographic borders in the Barents Sea based on species distributions of bryozoans. Average position of the border with 50:50% of Atlantic boreal and Arctic species numbers is indicated by the pink line, and the red and green lines indicate the extreme positions of the border in cold and warm periods respectively. Area III between them is the transitional zone between the Atlantic boreal and the Arctic regions. Thus, area I always has > 50% Atlantic boreal species, and area II always > 50% Arctic species (after Denisenko 1990).
-
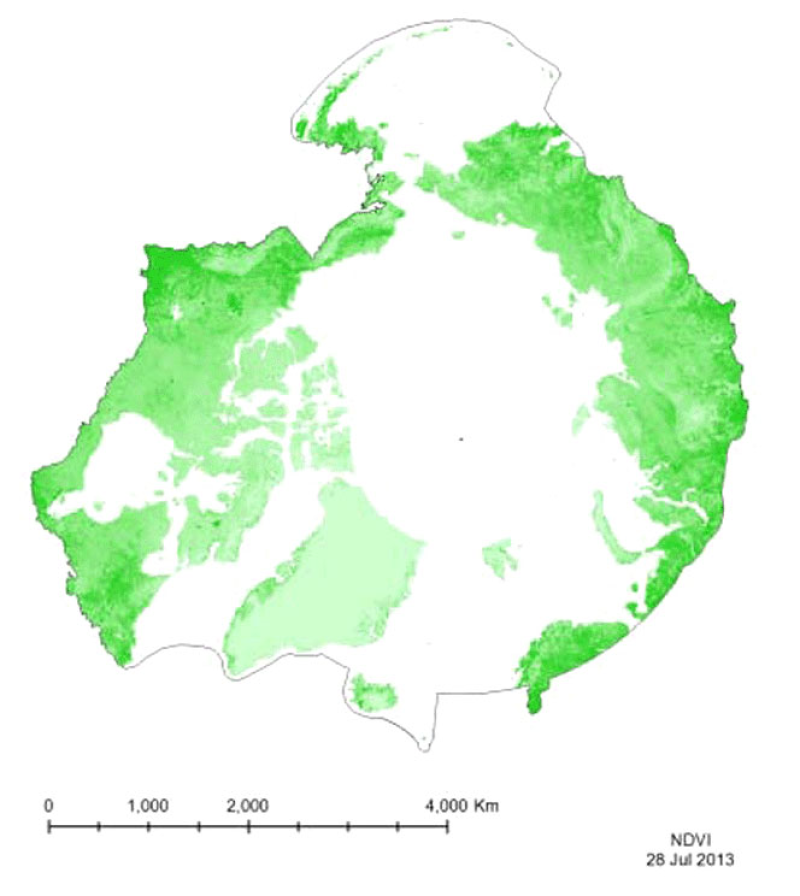
Vegetation indices quantify the concentrations of green leaf vegetation (chlorophyll)around the globe, in an attempt to monitor and correlate vegetation health and stress. The MODIS vegetation products include the Normalized Difference Vegetation Index (NDVI)and an Enhanced Vegetation Index (EVI). Included in the MOD13C1 product is both NDVIand EVI, so both have been provided for the CAFF Dedicated Pan-Arctic Satellite RemoteSensing Products and Distribution System. These indices come in a variety of resolutions,but MTRI has provided a monthly global composite on a 0.05° Climate Model GRID(CMG).
-
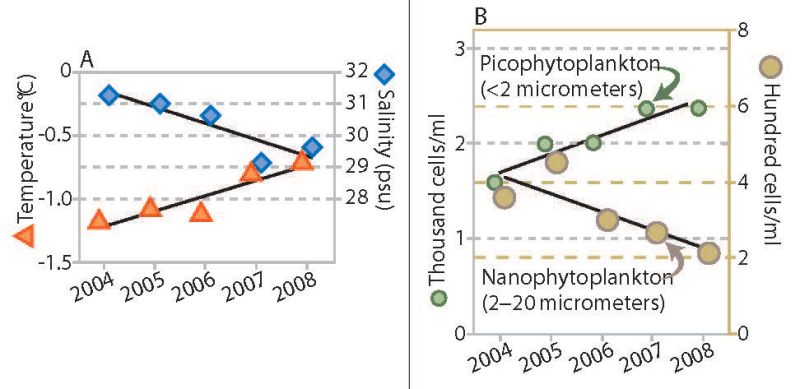
Trends in water temperature and salinity (A) and density of phytoplankton of two size ranges (B), Canada Basin, 2004 to 2008. Stratification of the water column increased throughout the Canada Basin over a recent five-year period, accompanied by a change in phytoplankton communities. The upper ocean layer showed trends of increased temperature and decreased salinity (Figure 18A), which combine to make this layer progressively less dense. The layer of water below this did not change in density over this period (not shown). The larger size class of phytoplankton (which would include diatoms) decreased in abundance, while the smaller types of plankton increased (Figure 18B). In addition to the trends shown, nutrient content in the upper ocean water layer decreased. Abundance of microbes (bacteria and similar organisms) that subsist on organic matter increased. Total phytoplankton biomass, however, remained unchanged. If this trend towards smaller species of phytoplankton and microbes is sustained, it may lead to reduced production of zooplankton, an impact that would be transmitted through the food web to birds, fish and mammals. Published in the Life Linked to Ice released in 2013, page 30. Life Linked to Ice: A guide to sea-ice-associated biodiversity in this time of rapid change. CAFF Assessment Series No. 10. Conservation of Arctic Flora and Fauna, Iceland. ISBN: 978-9935-431-25-7.
-
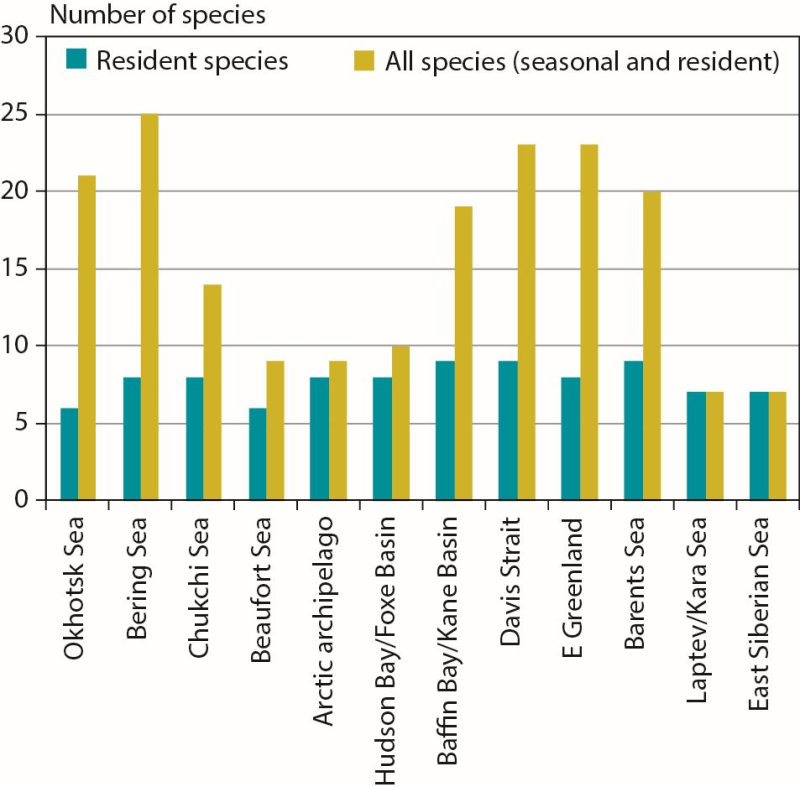
Number of marine mammal species in Arctic marine regions classified by resident species (n = 11 total) or all species (including seasonal visitors, n = 35 total). CAFF 2013. Arctic Biodiversity Assessment. Status and Trends in Arctic biodiversity. Conservation of Arctic Flora and Fauna, Akureyri - Mammal (Chapter 3) page 84
-
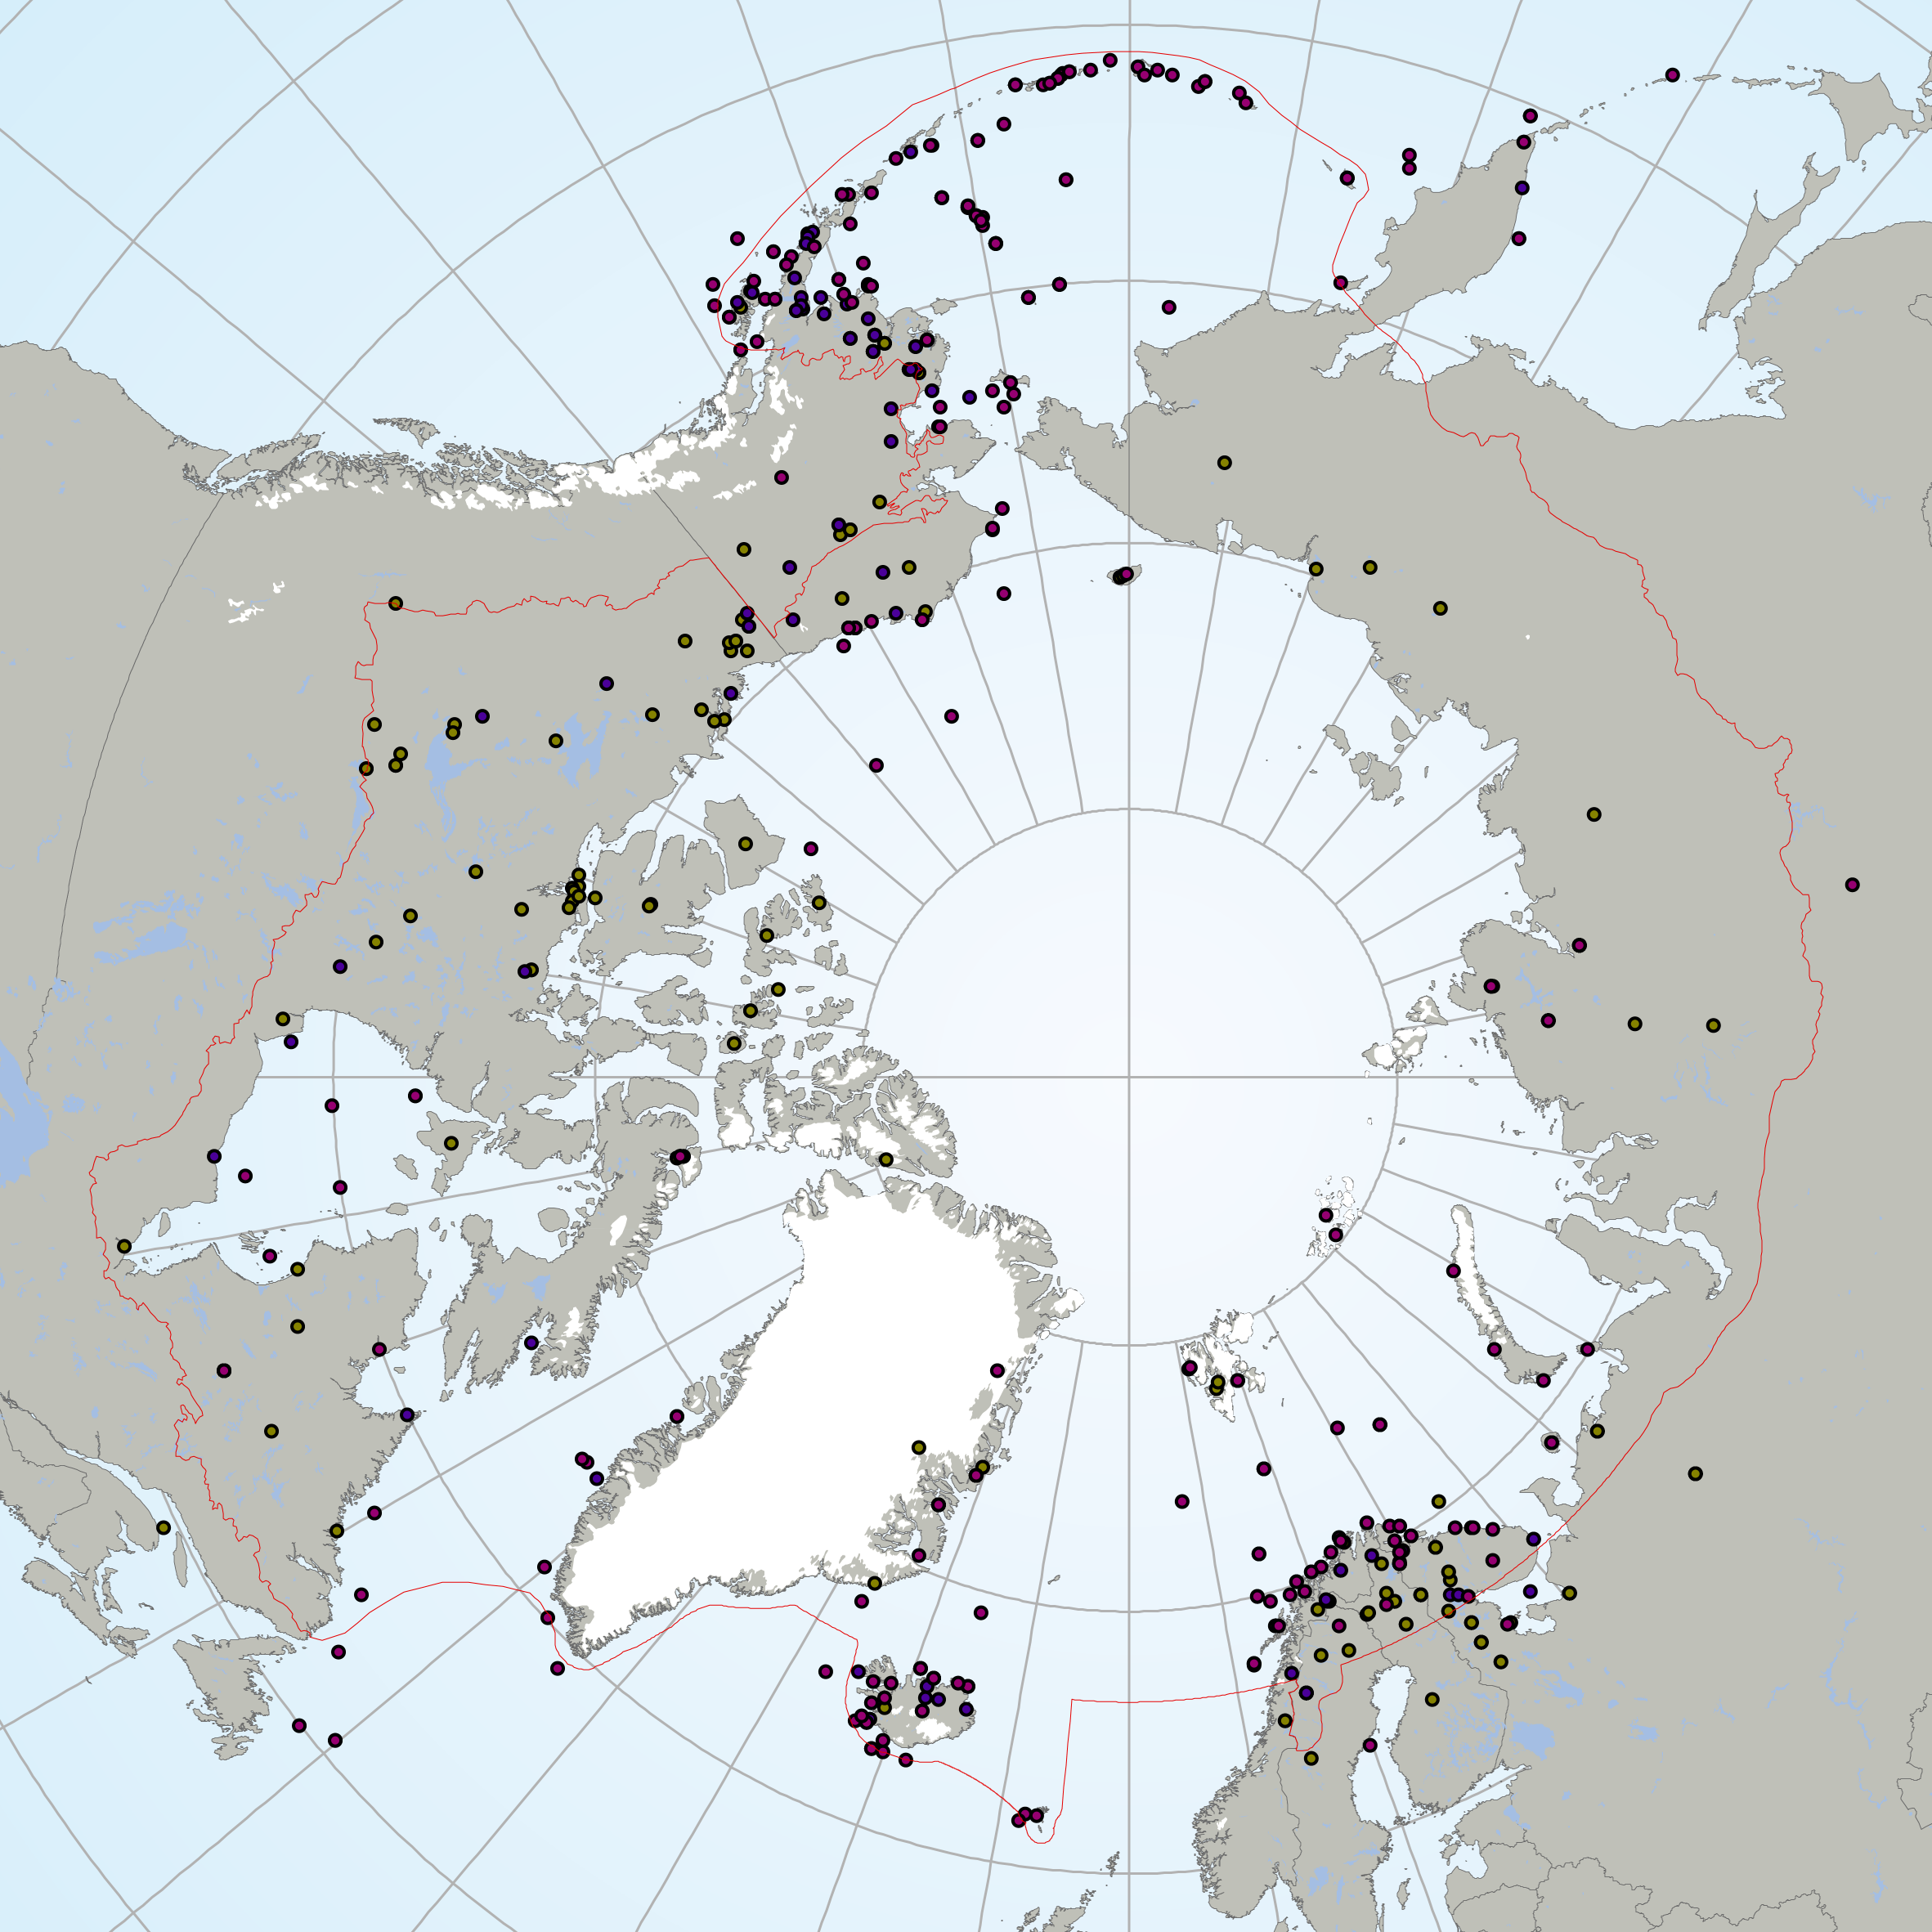
Circumpolar distribution of arctic char species complex Salvelinus alpinus, and related species. - <a href="http://www.caff.is/assessment-series/10-arctic-biodiversity-assessment/211-arctic-biodiversity-assessment-2013-chapter-6-fishes" target="_blank"> Arctic Biodiversity Assessment, Chapter 6: Fishes</a>
-
The Circumpolar Biodiversity Monitoring Program, a cornerstone programme of the Conservation of Arctic Flora and Fauna (CAFF), Arctic Council working Group is an international network of scientists, government agencies, Indigenous organizations and conservation groups working together to harmonize and integrate efforts to monitor the Arctic's living resources.CBMP experts are developing four coordinated and integrated Arctic Biodiversity Monitoring Plans to help guide circumpolar monitoring efforts. Results will be channeled into effective conservation, mitigation and adaptation policies supporting the Arctic. These plans represent the Arctic's major ecosystems(Marine, Freshwater, Coastal, Terrestrial). It is important that monitoring programs develop the most effective reporting strategies if they are to inform decision making. To facilitate effective and consistent reporting, the CBMP has chosen a suite of indices and indicators that provide a comprehensive picture of the state of Arctic biodiversity – from species to habitats to ecosystem processes to ecological services. These indices and indicators are developed in a hierarchical manner, allowing users to drill down into the data from the higher-order indices to more detailed indicators. These are being developed through an expert consultation process. The Arctic Species Trend Index (ASTI) is part of this suite of indicators and indices developed by CAFFs CBMP. It tracks trends in over 300 Arctic vertebrate species and comprises the Arctic component of the Living Planet Index. It is important to identify how wildlife and ecosystems are changing in order to develop effective conservation and adaptation strategies in the Arctic, an environment undergoing dramatic changes. The ASTI describes overall trends across species, taxonomy, ecosystems, regions and other categories.
-
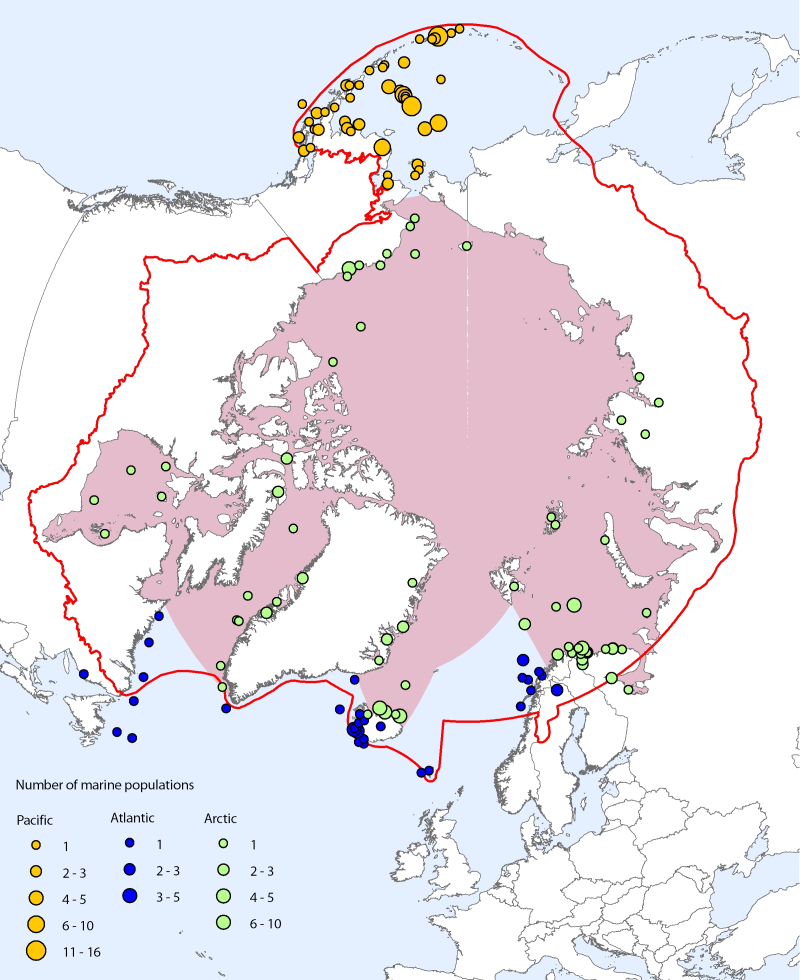
<img src="http://geo.abds.is/geonetwork/srv/eng//resources.get?uuid=59d822e4-56ce-453c-b98d-40207a2e9eec&fname=cbmp_small.png" alt="logo" height="67px" align="left" hspace="10px"> The Arctic marine data set contains a total of 111 species and 310 population time series from 170 locations. Species coverage is about 34% of Arctic marine vertebrate species (100% of mammals, 53% of birds, and 27% of fishes) (Bluhm et al. 2011). At the species level, even though the representation of Arctic fish species is lower than that of mammals and birds, the data are dominated by fishes, primarily from the Pacific Ocean (especially the Bering Sea and Aleutian Islands). However, there are more population time series in total for bird species, which is reflective of this group being both better studied historically and also monitored at many small study sites compared to fish and marine mammal species, which are regularly monitored at a much larger scale through stock management. Note that the time span selected for marine analyses is 1970 to 2005 (compared with 1970 to 2007 for the ASTI for all species). CAFF Assessment Series No. 7 April 2012 - <a href=http://caff.is/asti/asti-publications/28-arctic-species-trend-index-tracking-trends-in-arctic-marine-populations" target="_blank"> The Arctic Species Trend Index - Tracking trends in Arctic marine populations </a>
-
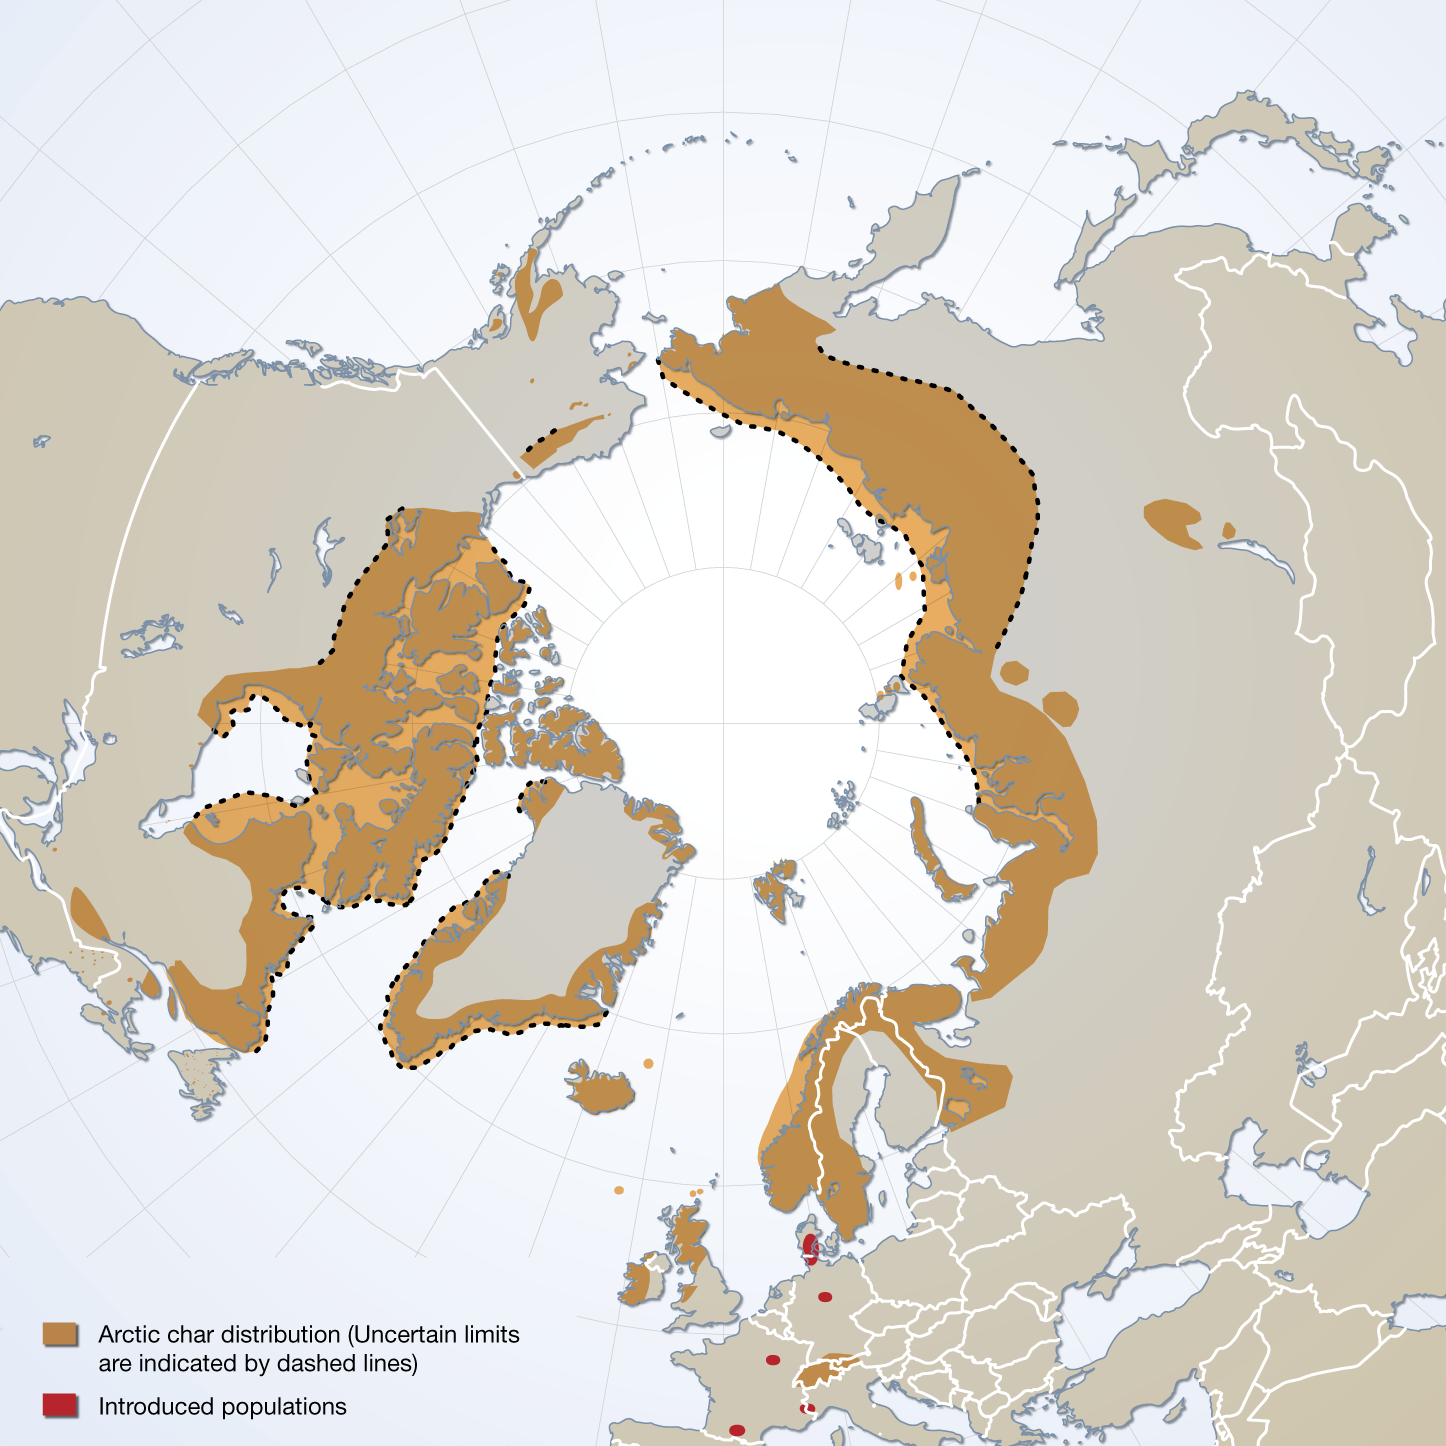
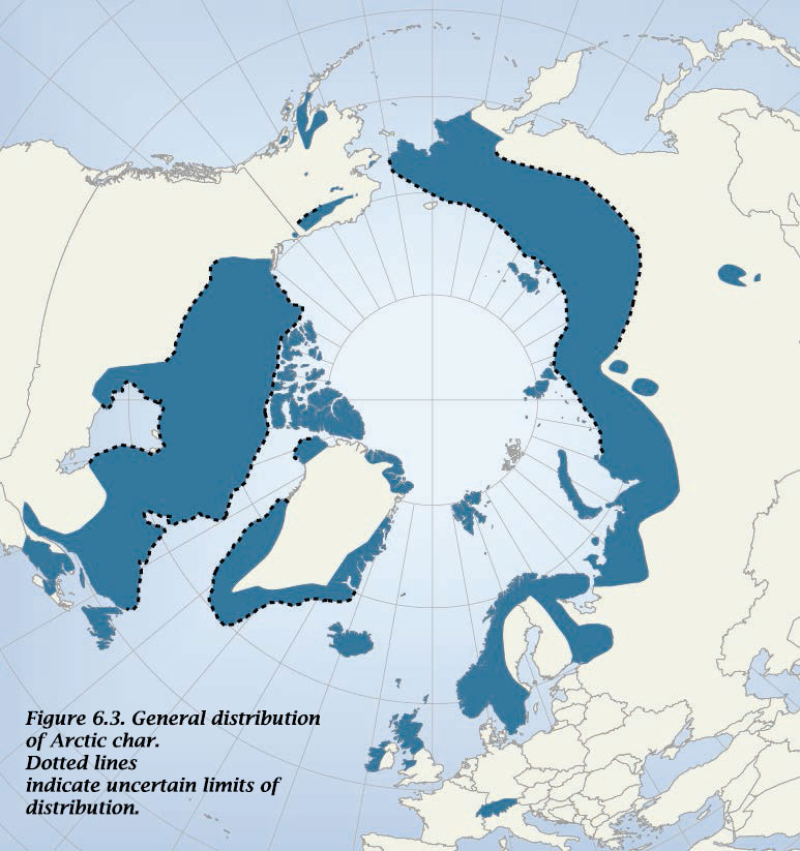
The distribution of Arctic char species complex, sensu stricto, and the location of introduced populations. Published in the Arctic Biodiversity trends 2010, Indicator #06 Arctic char, page 41 - released in May 2010
-
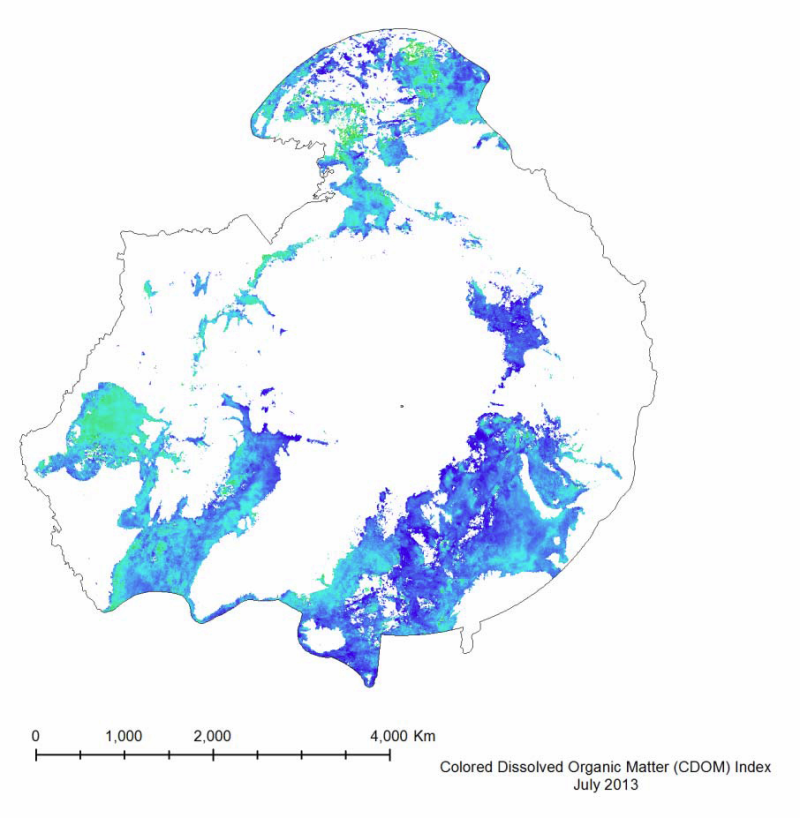
Colored Dissolved Organic Matter (CDOM) is a measurement of the absorption of light in the UV and visible spectrum by the colored components of dissolved organic carbon. It is essentially the yellow substance in water as a result of decaying detritus. It is important to measure because it limits the amount of sunlight penetration, and thus restricts the growth of plankton populations. It is measured in a unit-less CDOM index. Data generated as part of CAFFs Circumpolar Biodiversity Monitoring Program (CAFF) and its Land Cover Change Initiative (LCC) Trends visible in the MODIS dataset show an overall decrease in the mean CDOM from 2003 to 2012, with a percent change of -31.7%. This trend can be seen in Figure 40. This decrease corresponds to the increase in total yearly primary productivity (Figure 30), as a decrease in the CDOM allows for sunlight to penetrate deeper into the water, boosting chlorophyll concentrations and thus primary productivity.