 CAFF - Arctic Biodiversity Data Service (ABDS)
Conservation of Arctic Flora and Fauna (CAFF)
Type of resources
Available actions
Topics
Keywords
Contact for the resource
Provided by
Years
Formats
Representation types
Update frequencies
status
Service types
Scale
-
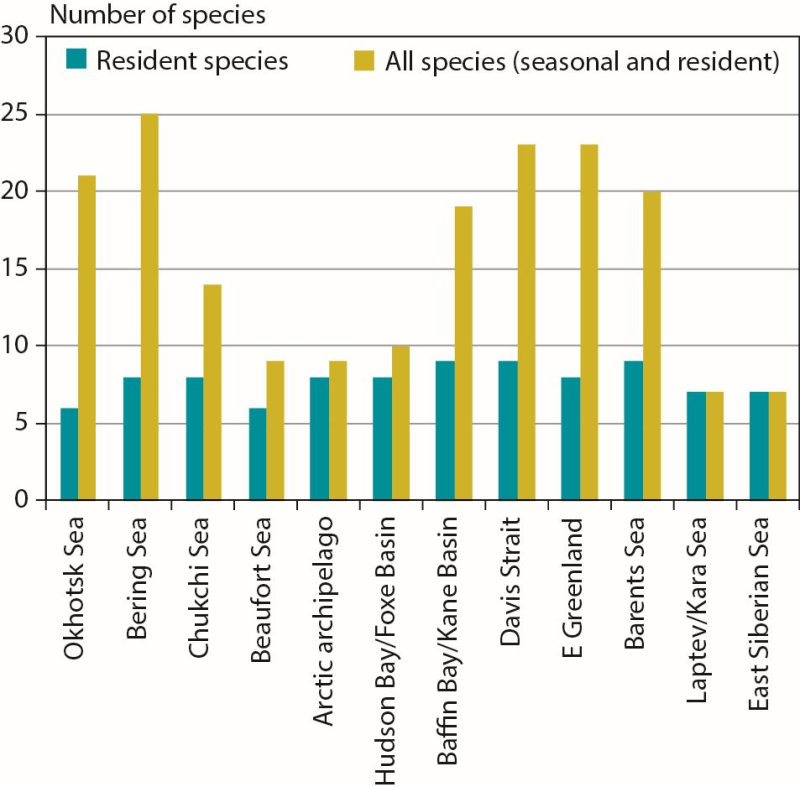
Number of marine mammal species in Arctic marine regions classified by resident species (n = 11 total) or all species (including seasonal visitors, n = 35 total). CAFF 2013. Arctic Biodiversity Assessment. Status and Trends in Arctic biodiversity. Conservation of Arctic Flora and Fauna, Akureyri - Mammal (Chapter 3) page 84
-
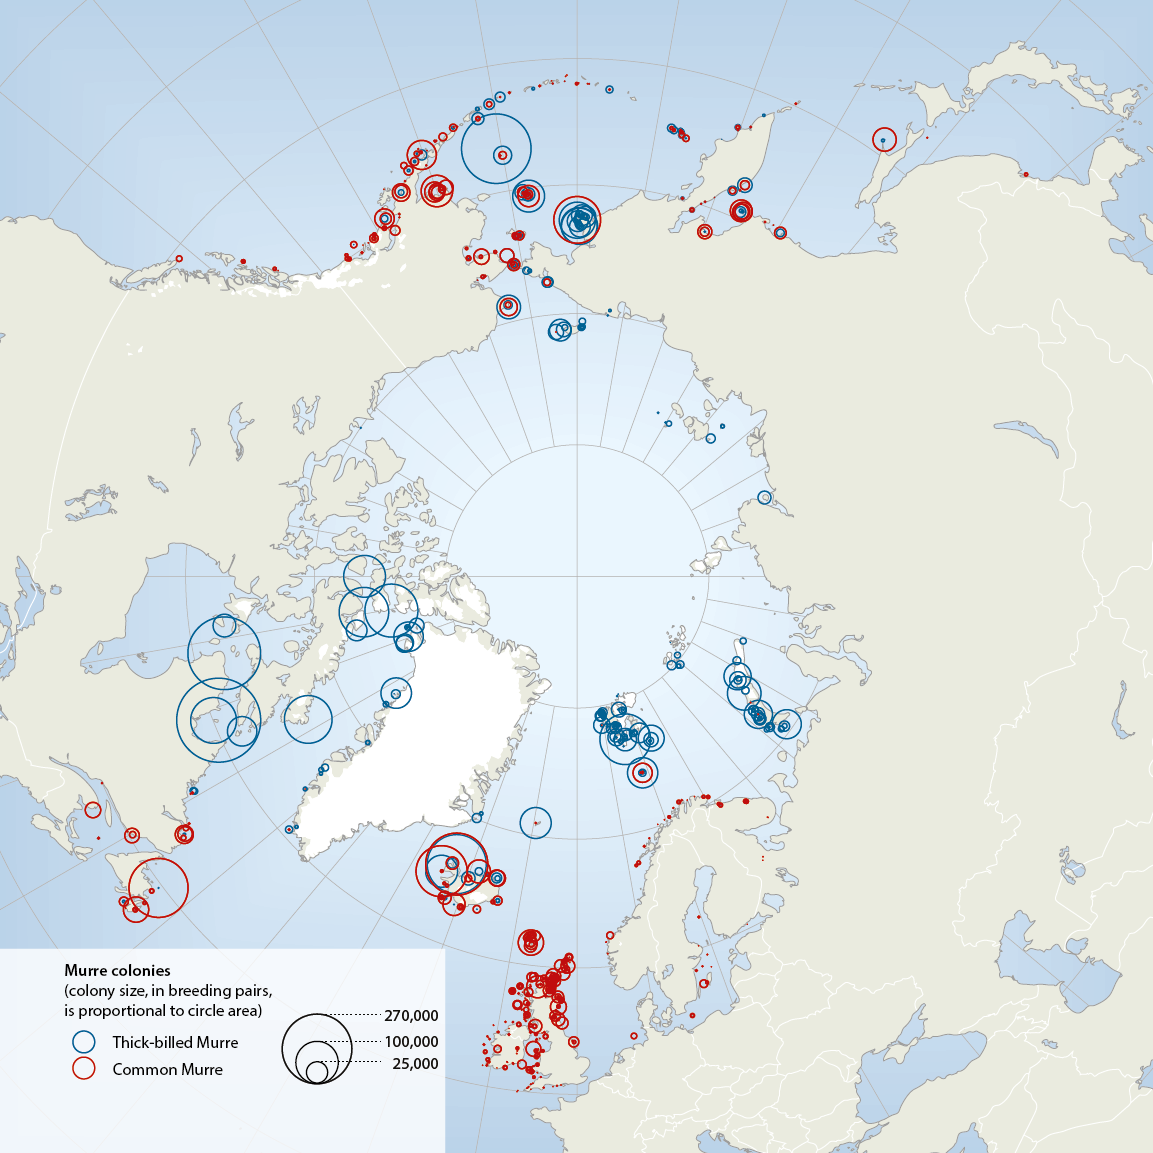
The two species of murres, thick-billed Uria lomvia and common U. aalge, both have circumpolar distributions, breeding in Arctic, sub-Arctic and temperate seas from alifornia and N Spain to N Greenland, high Arctic Canada, Svalbard, Franz Josef Land and Novaya Zemlya (Box 4.3 Fig. 1). Conservation of Arctic Flora and Fauna, CAFF 2013 - Akureyri . Arctic Biodiversity Assessment. Status and Trends in Arctic biodiversity. - Birds(Chapter 4) page 163
-
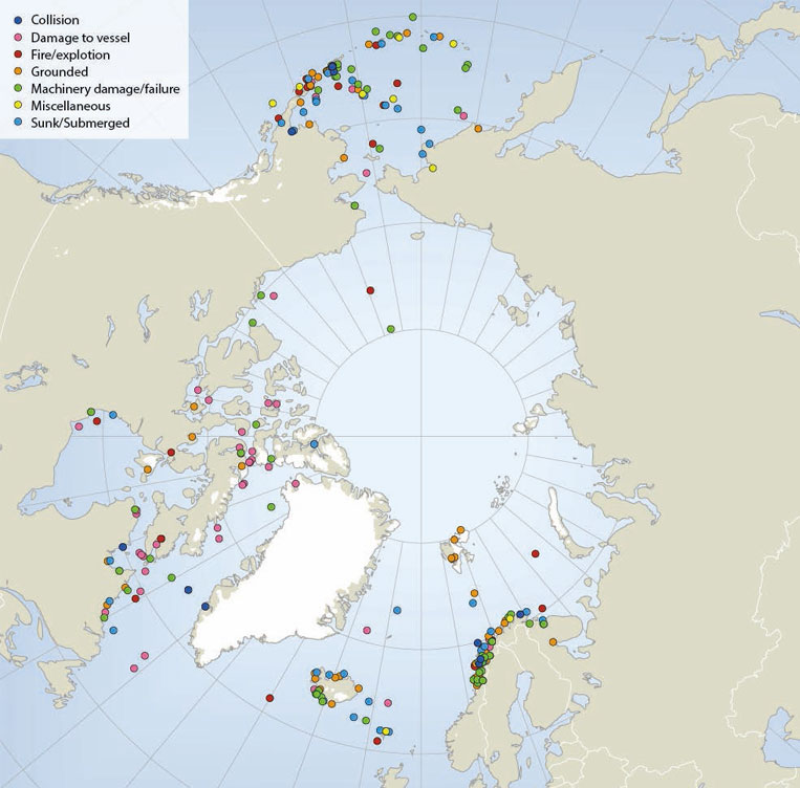
Locations of sub-Arctic and Arctic shipping accidents and incident causes, 1995-2004 (source: Arctic Marine Shipping Assessment 2009). Published in the Arctic Biodiversity Assessment (ABA) released in 2014.
-
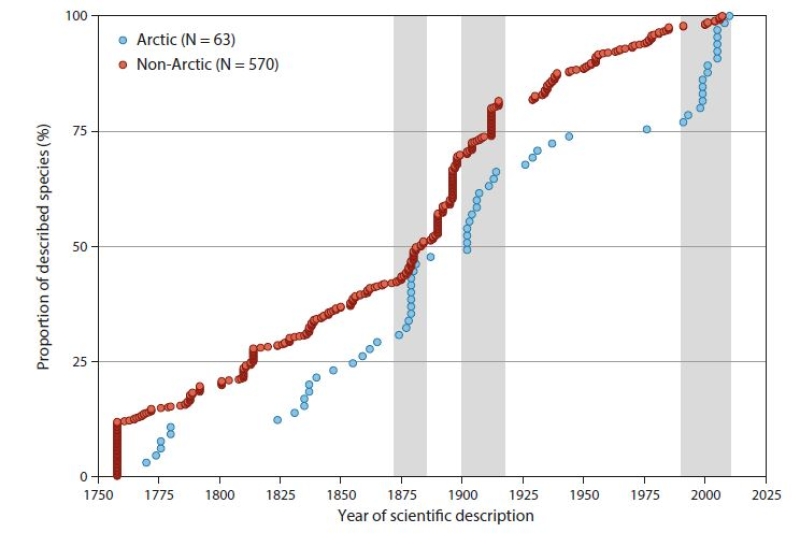
Cumulative numbers of marine fish diversity (n = 633, Appendix 6.2) in the Arctic Ocean and adjacent seas (AOAS) from 1758 to the present. Species are broadly grouped according to zoogeographic pattern (cf. Section 6.3.1): Arctic (A, blue symbols) and non-Arctic (Σ AB, B, WD, red symbols). Grey bars denote periods with many descriptions of new Arctic species. Note that 75% of the non-Arctic species known to science were described by 1912, whereas the same proportion for Arctic species was only reached in 1976. See text for further information. Conservation of Arctic Flora and Fauna, CAFF 2013 - Akureyri . Arctic Biodiversity Assessment. Status and Trends in Arctic biodiversity. - Fishes(Chapter 6) page 220
-
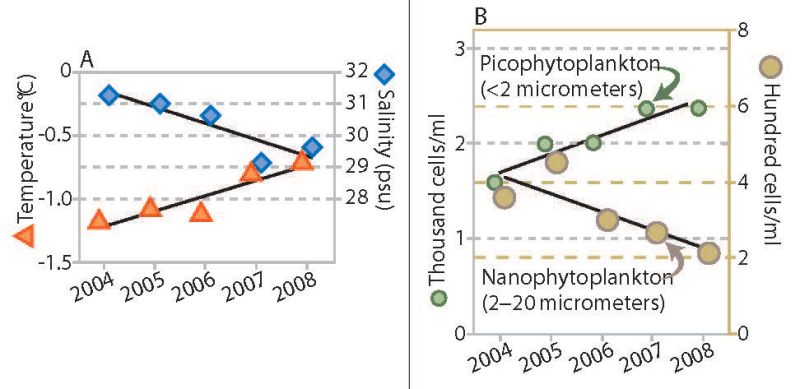
Trends in water temperature and salinity (A) and density of phytoplankton of two size ranges (B), Canada Basin, 2004 to 2008. Stratification of the water column increased throughout the Canada Basin over a recent five-year period, accompanied by a change in phytoplankton communities. The upper ocean layer showed trends of increased temperature and decreased salinity (Figure 18A), which combine to make this layer progressively less dense. The layer of water below this did not change in density over this period (not shown). The larger size class of phytoplankton (which would include diatoms) decreased in abundance, while the smaller types of plankton increased (Figure 18B). In addition to the trends shown, nutrient content in the upper ocean water layer decreased. Abundance of microbes (bacteria and similar organisms) that subsist on organic matter increased. Total phytoplankton biomass, however, remained unchanged. If this trend towards smaller species of phytoplankton and microbes is sustained, it may lead to reduced production of zooplankton, an impact that would be transmitted through the food web to birds, fish and mammals. Published in the Life Linked to Ice released in 2013, page 30. Life Linked to Ice: A guide to sea-ice-associated biodiversity in this time of rapid change. CAFF Assessment Series No. 10. Conservation of Arctic Flora and Fauna, Iceland. ISBN: 978-9935-431-25-7.
-
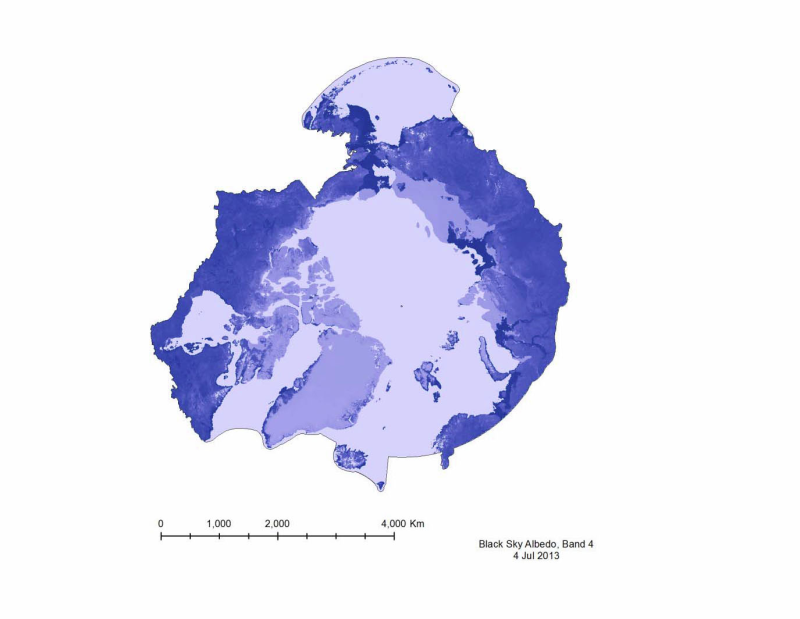
Albedo is a reflection coefficient that describes the reflecting power of a surface. Data compiled for CAFFs Land Cover Change Initiative with dataset for the firs of very month during 2001- 20112. - <a href="http://www.caff.is/indices-and-indicators/land-cover-change-index" target="_blank"> Land Cover Change Initiative (LCC)</a>
-
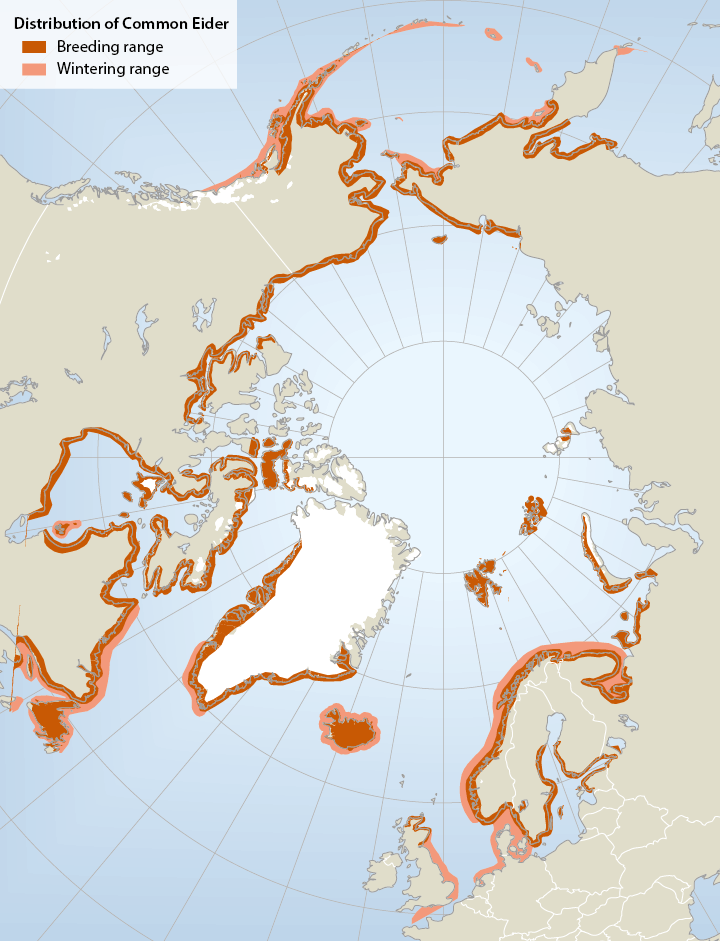
Breeding and wintering range of common eiders Somateria mollissima in the circumpolar region (not all southern breeding areas included).The common eider Somateria mollissima has a circumpolar distribution breeding mainly on small islands in Arctic and boreal marine areas in Alaska (Bering Sea region), Canada, Greenland, Iceland, N Europe and the Barents Sea region. In mainland Russia, there is a gap in distribution from the Yugorski Peninsula (Kara Sea) to Chaunskaya Bay in E Siberia Important wintering areas include the Gulf of Alaska/Bering Sea/Aleutian region, SE Canada, SW Greenland, Iceland and NW Europe. Six or seven subspecies are recognized, of which four occur in North America. - <a href="http://arcticbiodiversity.is/the-report/chapters/birds" target="_blank">Arctic Biodiversity Assessment. Status and Trends in Arctic biodiversity. - Birds(Chapter 4) page 150</a>
-
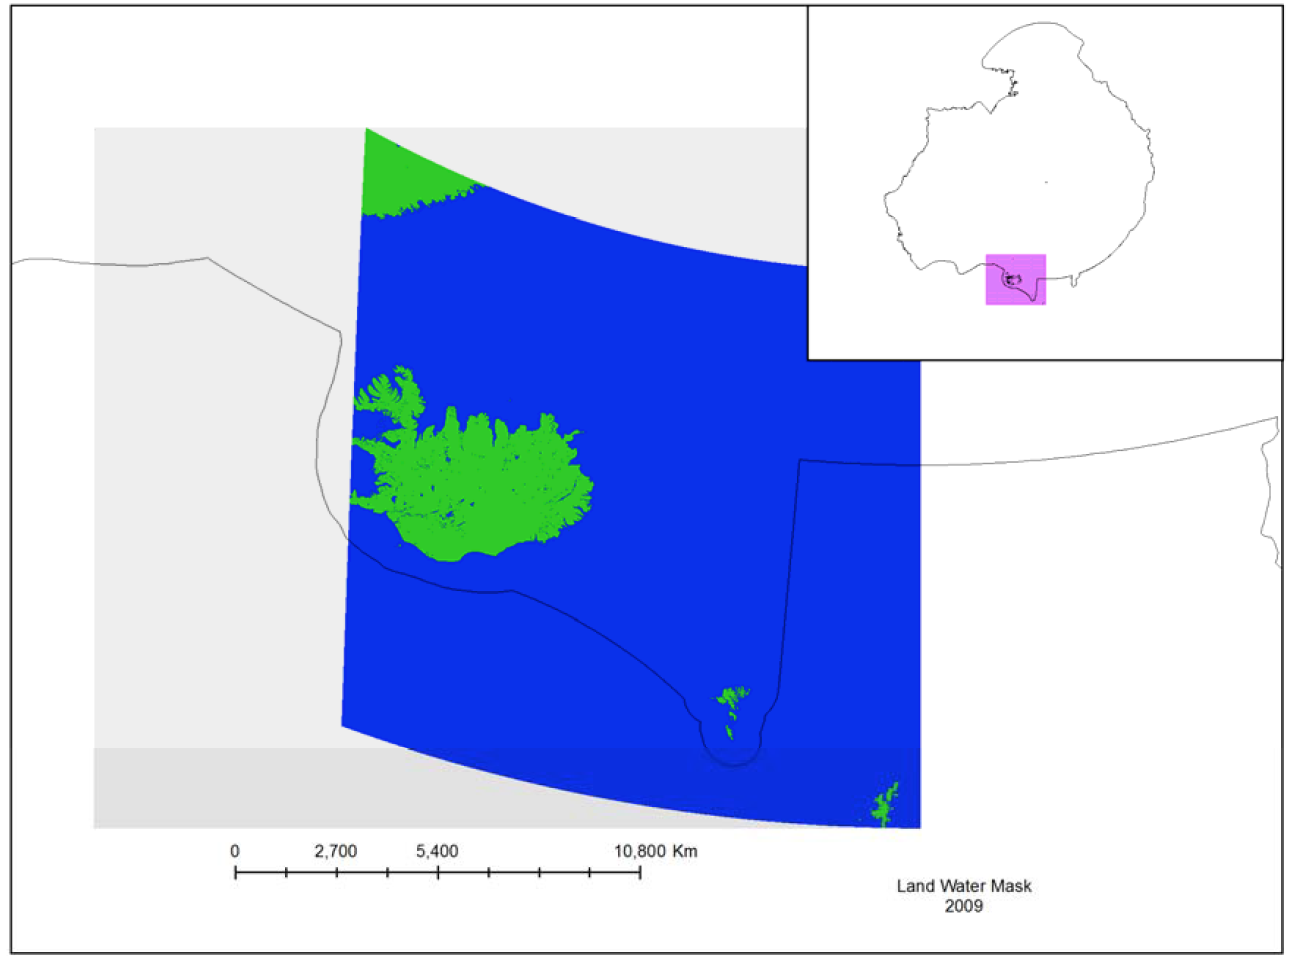
The MODIS Land Water Mask is created from MODIS 250 m imagery incombination with Shuttle Radar Topography Mission (SRTM) Water Body Data (SWBD) tocreate a global map of surface water at 250 m spatial resolution. Currently, only one mapexists, created in 2009 by Carroll et al. (2009). Because only one MODIS-based map exists,an analysis of surface water change is not possible at this time.
-
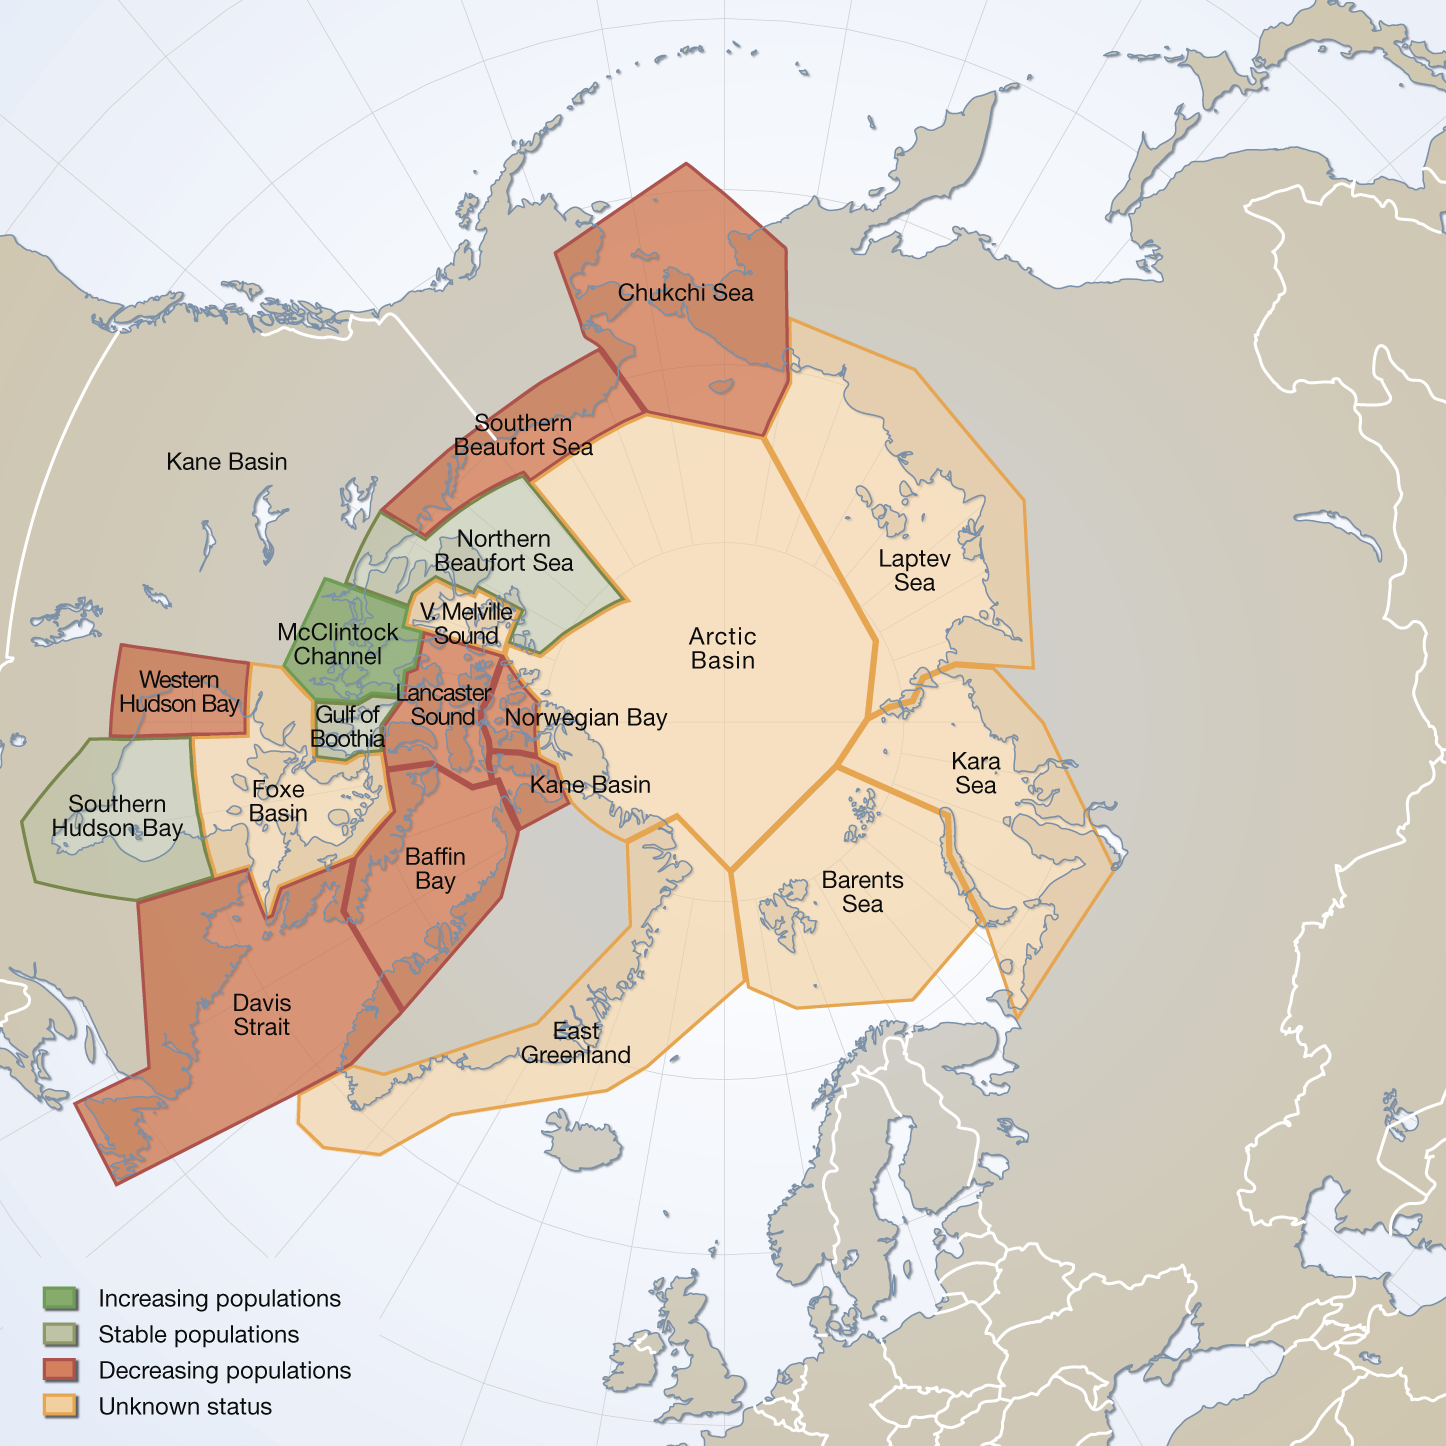
Circumpolar map of all polar bear subpopulation as recognized by the IUCN/Polar Bear Specialist Group in 2009 (PBSG 2010a). Total area covered = 24 mill. km(2). Vongraven, D and Peacock, E. Development of a pan-Arctic monitoring plan for polar bears:background paper. Published in the Arctic Biodiversity trends 2010, Indicator #01 - released in May 2010 Updated in feb.2025 with spatial data from 2022
-
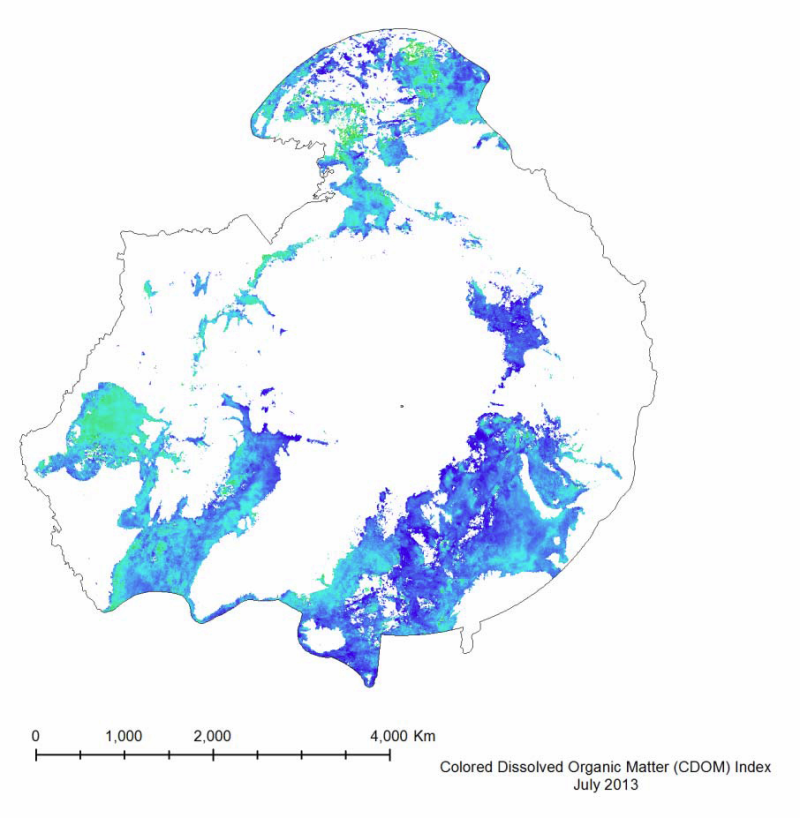
Colored Dissolved Organic Matter (CDOM) is a measurement of the absorption of light in the UV and visible spectrum by the colored components of dissolved organic carbon. It is essentially the yellow substance in water as a result of decaying detritus. It is important to measure because it limits the amount of sunlight penetration, and thus restricts the growth of plankton populations. It is measured in a unit-less CDOM index. Data generated as part of CAFFs Circumpolar Biodiversity Monitoring Program (CAFF) and its Land Cover Change Initiative (LCC) Trends visible in the MODIS dataset show an overall decrease in the mean CDOM from 2003 to 2012, with a percent change of -31.7%. This trend can be seen in Figure 40. This decrease corresponds to the increase in total yearly primary productivity (Figure 30), as a decrease in the CDOM allows for sunlight to penetrate deeper into the water, boosting chlorophyll concentrations and thus primary productivity.