 CAFF - Arctic Biodiversity Data Service (ABDS)
Barents
Type of resources
Available actions
Topics
Keywords
Contact for the resource
Provided by
Update frequencies
-
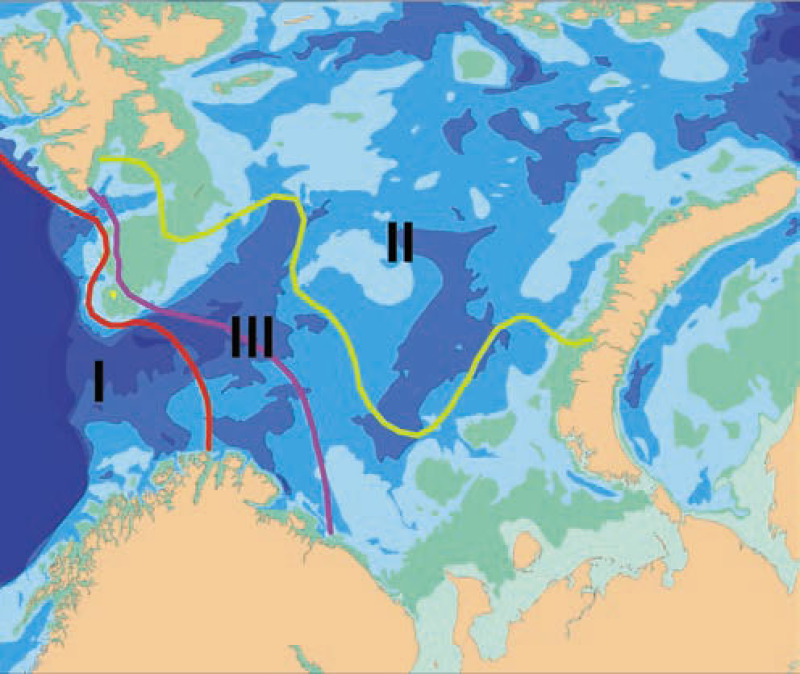
Biogeographic borders in the Barents Sea based on species distributions of bryozoans. Average position of the border with 50:50% of Atlantic boreal and Arctic species numbers is indicated by the pink line, and the red and green lines indicate the extreme positions of the border in cold and warm periods respectively. Area III between them is the transitional zone between the Atlantic boreal and the Arctic regions. Thus, area I always has > 50% Atlantic boreal species, and area II always > 50% Arctic species (after Denisenko 1990).
-
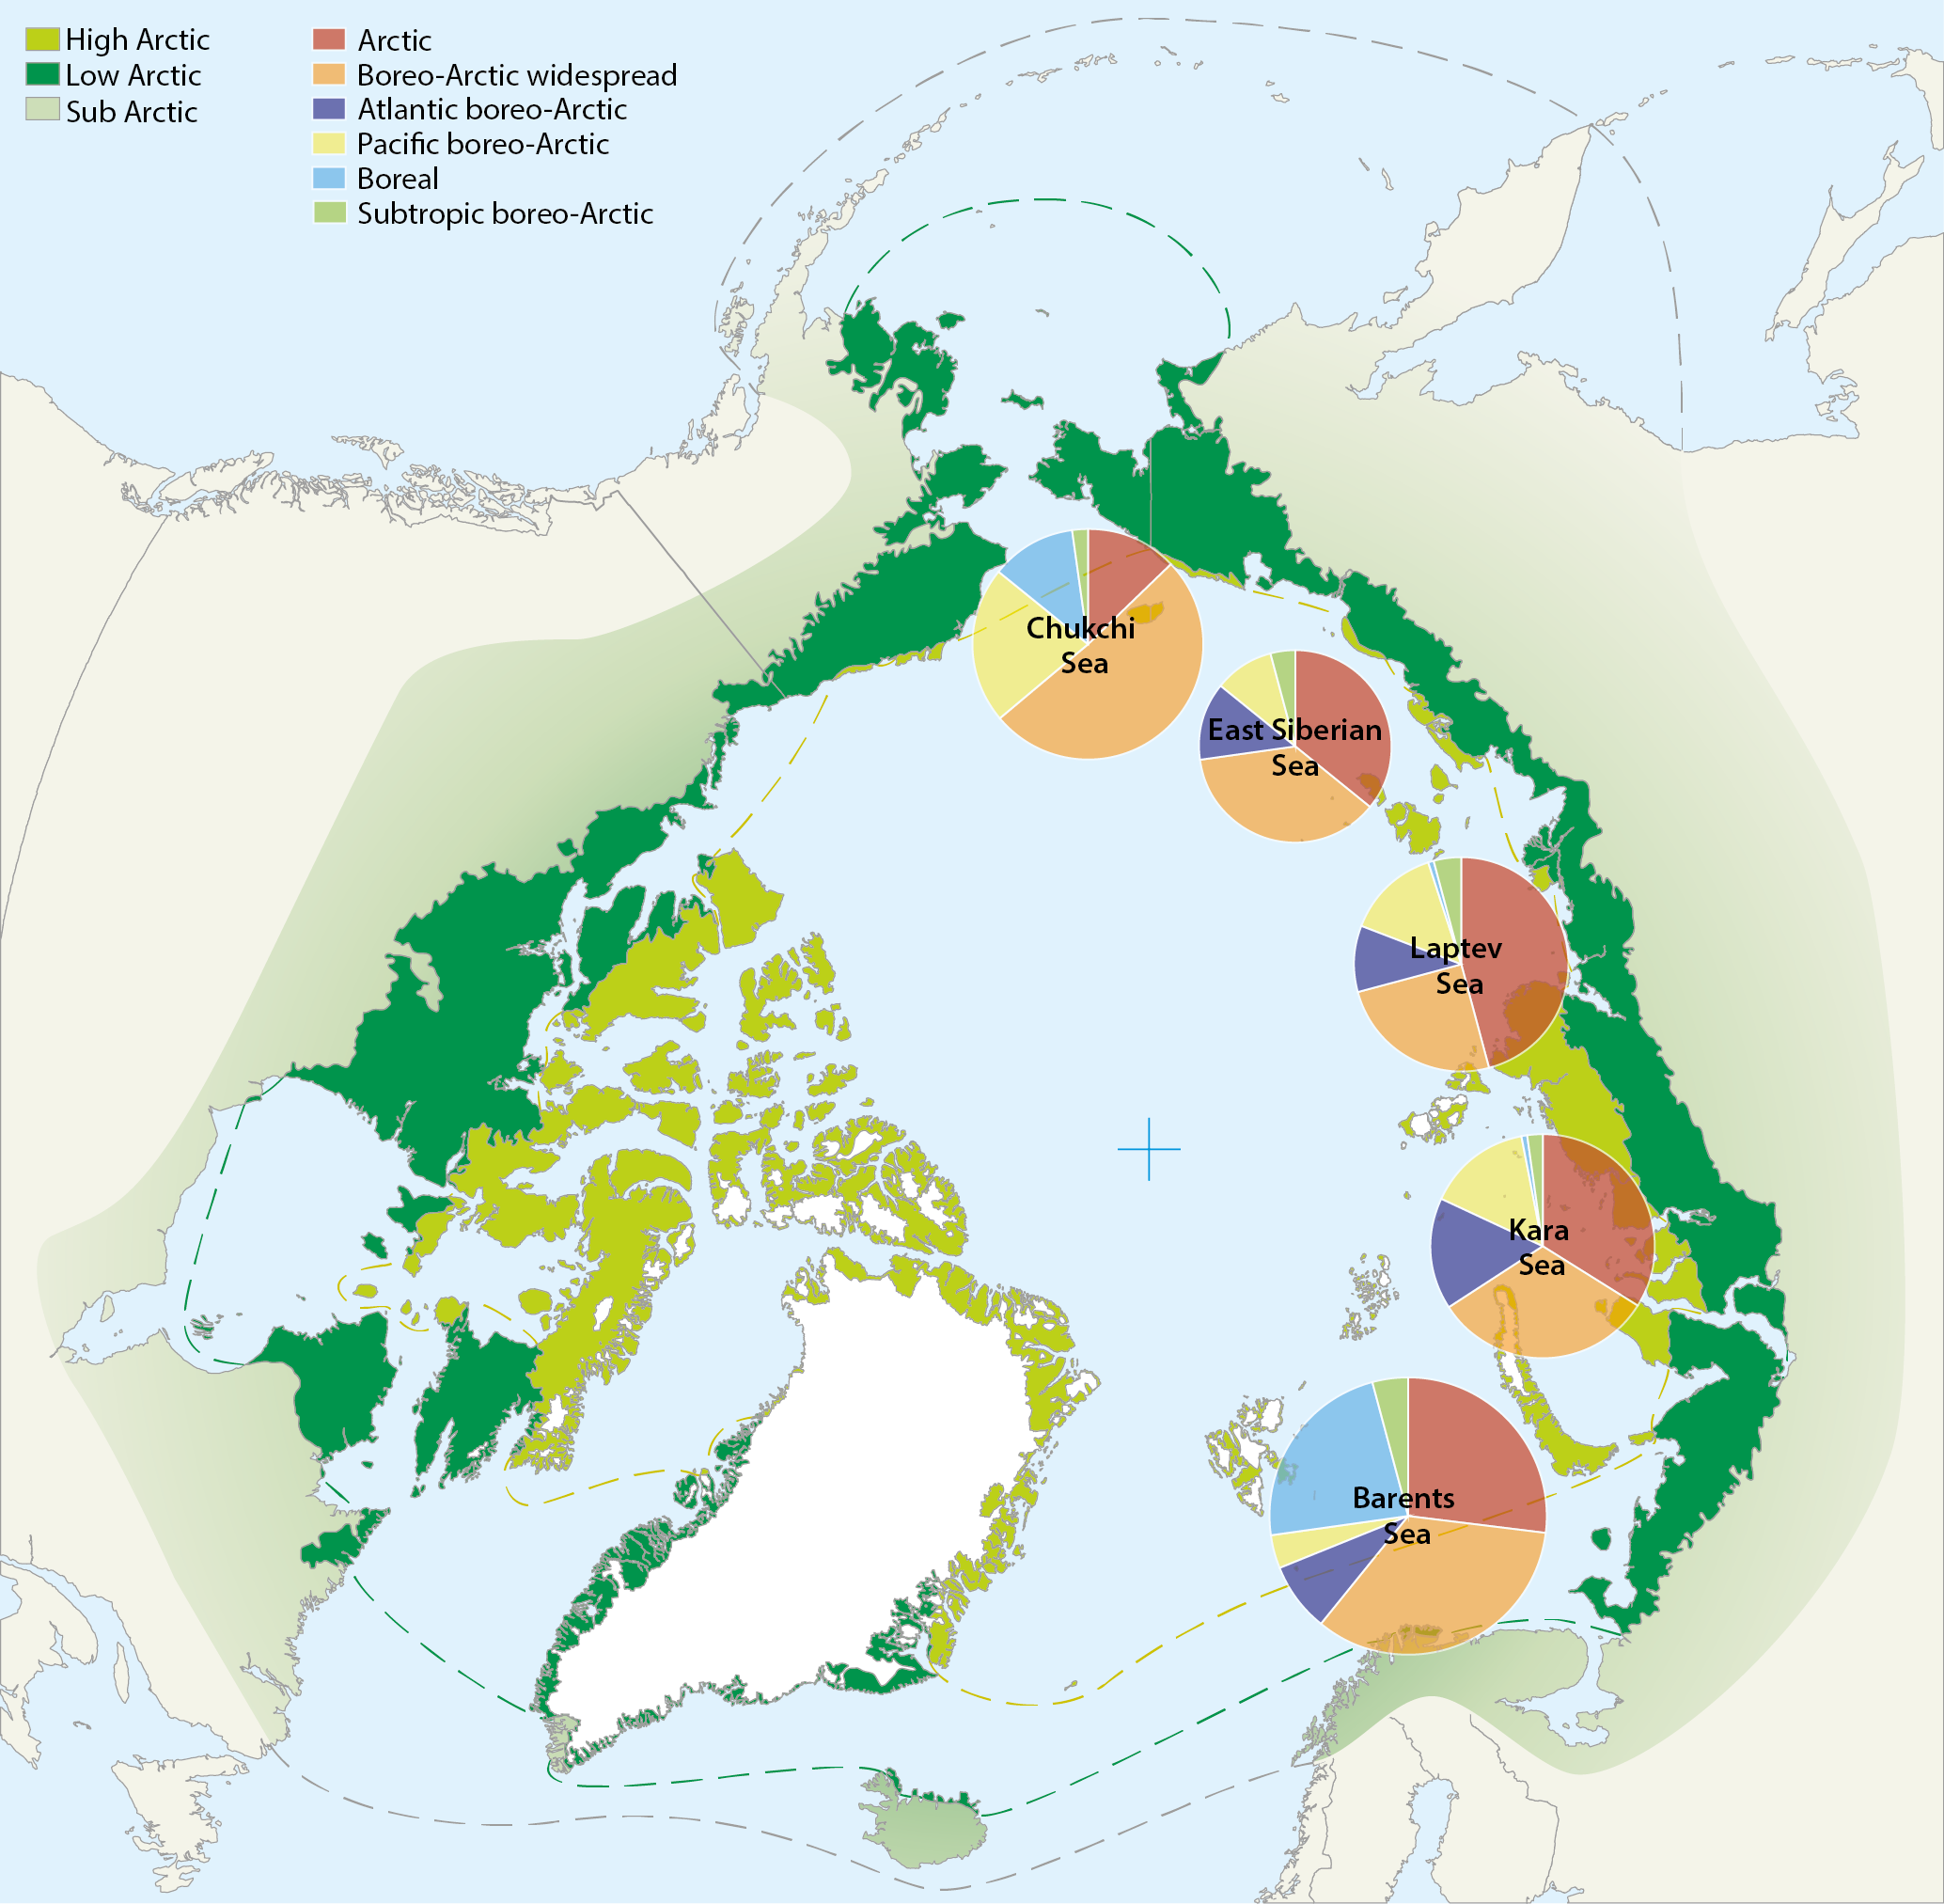
Map of the Arctic Ocean showing the distribution of species richness of Bryozoa for different shelf seas along the Eurasian continental shelf. Diameters of circles are proportional to the number of bryozoan species given in Tab. 8.3. Species numbers partitioned into six zoogeographical affinities are shown from the: Barents Sea (Denisenko 1990), Kara Sea (Gontar & Denisenko 1989); Laptev Sea (Gontar 2004), East Siberian Sea (Denisenko 2010), Chukchi Sea (Denisenko 2008). Conservation of Arctic Flora and Fauna, CAFF 2013 - Akureyri . Arctic Biodiversity Assessment. Status and Trends in Arctic biodiversity. - Marine Invertebrates(Chapter 8) page 282
-
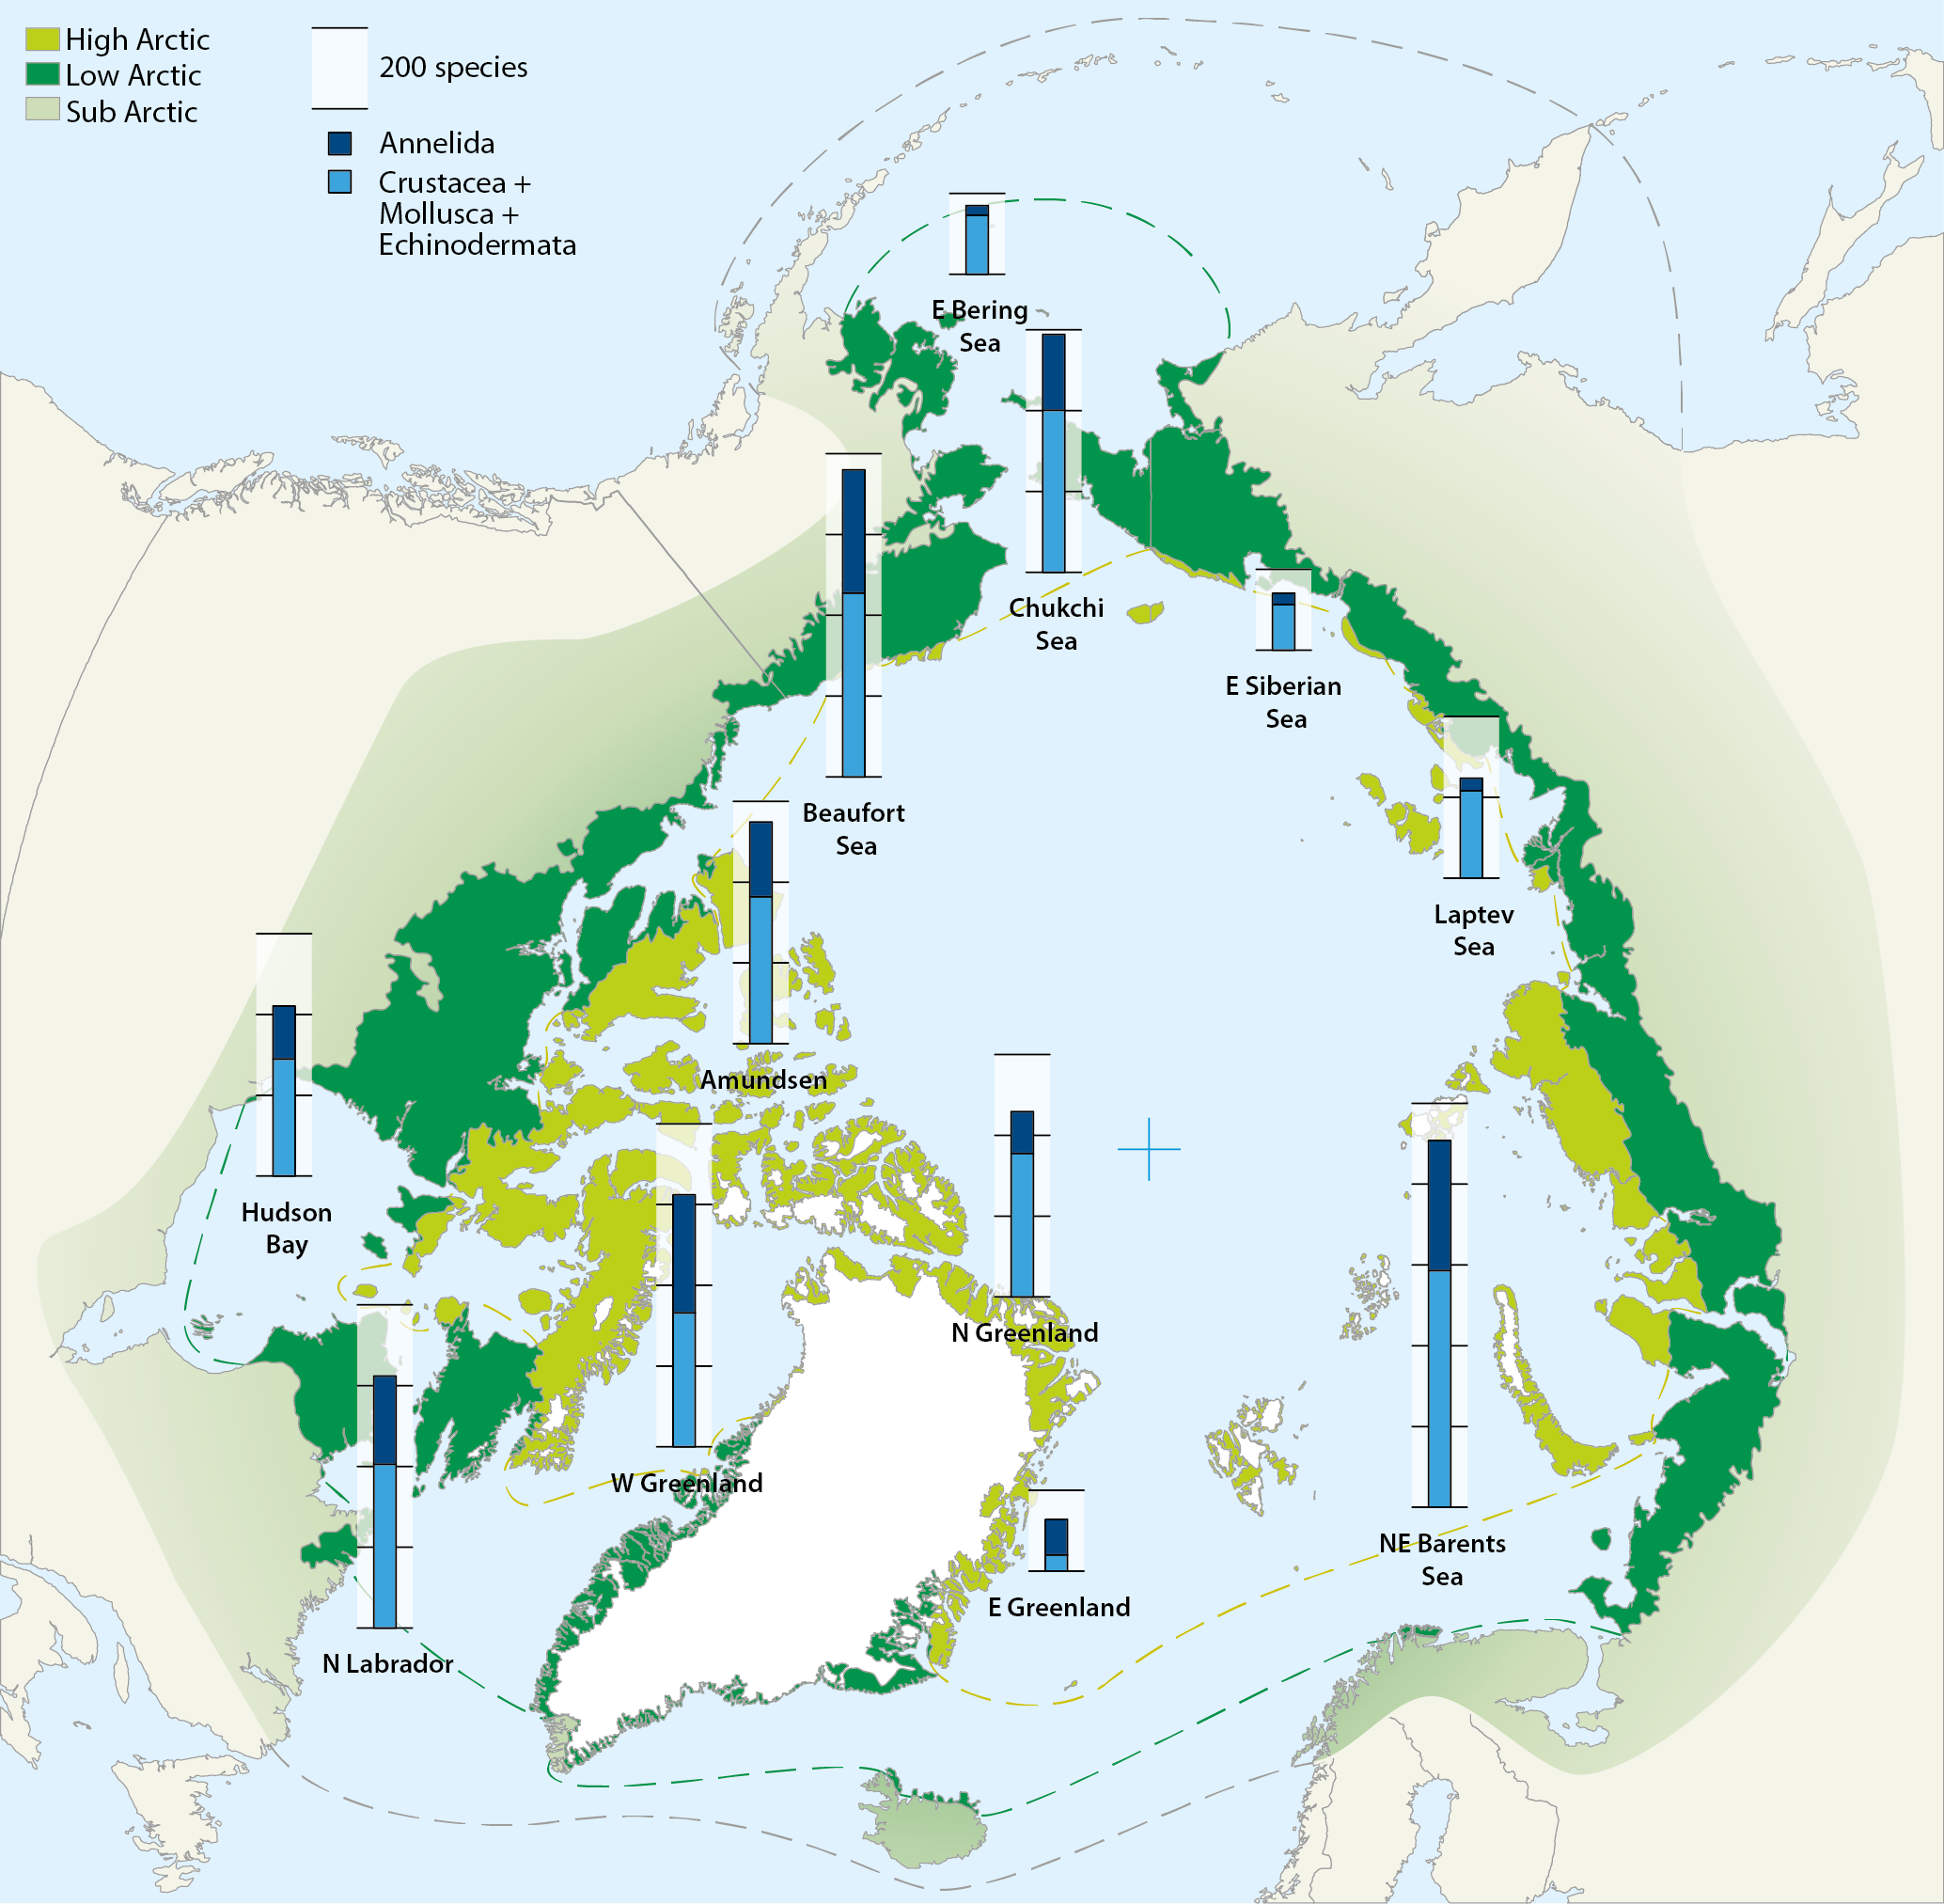
Map of the Arctic Ocean with superimposed stacked bars representing species numbers of macrozoobenthos from different shelf sea areas: Crustacea+Mollusca+Echinodermata (blue) and Annelida (black). Compiled by Piepenburg et al. (2011). Conservation of Arctic Flora and Fauna, CAFF 2013 - Akureyri . Arctic Biodiversity Assessment. Status and Trends in Arctic biodiversity. - Marine Invertebrates(Chapter 8) page 282