 CAFF - Arctic Biodiversity Data Service (ABDS)
biomass
Type of resources
Available actions
Topics
Keywords
Contact for the resource
Provided by
Representation types
Update frequencies
status
-
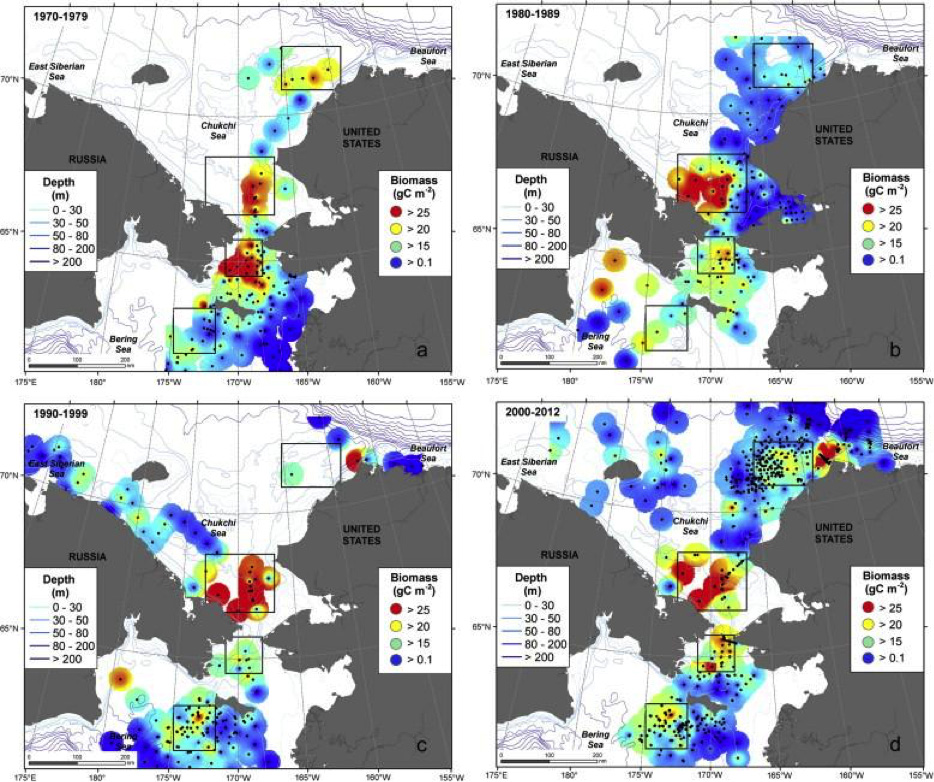
Benthic macro-infauna biomass in the northern Bering and Chukchi Seas from 1970 to 2012, displayed as decadal pattern Adapted from Grebmeier et al. (2015a) with permission from Elsevier. STATE OF THE ARCTIC MARINE BIODIVERSITY REPORT - <a href="https://arcticbiodiversity.is/findings/benthos" target="_blank">Chapter 3</a> - Page 98 - Figure 3.3.6 Cumulative scores of benthos drivers for each of the 8 CAFF-AMAs. The cumulative scores are taken from the last column of Table 3.3.1. The flower chart/plot helps to visualize the data.
-
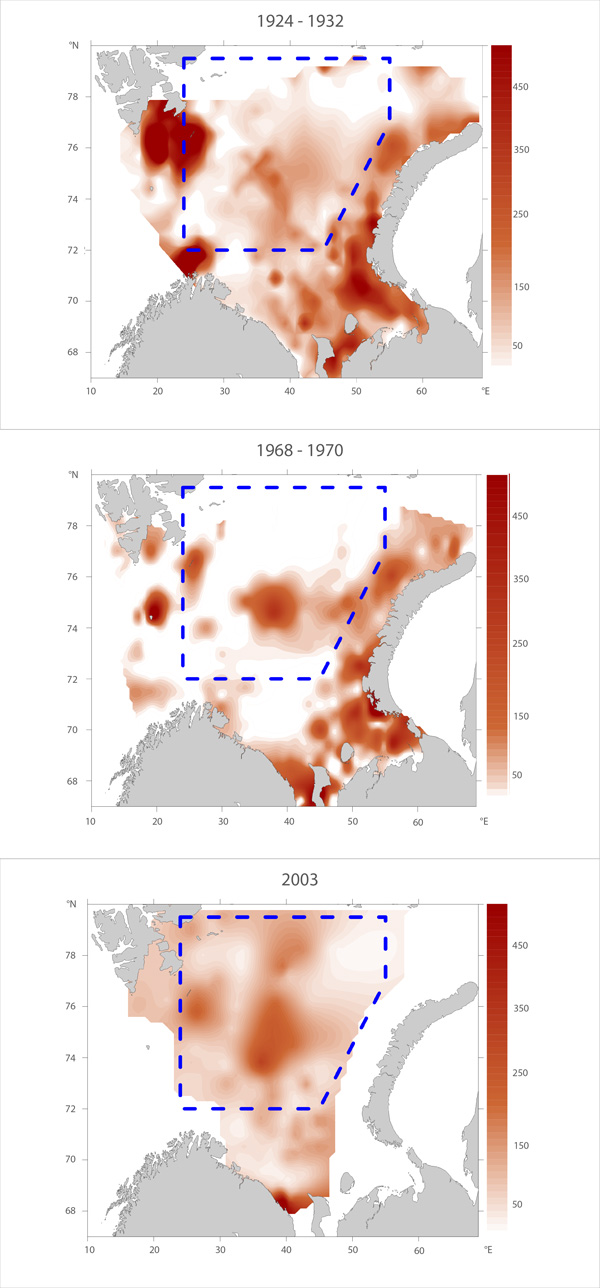
Macrofauna distribution of biomass (g wet fixed weight m-2) in the Barents Sea over three time periods: 1924-32 (Figure A), 1968-70 (Figure B) and 2003 (Figure C, constructed from original archive data, except for area south of 72° N where digitized megafaunal-data taken from Anisimova et al. (2010) was used. Adapted from Denisenko (2013). Blue boxes delineate the areas within which the zoobenthos biomass values were compared. STATE OF THE ARCTIC MARINE BIODIVERSITY REPORT - <a href="https://arcticbiodiversity.is/findings/benthos" target="_blank">Chapter 3</a> - Page 96- Figure 3.3.3
-
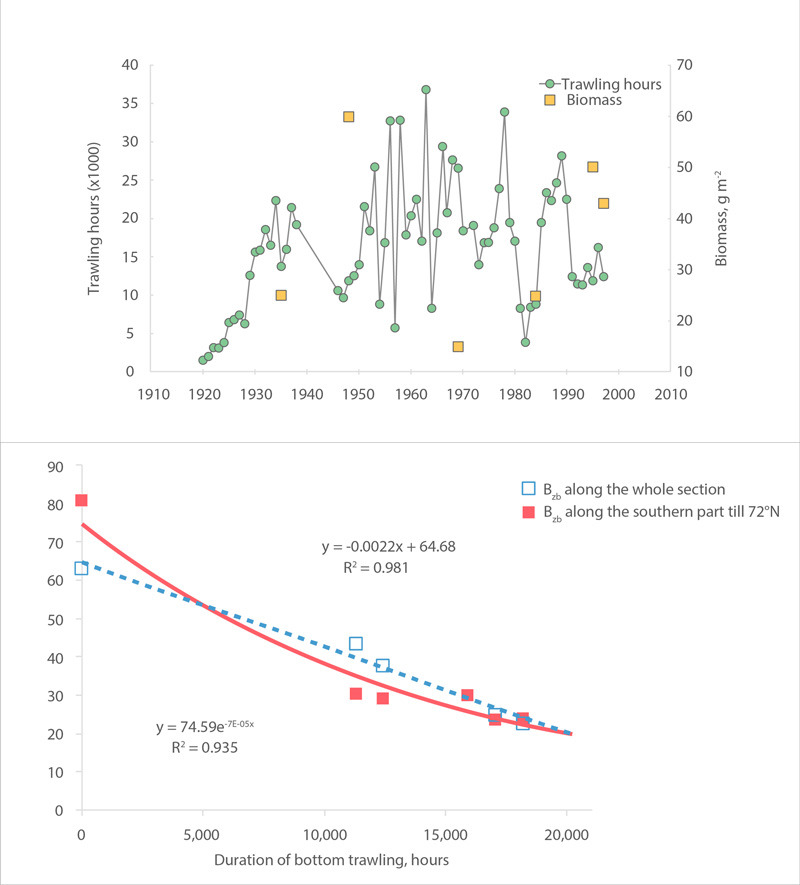
Variation of average annual trawling activity (in hours) and macrobenthic biomass (g m-2), (a) and relationship of biomass with a four-year lag (mean value of time of the turnover in biomass value) to trawling activity, (b) along the Kola section of the Barents Sea during 1920-1997 (Denisenko 2001, 2013). STATE OF THE ARCTIC MARINE BIODIVERSITY REPORT - <a href="https://arcticbiodiversity.is/findings/benthos" target="_blank">Chapter 3</a> - Page 97 - Figure 3.3.5
-
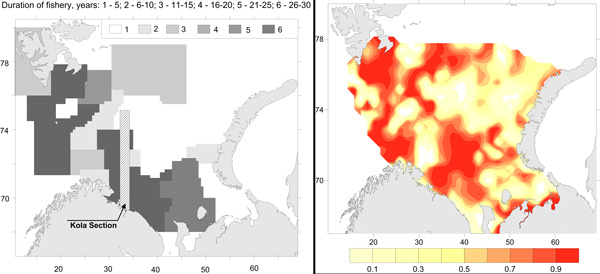
Commercial fishery impact on zoobenthos of the Barents Sea. Figure A) Intensity and duration of fishery efforts in standard commercial fishery areas in the Barents Sea. The darker the area the longer the fishery has been in operation. Figure B) Level of decline in macrobenthic biomass between 1926-1932 and 1968-1970 calculated as 1-b1968/b1930. The largest biomass decreases correspond to the darker colour, whereas lighter colour refers to no change (Denisenko 2013). STATE OF THE ARCTIC MARINE BIODIVERSITY REPORT - <a href="https://arcticbiodiversity.is/findings/benthos" target="_blank">Chapter 3</a> - Page 97 - Figure 3.3.4