 CAFF - Arctic Biodiversity Data Service (ABDS)
daylength
Type of resources
Available actions
Topics
Keywords
Contact for the resource
Provided by
Representation types
Update frequencies
status
-
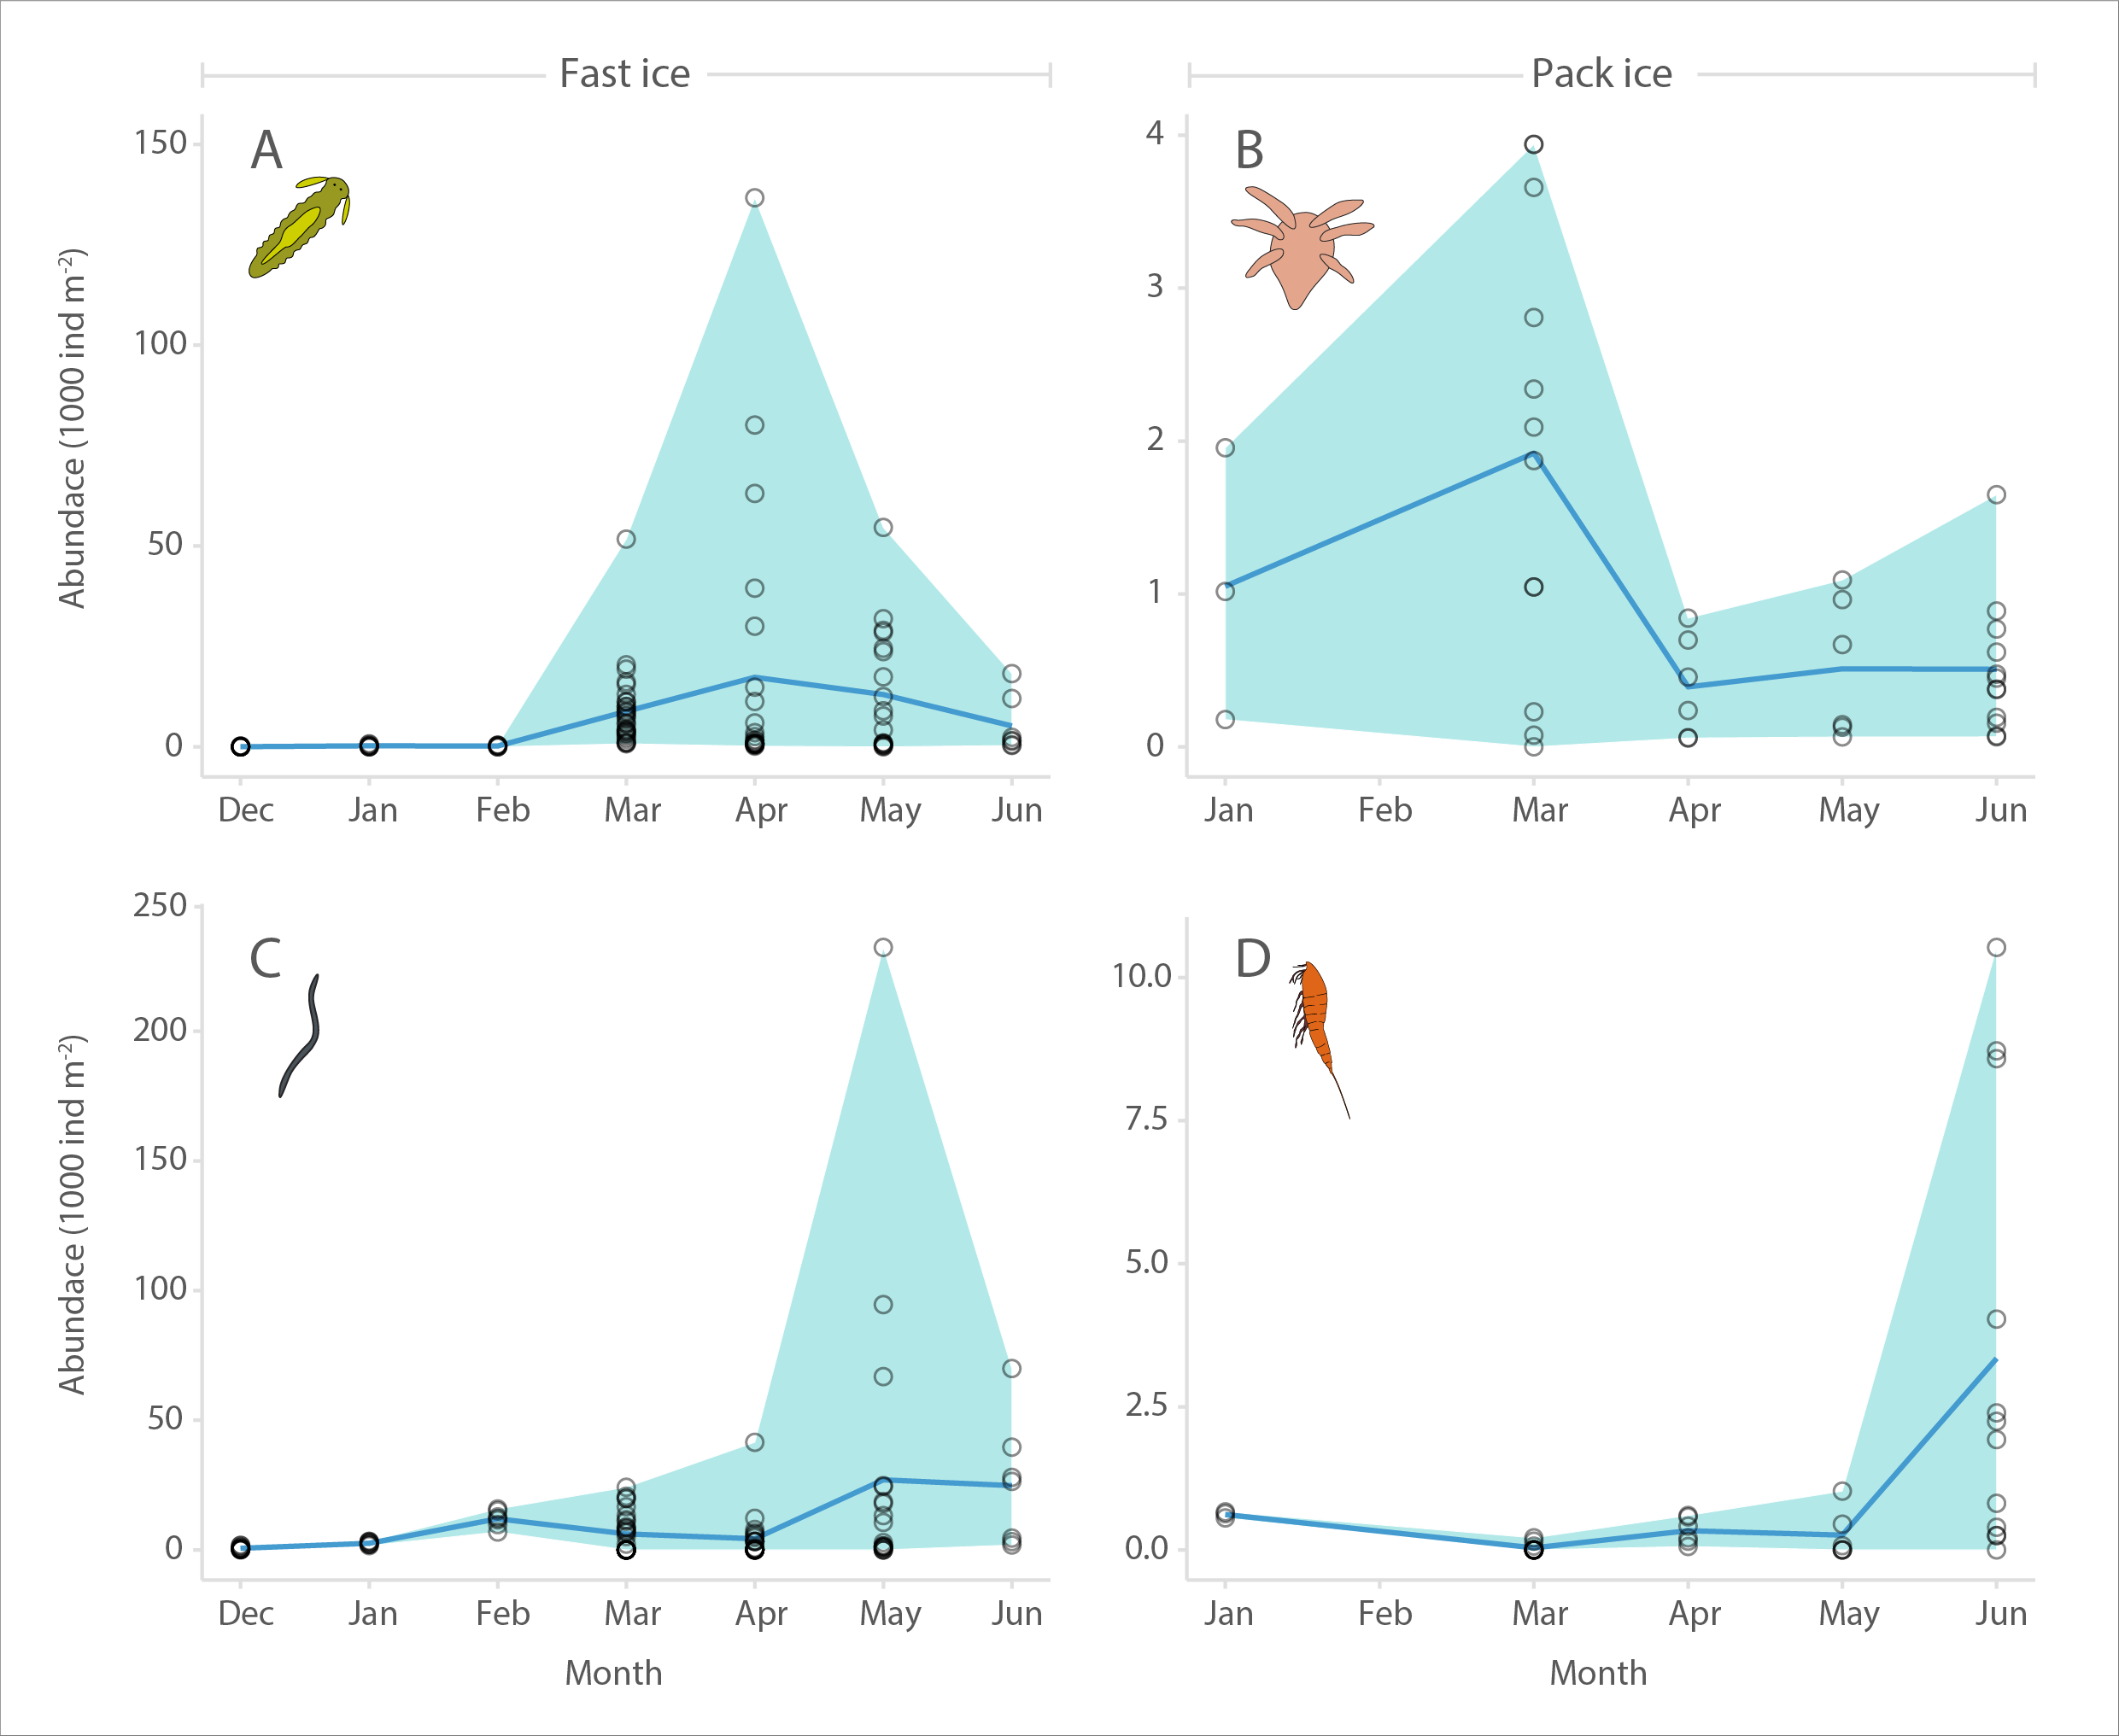
Seasonal abundance (1000 individuals m- 2) of sea ice meiofauna at landfast sea ice (Barrow, 2005-2006, A and C) and pack ice (North of Svalbard, 2015, B and D). A and B show larval stages (polychaete juveniles and nauplii, respectively), while C and D show nematodes and harpacticoid copepods, respectively. Circles represent individual cores (n = 107 for A and C, and 39 for B and D), shading the extent of minimum as well as maximum values, and blue line indicates mean values. STATE OF THE ARCTIC MARINE BIODIVERSITY REPORT - <a href="https://arcticbiodiversity.is/findings/sea-ice-biota" target="_blank">Chapter 3</a> - Page 43 - Figure 3.1.5 From the report draft: "In addition to showing composition and peak abundance ranges, we illustrate the phenology of ice meiofauna over the ice-covered season in the entire combined data set. For this purpose, the data were normalized to the daylight hours at each location during the date of sampling using R package geosphere (Hijmans 2015) and a method described in Forsythe et al. (1995). This was necessary, because ‘spring’ arrives earlier at lower latitudes than at higher latitudes, so that using month or day of year would obscure the pan-Arctic integration of the data. Other influential factors such as snow depth, ice thickness and nutrient concentrations were not accounted for in this analysis."