 CAFF - Arctic Biodiversity Data Service (ABDS)
Conservation of Arctic Flora and Fauna (CAFF)
Type of resources
Available actions
Topics
Keywords
Contact for the resource
Provided by
Years
Formats
Representation types
Update frequencies
status
Service types
Scale
-
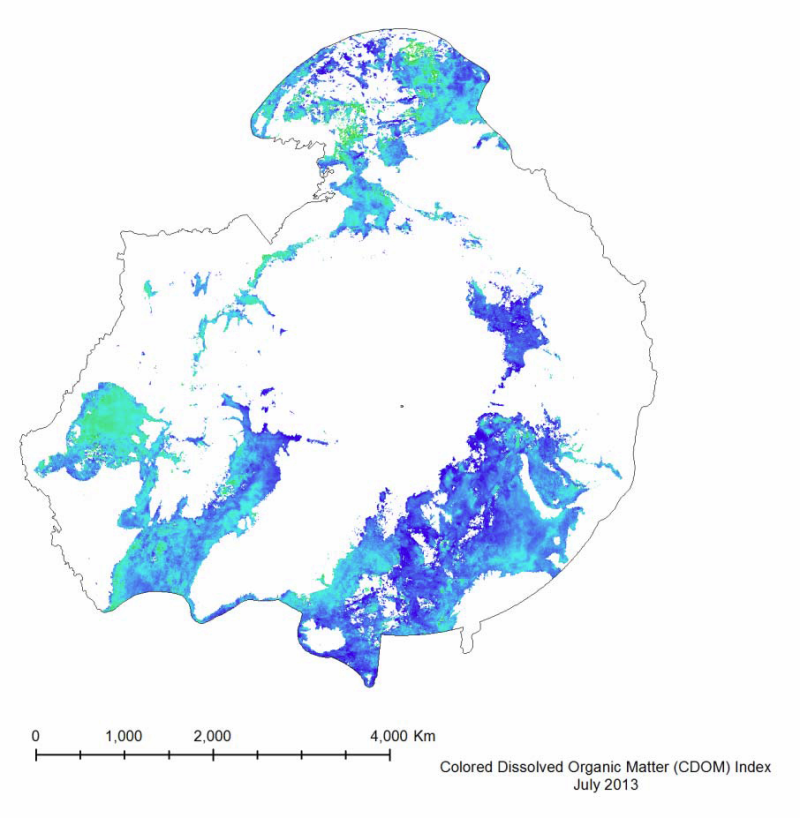
Colored Dissolved Organic Matter (CDOM) is a measurement of the absorption of light in the UV and visible spectrum by the colored components of dissolved organic carbon. It is essentially the yellow substance in water as a result of decaying detritus. It is important to measure because it limits the amount of sunlight penetration, and thus restricts the growth of plankton populations. It is measured in a unit-less CDOM index. Data generated as part of CAFFs Circumpolar Biodiversity Monitoring Program (CAFF) and its Land Cover Change Initiative (LCC) Trends visible in the MODIS dataset show an overall decrease in the mean CDOM from 2003 to 2012, with a percent change of -31.7%. This trend can be seen in Figure 40. This decrease corresponds to the increase in total yearly primary productivity (Figure 30), as a decrease in the CDOM allows for sunlight to penetrate deeper into the water, boosting chlorophyll concentrations and thus primary productivity.
-
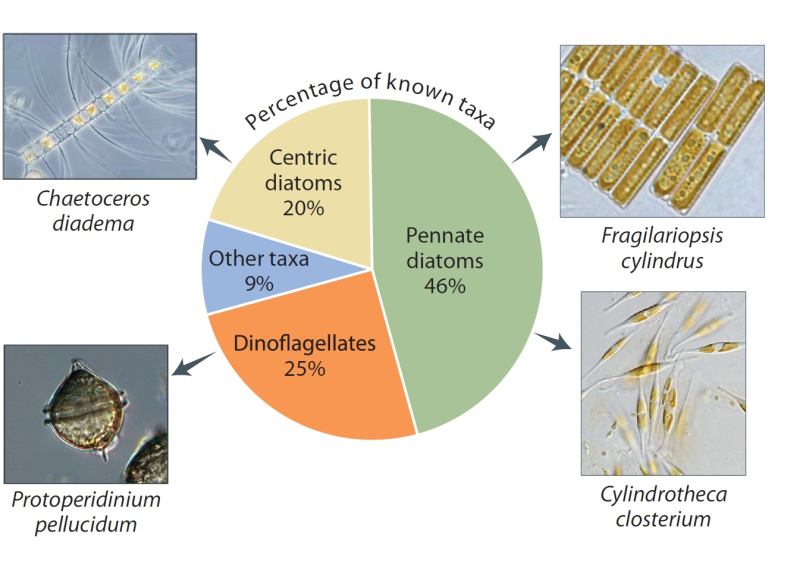
The number of species depends partly on what has been studied. Proportions vary somewhat around the Arctic, but diatoms and dinoflagellates are the most diverse groups everywhere. The greatest sampling effort has been in the Laptev Sea, Hudson Bay, and the Norwegian sector of the Barents Sea. Species shown are among the most commonly recorded. Published in the Life Linked to Ice released in 2013, page 26. Life Linked to Ice: A guide to sea-ice-associated biodiversity in this time of rapid change. CAFF Assessment Series No. 10. Conservation of Arctic Flora and Fauna, Iceland. ISBN: 978-9935-431-25-7.
-
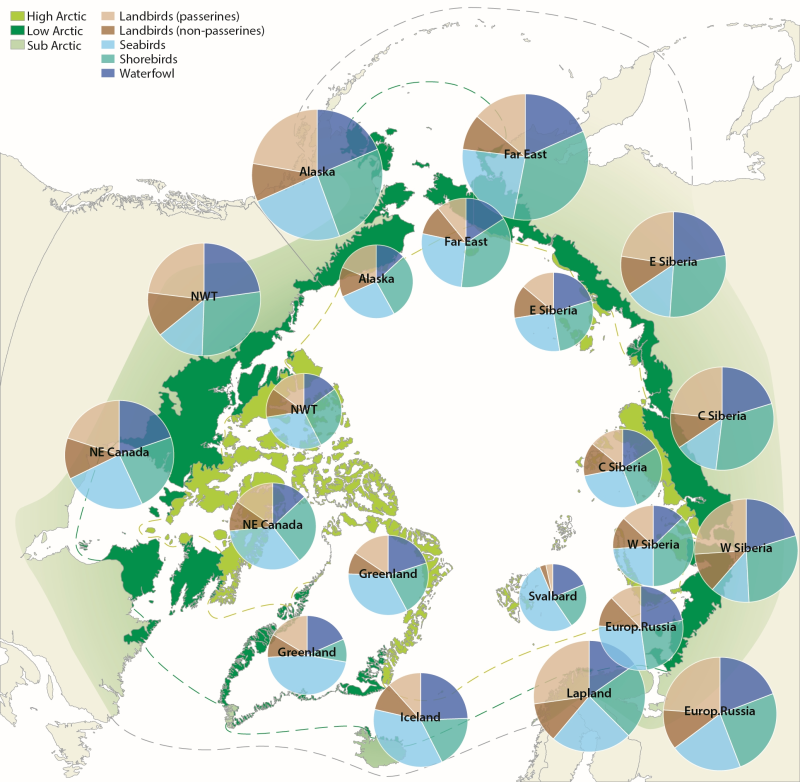
Figure 4.1. Avian biodiversity in different regions of the Arctic. Charts on the inner circle show species numbers of different bird groups in the high Arctic, on the outer circle in the low Arctic. The size of the charts is scaled to the number of species in each region, which ranges from 32 (Svalbard) to 117 (low Arctic Alaska). CAFF 2013. Arctic Biodiversity Assessment. Status and Trends in Arctic biodiversity. Conservation of Arctic Flora and Fauna, Akureyri - Birds (Chapter 4) page 145
-
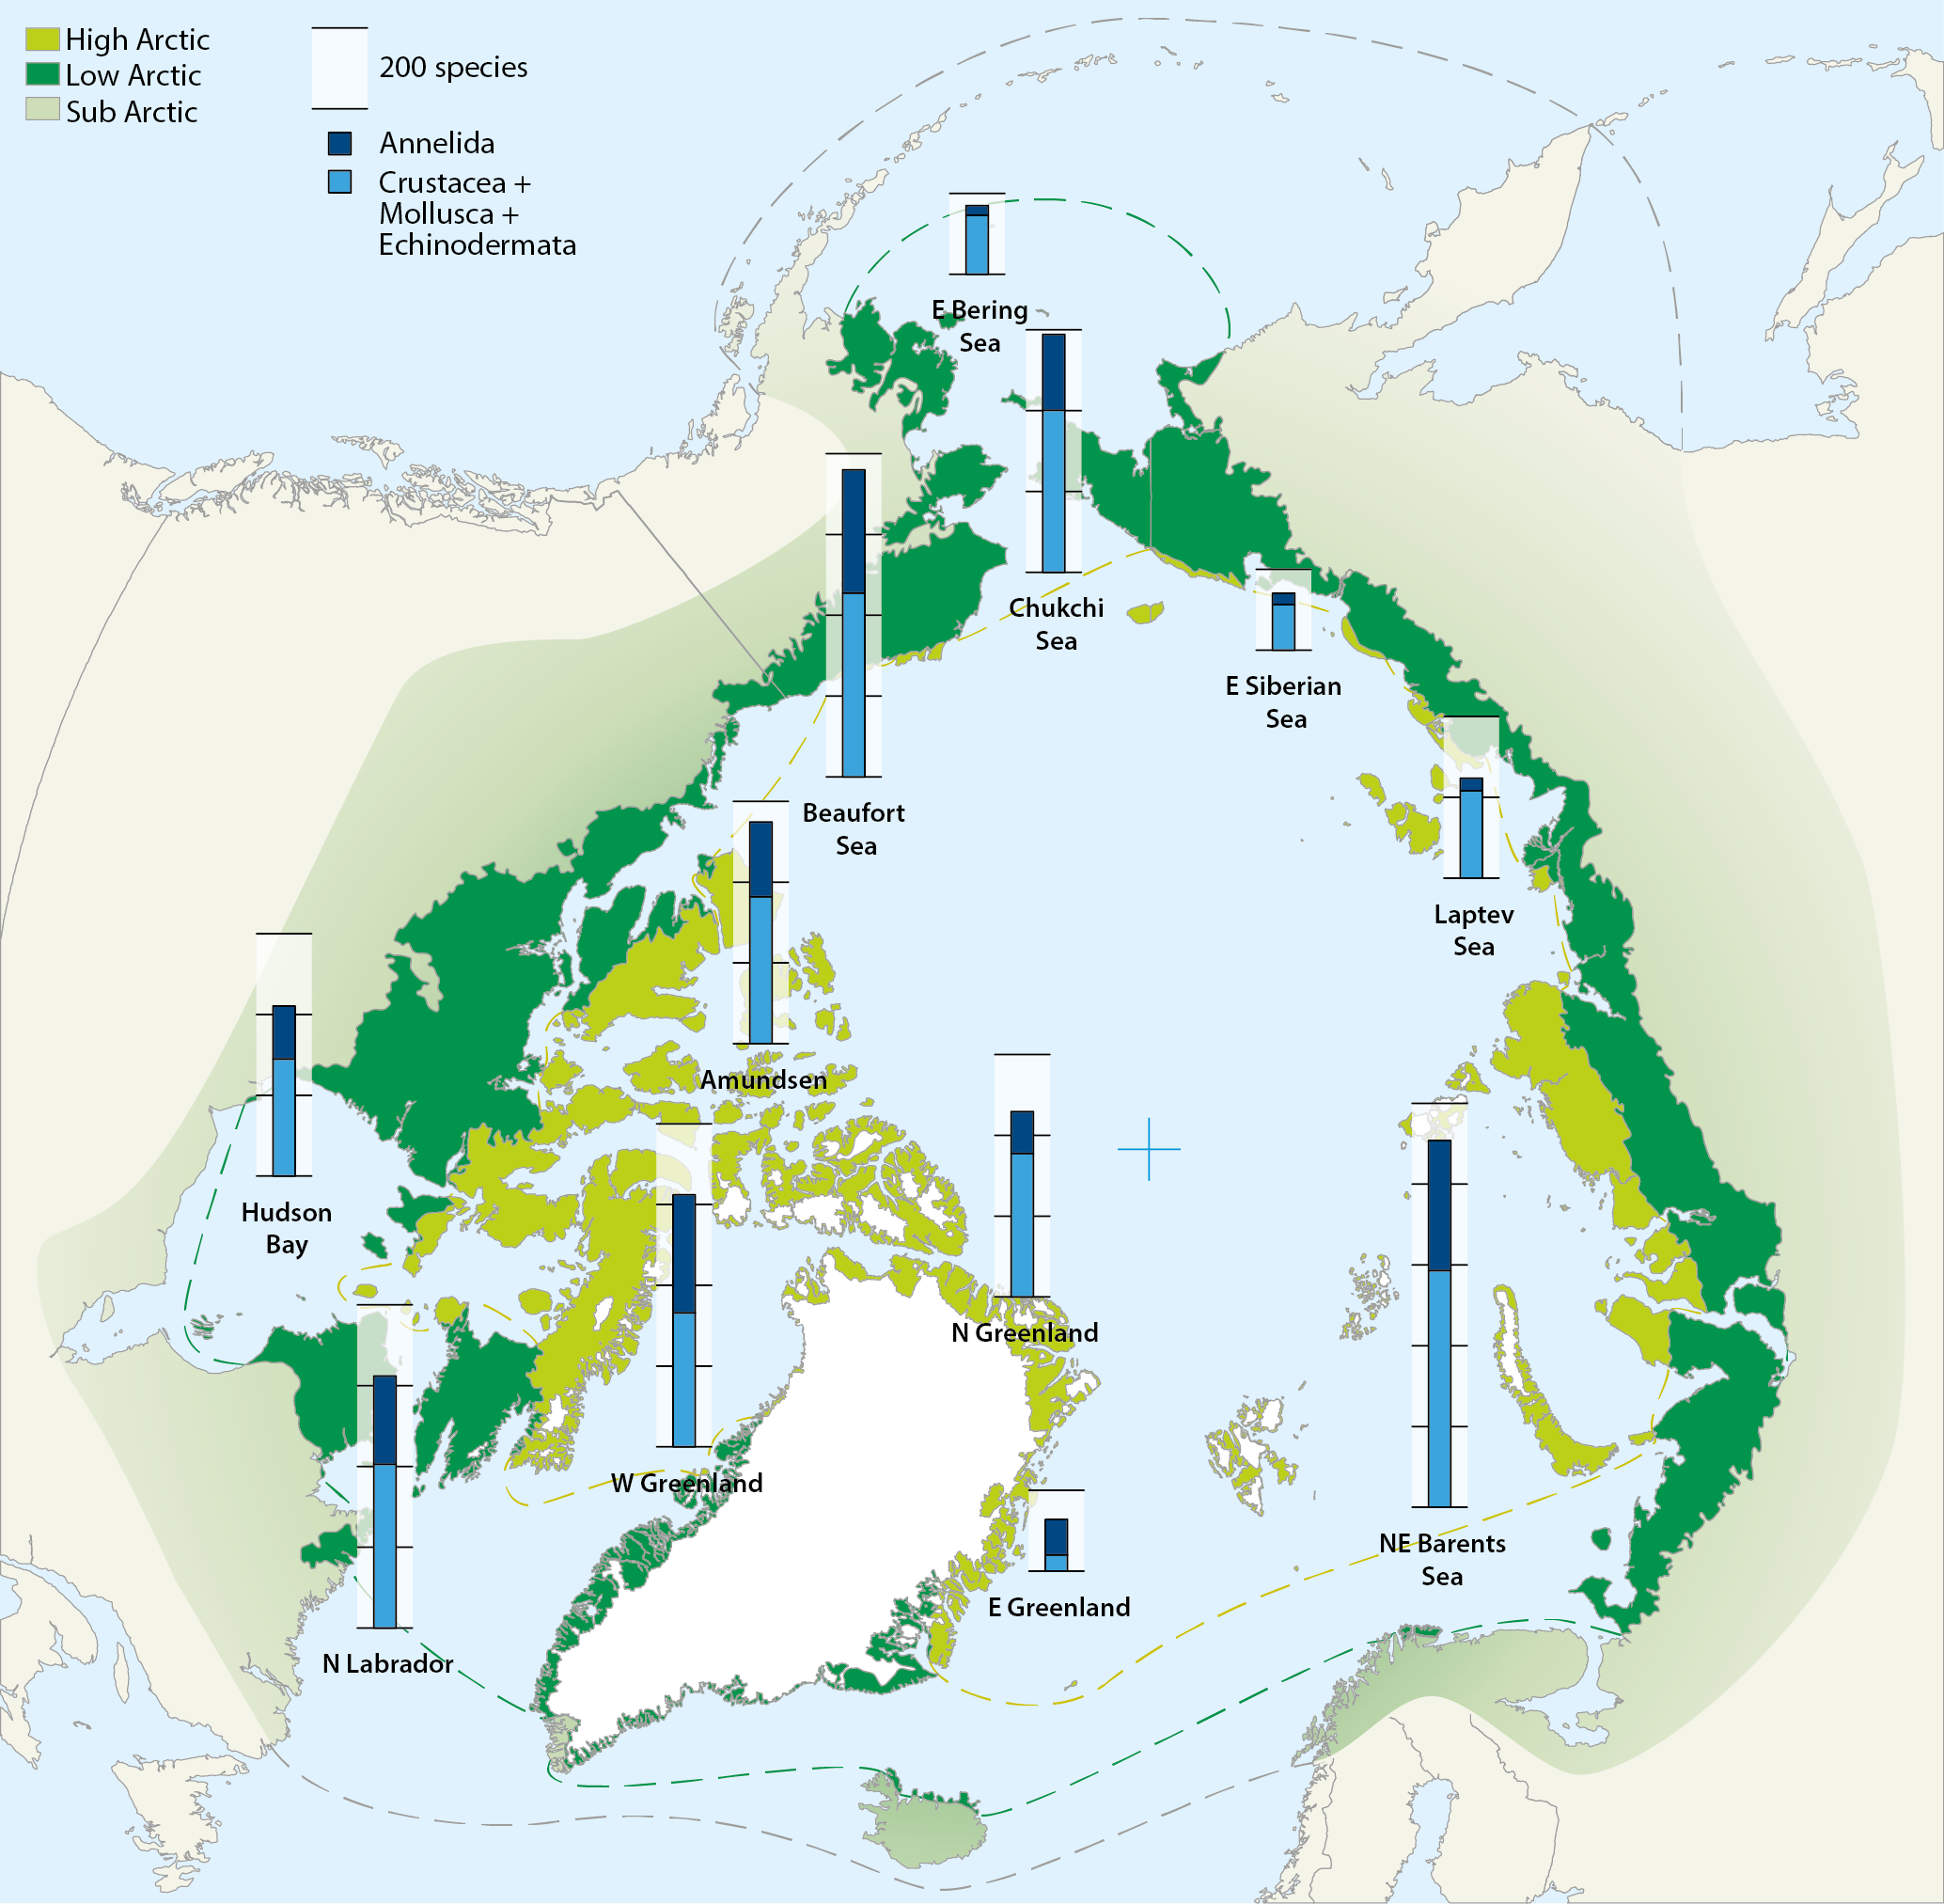
Map of the Arctic Ocean with superimposed stacked bars representing species numbers of macrozoobenthos from different shelf sea areas: Crustacea+Mollusca+Echinodermata (blue) and Annelida (black). Compiled by Piepenburg et al. (2011). Conservation of Arctic Flora and Fauna, CAFF 2013 - Akureyri . Arctic Biodiversity Assessment. Status and Trends in Arctic biodiversity. - Marine Invertebrates(Chapter 8) page 282
-
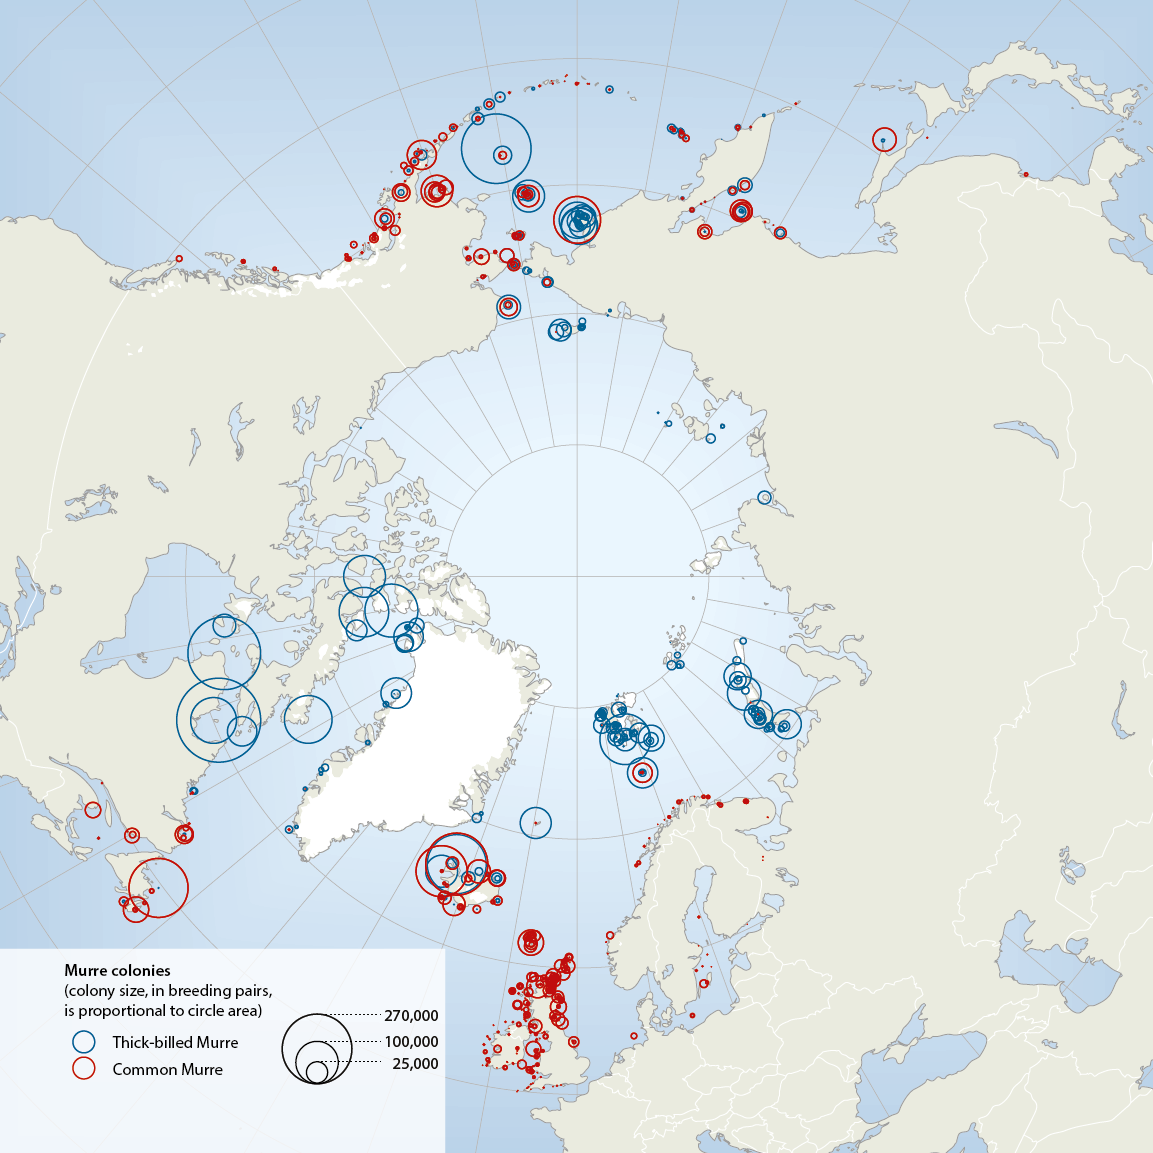
The two species of murres, thick-billed Uria lomvia and common U. aalge, both have circumpolar distributions, breeding in Arctic, sub-Arctic and temperate seas from alifornia and N Spain to N Greenland, high Arctic Canada, Svalbard, Franz Josef Land and Novaya Zemlya (Box 4.3 Fig. 1). Conservation of Arctic Flora and Fauna, CAFF 2013 - Akureyri . Arctic Biodiversity Assessment. Status and Trends in Arctic biodiversity. - Birds(Chapter 4) page 163
-
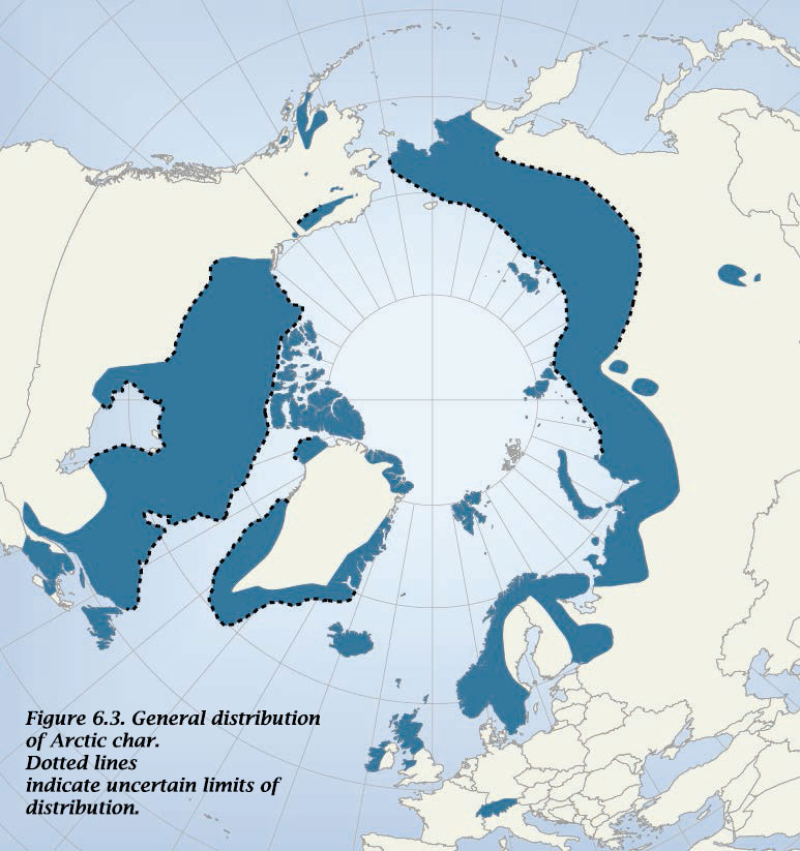
Circumpolar distribution of arctic char species complex Salvelinus alpinus, and related species. - <a href="http://www.caff.is/assessment-series/10-arctic-biodiversity-assessment/211-arctic-biodiversity-assessment-2013-chapter-6-fishes" target="_blank"> Arctic Biodiversity Assessment, Chapter 6: Fishes</a>
-
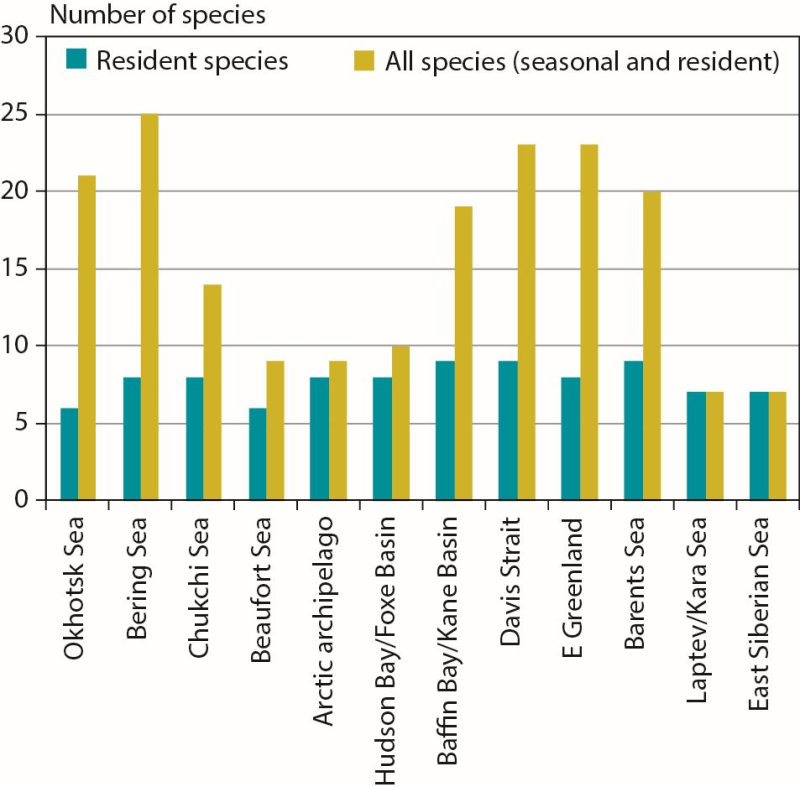
Number of marine mammal species in Arctic marine regions classified by resident species (n = 11 total) or all species (including seasonal visitors, n = 35 total). CAFF 2013. Arctic Biodiversity Assessment. Status and Trends in Arctic biodiversity. Conservation of Arctic Flora and Fauna, Akureyri - Mammal (Chapter 3) page 84
-
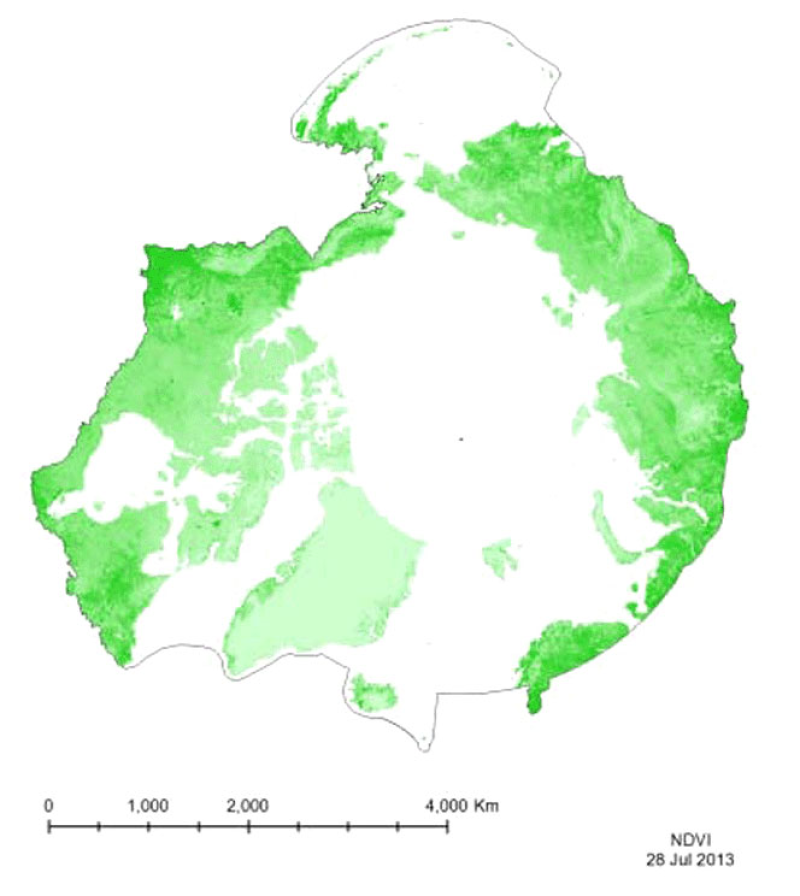
Vegetation indices quantify the concentrations of green leaf vegetation (chlorophyll)around the globe, in an attempt to monitor and correlate vegetation health and stress. The MODIS vegetation products include the Normalized Difference Vegetation Index (NDVI)and an Enhanced Vegetation Index (EVI). Included in the MOD13C1 product is both NDVIand EVI, so both have been provided for the CAFF Dedicated Pan-Arctic Satellite RemoteSensing Products and Distribution System. These indices come in a variety of resolutions,but MTRI has provided a monthly global composite on a 0.05° Climate Model GRID(CMG).
-
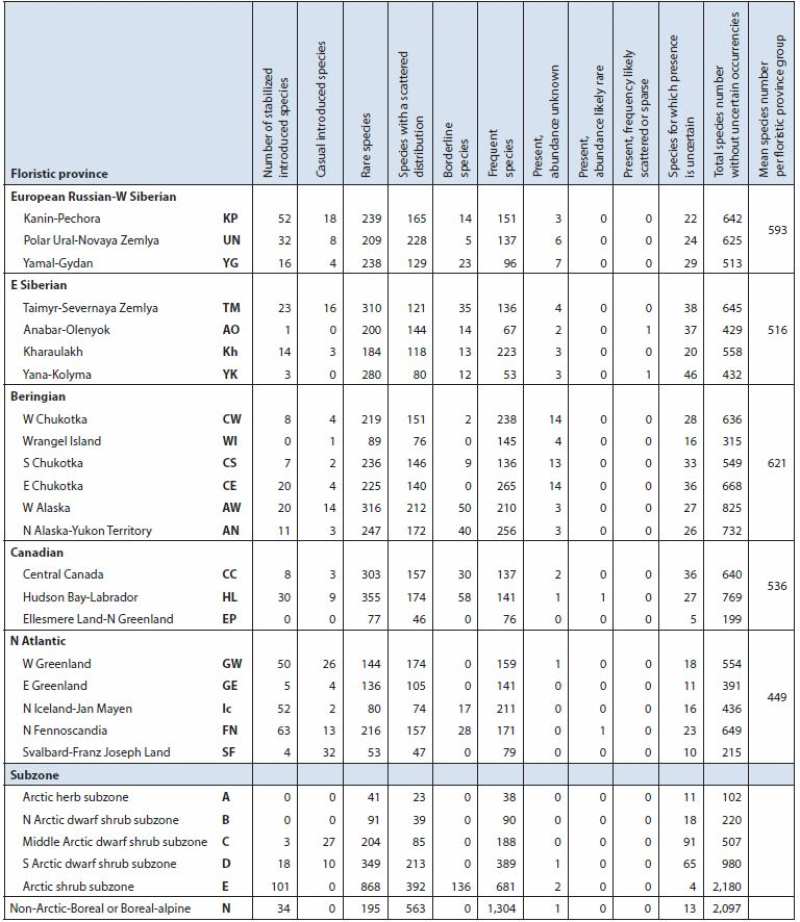
Summary of Arctic vascular plant species and distribution by Arctic flora province and subzone based on Elven (2007). Arctic floristic provinces, subzones (A-E), neighbouring boreal or boreal-alpine zone (N) and distribution derived from Elven (2007). Arctic Biodiversity Assessment - Table 9.1 Conservation of Arctic Flora and Fauna, CAFF 2013 - Akureyri . Arctic Biodiversity Assessment. Status and Trends in Arctic biodiversity. - Plants(Chapter 9) page 321
-
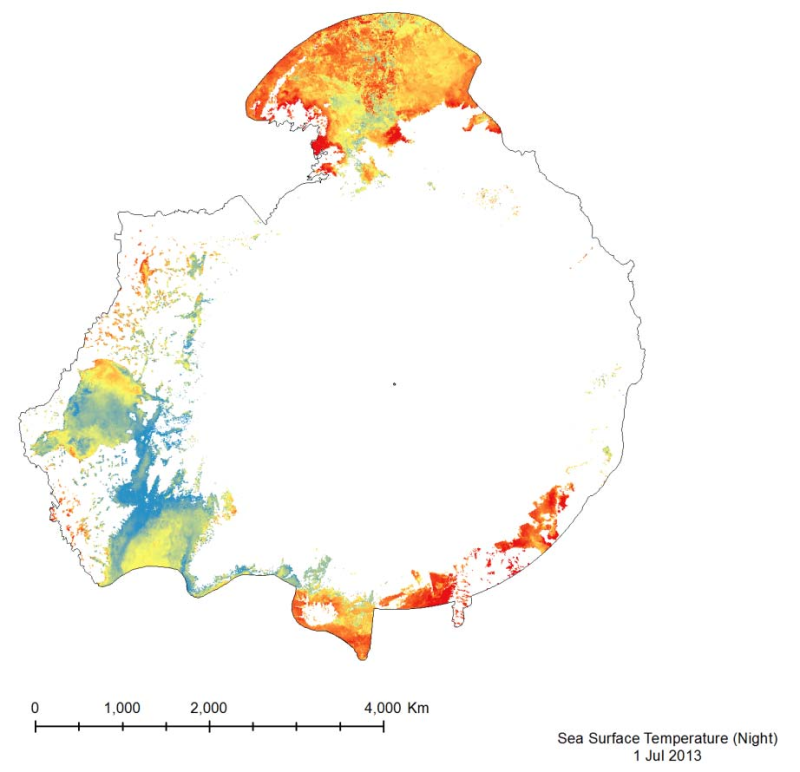
The MODIS Sea Surface Temperature (SST) product provided is a 4km spatialresolution monthly composite made from nighttime measurements from the Aqua Satellite.The nighttime measurements are used to collect a consistent temperature measurement that isunaffected by the warming of the top layer of water by the sun.