 CAFF - Arctic Biodiversity Data Service (ABDS)
Conservation of Arctic Flora and Fauna (CAFF)
Type of resources
Available actions
Topics
Keywords
Contact for the resource
Provided by
Years
Formats
Representation types
Update frequencies
status
Service types
Scale
-
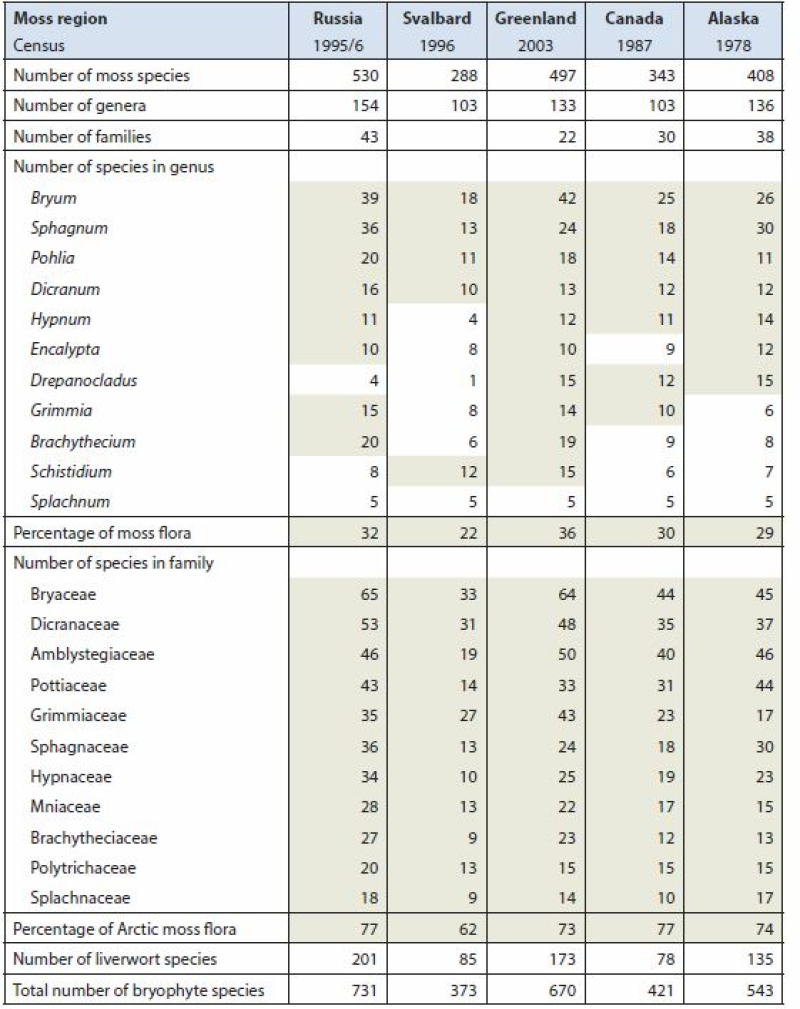
Arctic Biodiversity Assessment (ABA) 2013. Table 9.5. Species numbers of species-rich moss genera and families. Numbers highlighted in grey fields are used in calculating the percentage of the total moss flora. Listed are Splachnum, genera with at least 10 species and families with at least nine species. Conservation of Arctic Flora and Fauna, CAFF 2013 - Akureyri . Arctic Biodiversity Assessment. Status and Trends in Arctic biodiversity. - Plants(Chapter 9) page 333
-
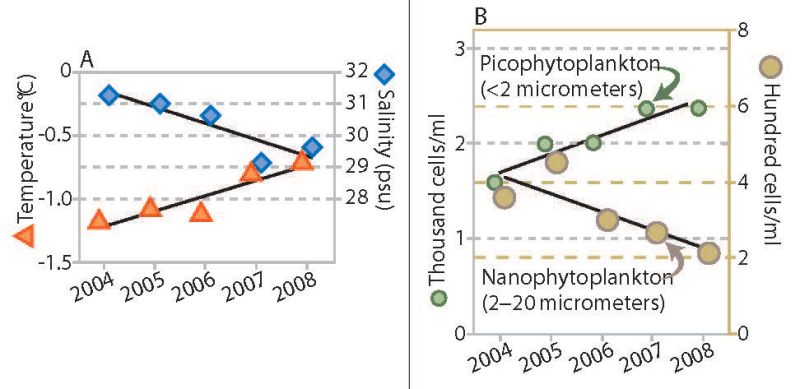
Trends in water temperature and salinity (A) and density of phytoplankton of two size ranges (B), Canada Basin, 2004 to 2008. Stratification of the water column increased throughout the Canada Basin over a recent five-year period, accompanied by a change in phytoplankton communities. The upper ocean layer showed trends of increased temperature and decreased salinity (Figure 18A), which combine to make this layer progressively less dense. The layer of water below this did not change in density over this period (not shown). The larger size class of phytoplankton (which would include diatoms) decreased in abundance, while the smaller types of plankton increased (Figure 18B). In addition to the trends shown, nutrient content in the upper ocean water layer decreased. Abundance of microbes (bacteria and similar organisms) that subsist on organic matter increased. Total phytoplankton biomass, however, remained unchanged. If this trend towards smaller species of phytoplankton and microbes is sustained, it may lead to reduced production of zooplankton, an impact that would be transmitted through the food web to birds, fish and mammals. Published in the Life Linked to Ice released in 2013, page 30. Life Linked to Ice: A guide to sea-ice-associated biodiversity in this time of rapid change. CAFF Assessment Series No. 10. Conservation of Arctic Flora and Fauna, Iceland. ISBN: 978-9935-431-25-7.
-
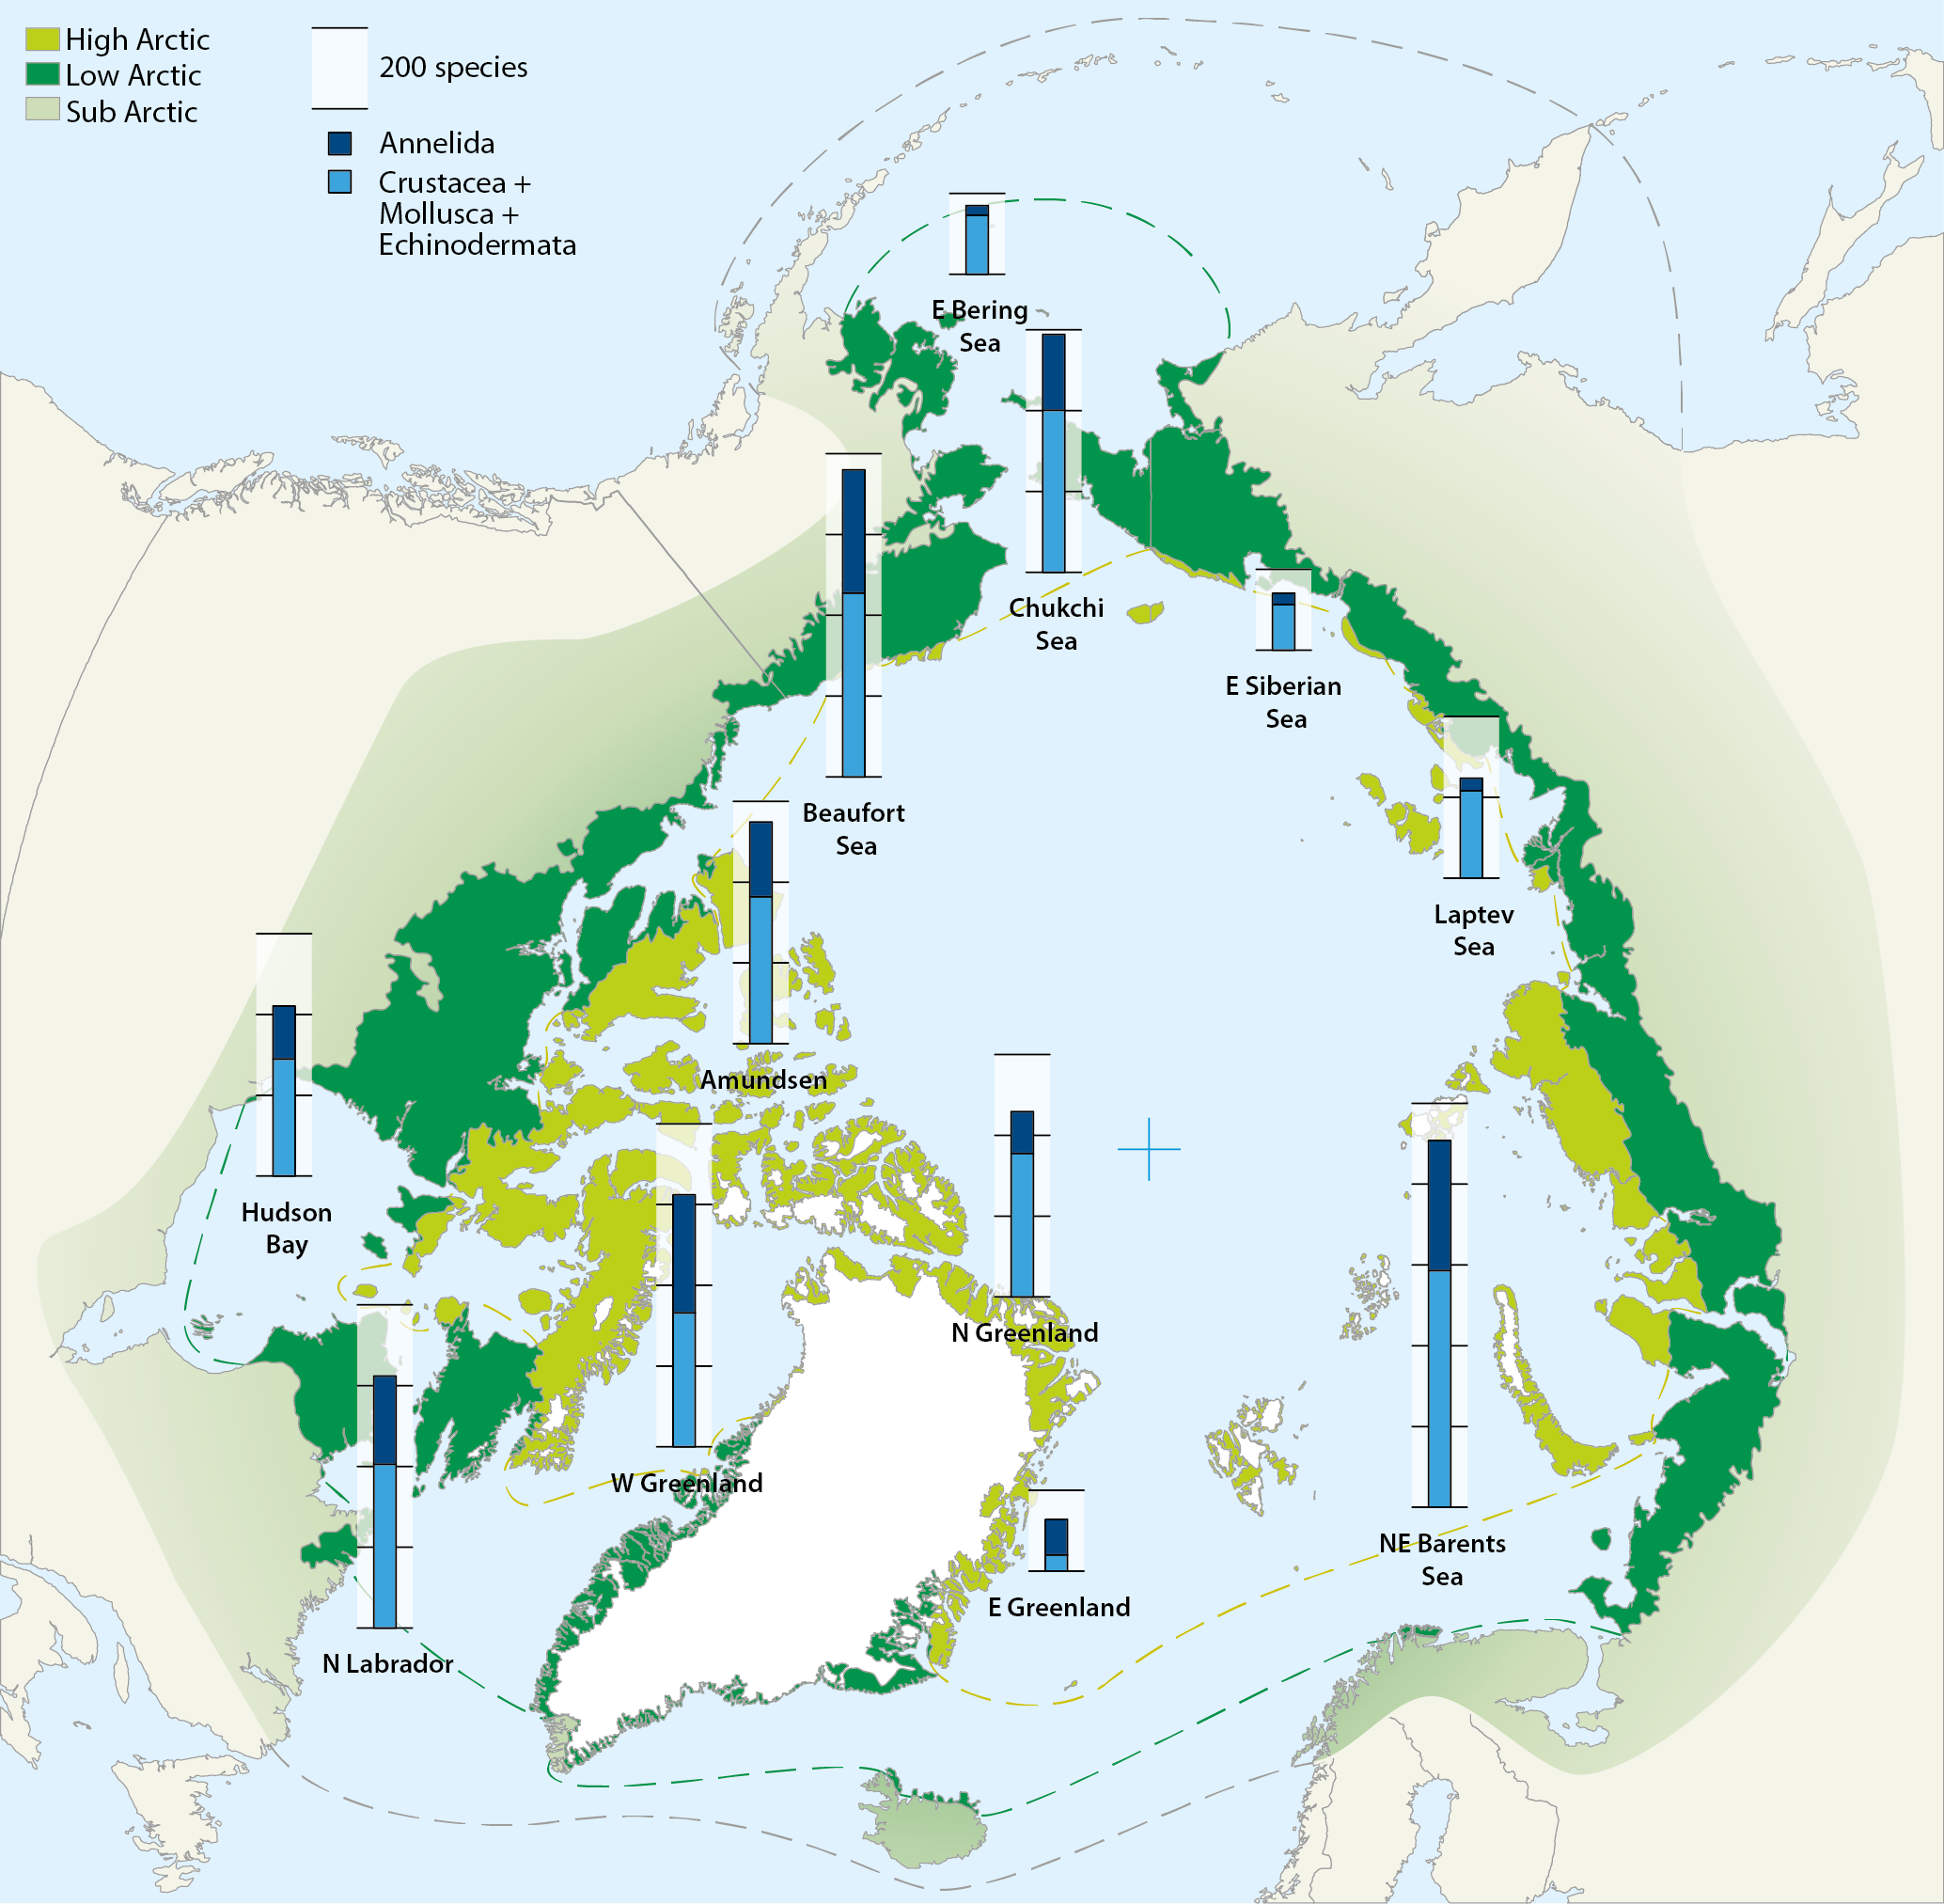
Map of the Arctic Ocean with superimposed stacked bars representing species numbers of macrozoobenthos from different shelf sea areas: Crustacea+Mollusca+Echinodermata (blue) and Annelida (black). Compiled by Piepenburg et al. (2011). Conservation of Arctic Flora and Fauna, CAFF 2013 - Akureyri . Arctic Biodiversity Assessment. Status and Trends in Arctic biodiversity. - Marine Invertebrates(Chapter 8) page 282
-
Extensive oil and gas activity has occurred in the Arctic, primarily land-based, with Russia extracting 80% of the oil and 99% of the gas to date (AMAP 2008). Furthermore, the Arctic still contains large petroleum hydrocarbon reserves and potentially holds one fifth of the world’s yet undiscovered resources, according to the US Geological Survey (USGS 2008) (Fig. 14.4). While much of the currently known Arctic oil and gas reserves are in Russia (75% of oil and 90% of gas; AMAP 2008), more than half of the estimated undiscovered Arctic oil reserves are in Alaska (offshore and onshore), the Amerasian Basin (offshore north of the Beaufort Sea) and in W and E Greenland (offshore). More than 70% of the Arctic undiscovered natural gas is estimated to be located in the W Siberian Basin (Yamal Peninsula and offshore in the Kara Sea), the E Barents Basin and in Alaska (offshore and onshore) (AMSA 2009). Associated with future exploration and development, each of these regions would require vastly expanded Arctic marine operations, and several regions such as offshore Greenland would require fully developed Arctic marine transport systems to carry hydrocarbons to global markets. In this context, regions of high interest for economic development face cumulative environmental pressure from anthropogenic activities such as hydrocarbon exploitation locally, together with global changes associated with climatic and oceanographic trends. Conservation of Arctic Flora and Fauna, CAFF 2013 - Akureyri . Arctic Biodiversity Assessment. Status and Trends in Arctic biodiversity. - Marine ecosystems (Chapter 14 - page 501). Figure adapted from the USGS
-
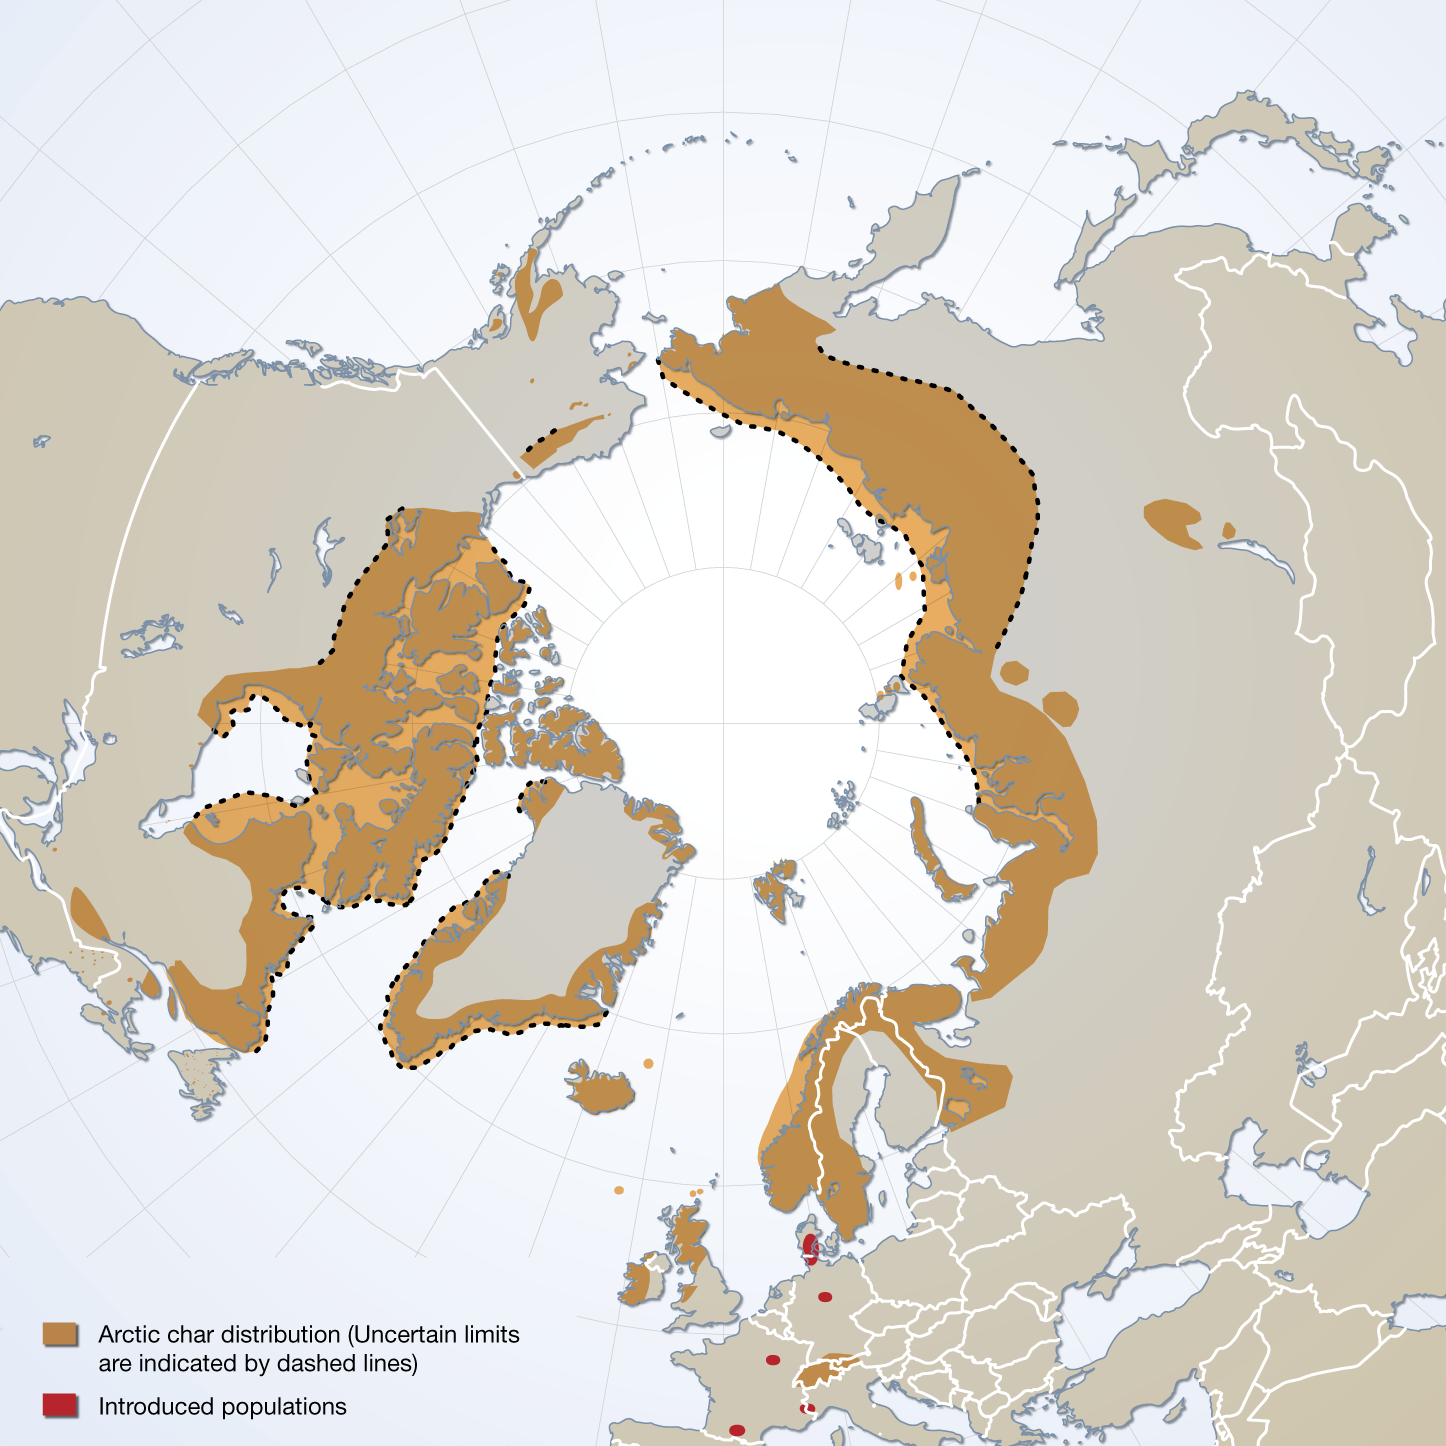
The distribution of Arctic char species complex, sensu stricto, and the location of introduced populations. Published in the Arctic Biodiversity trends 2010, Indicator #06 Arctic char, page 41 - released in May 2010
-
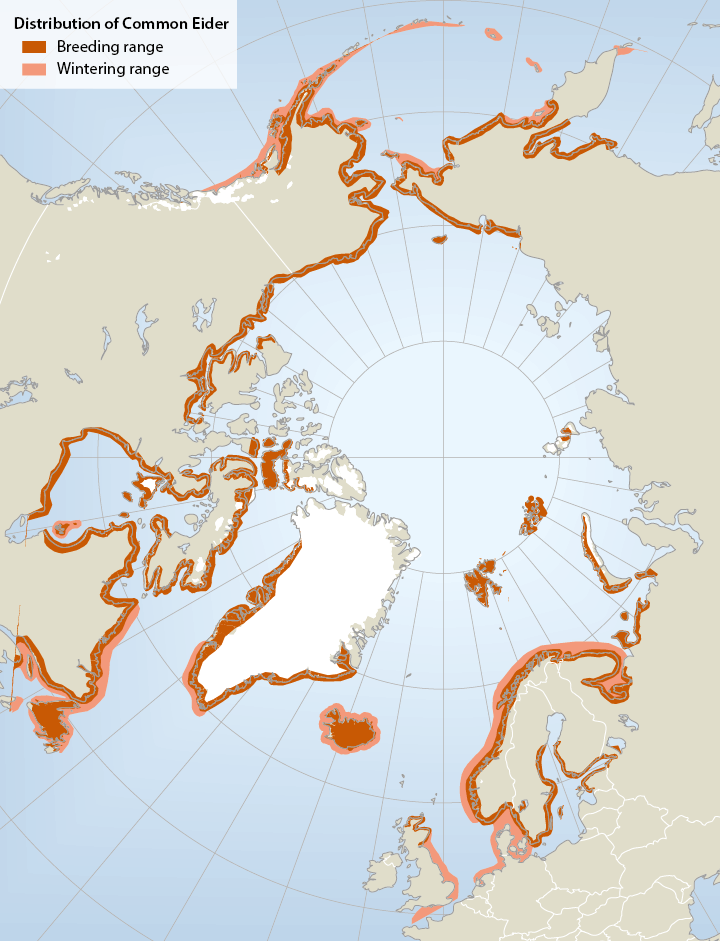
Breeding and wintering range of common eiders Somateria mollissima in the circumpolar region (not all southern breeding areas included).The common eider Somateria mollissima has a circumpolar distribution breeding mainly on small islands in Arctic and boreal marine areas in Alaska (Bering Sea region), Canada, Greenland, Iceland, N Europe and the Barents Sea region. In mainland Russia, there is a gap in distribution from the Yugorski Peninsula (Kara Sea) to Chaunskaya Bay in E Siberia Important wintering areas include the Gulf of Alaska/Bering Sea/Aleutian region, SE Canada, SW Greenland, Iceland and NW Europe. Six or seven subspecies are recognized, of which four occur in North America. - <a href="http://arcticbiodiversity.is/the-report/chapters/birds" target="_blank">Arctic Biodiversity Assessment. Status and Trends in Arctic biodiversity. - Birds(Chapter 4) page 150</a>
-
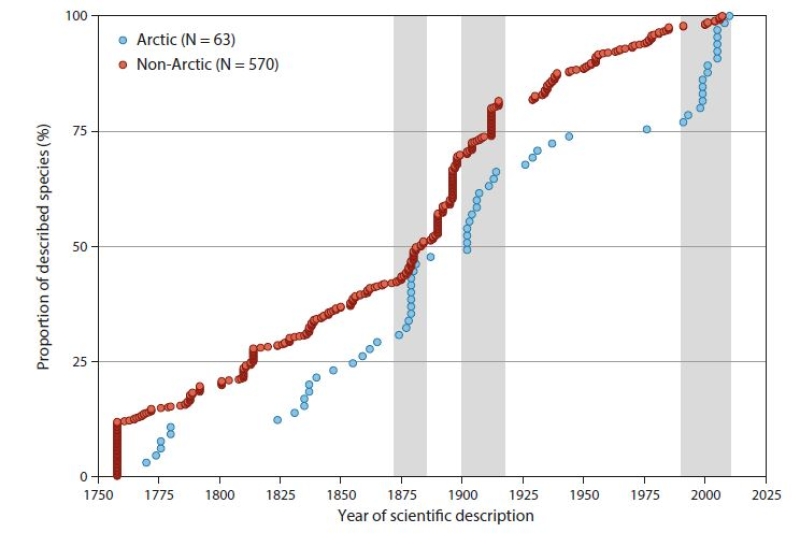
Cumulative numbers of marine fish diversity (n = 633, Appendix 6.2) in the Arctic Ocean and adjacent seas (AOAS) from 1758 to the present. Species are broadly grouped according to zoogeographic pattern (cf. Section 6.3.1): Arctic (A, blue symbols) and non-Arctic (Σ AB, B, WD, red symbols). Grey bars denote periods with many descriptions of new Arctic species. Note that 75% of the non-Arctic species known to science were described by 1912, whereas the same proportion for Arctic species was only reached in 1976. See text for further information. Conservation of Arctic Flora and Fauna, CAFF 2013 - Akureyri . Arctic Biodiversity Assessment. Status and Trends in Arctic biodiversity. - Fishes(Chapter 6) page 220
-
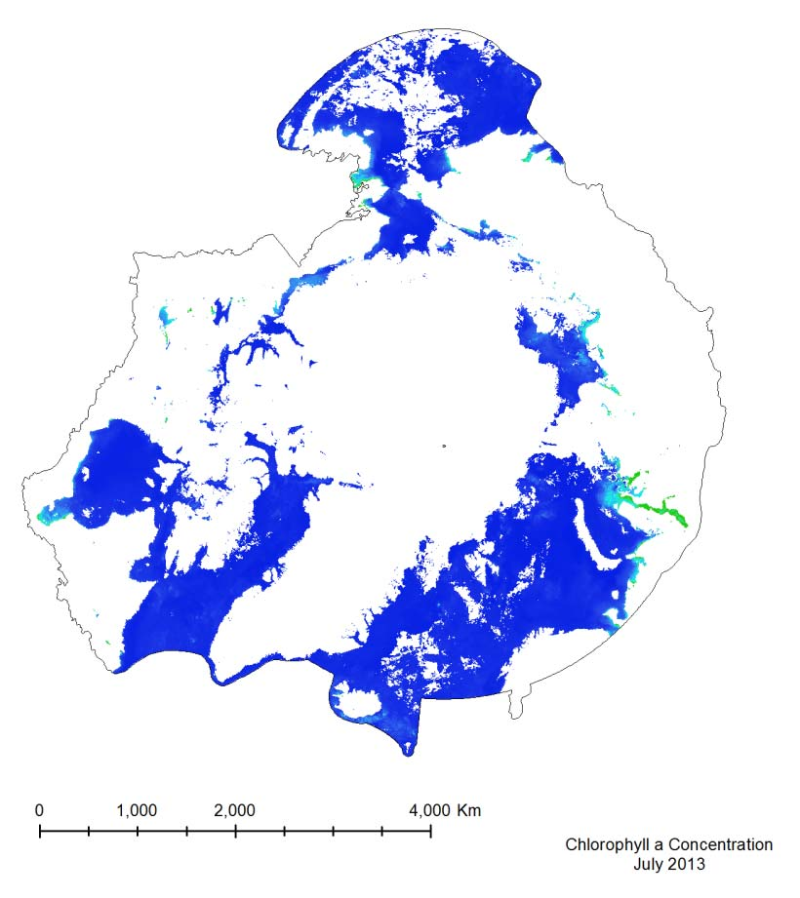
The MODIS marine chlorophyll a product provided, similar to SST, is a 4 km global monthly composite based on smaller resolution daily imagery compiled by NASA. The imagery is reliant on clear ocean (free of clouds and ice) so only months from March to October have been provided, as the chlorophyll levels in the Arctic diminish during the winter months, when sea ice is prevalent. The marine chlorophyll a is measured in mg/m3
-
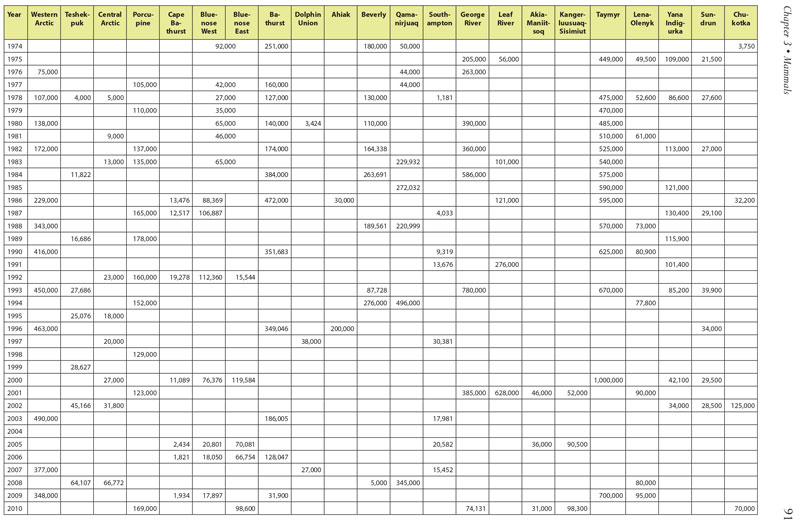
Table 3.1. Summary of historical population estimates for 22 circumpolar caribou and wild reindeer herds. Data courtesy of Circum-Arctic Rangifer Monitoring Assessment Network (CARMA) and D.E. Russell & A. Gunn; www.carmanetwork.com/display/ public/home. Data vary substantially among herds and over time in accuracy and precision, and represent only general patterns of abundance. Conservation of Arctic Flora and Fauna, CAFF 2013 - Akureyri . Arctic Biodiversity Assessment. Status and Trends in Arctic biodiversity. - Mammals(Chapter 3) page 91
-
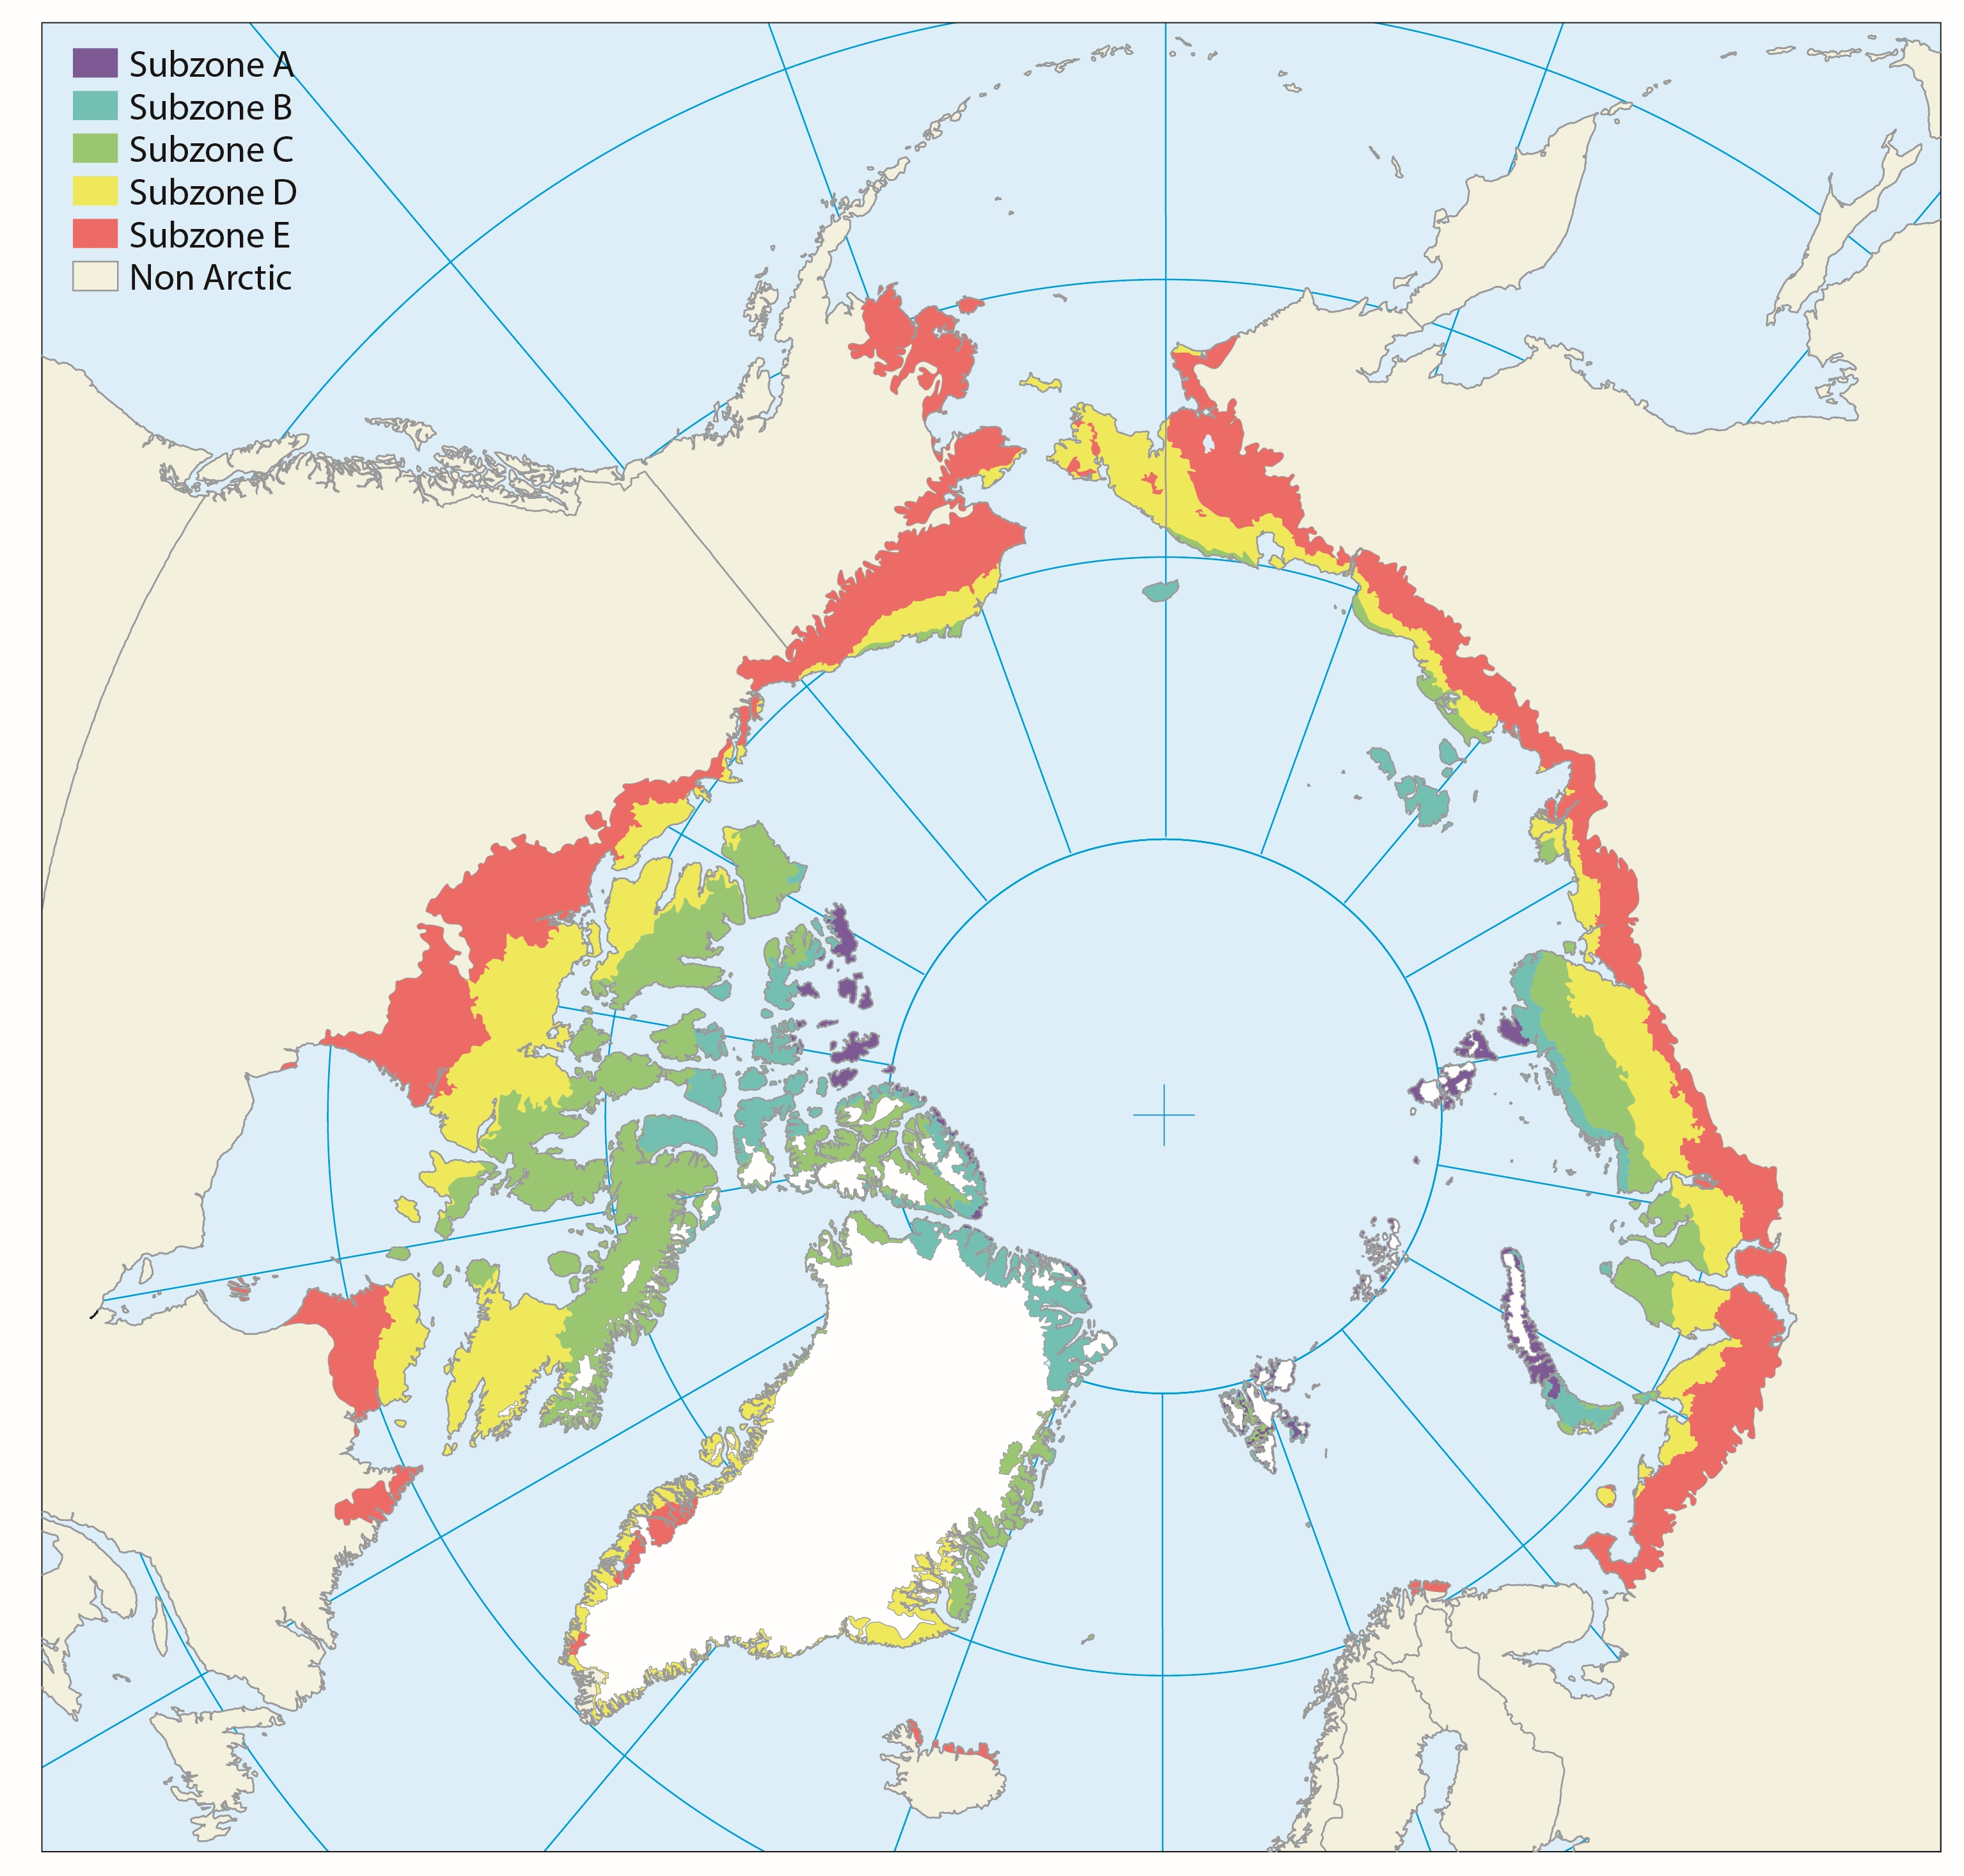
The Arctic territory is roughly subdivided along two main axes in latitudinal subzones (Fig. 9.1) and longitudinal floristic provinces (Fig. 9.2). The latitudinal northsouth axis mainly reflects the present climate gradient divided into five different subzones, which are separated according to climate and vegetation in the lowlands of each zone. Published in the Arctic Biodiversity Assessment, Chapter 9 - released in 2013