 CAFF - Arctic Biodiversity Data Service (ABDS)
Seabirds
Type of resources
Available actions
Topics
Keywords
Contact for the resource
Provided by
Representation types
Update frequencies
status
Scale
-
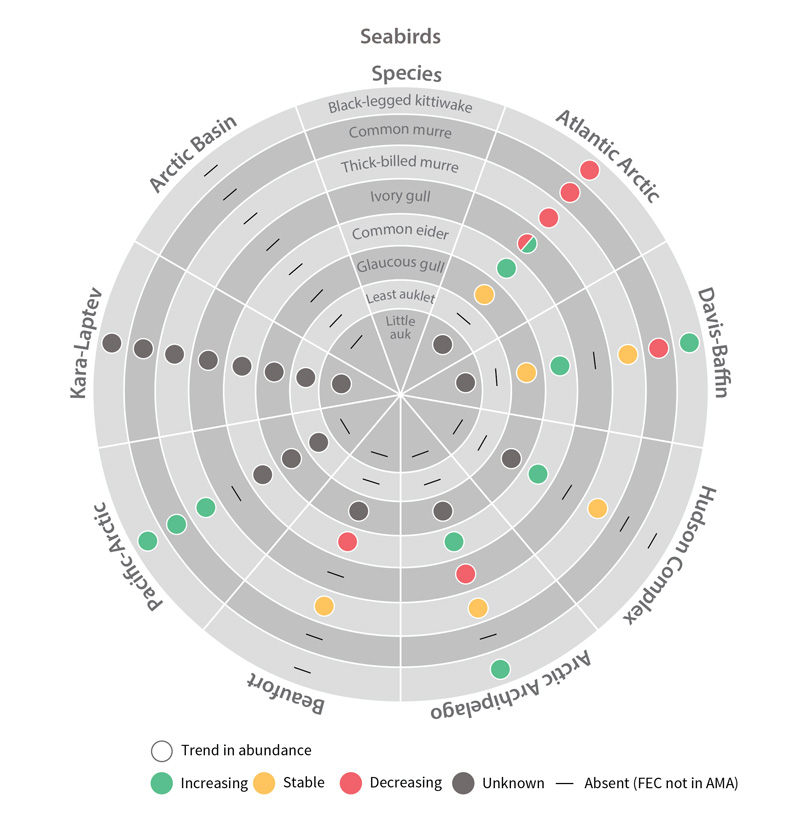
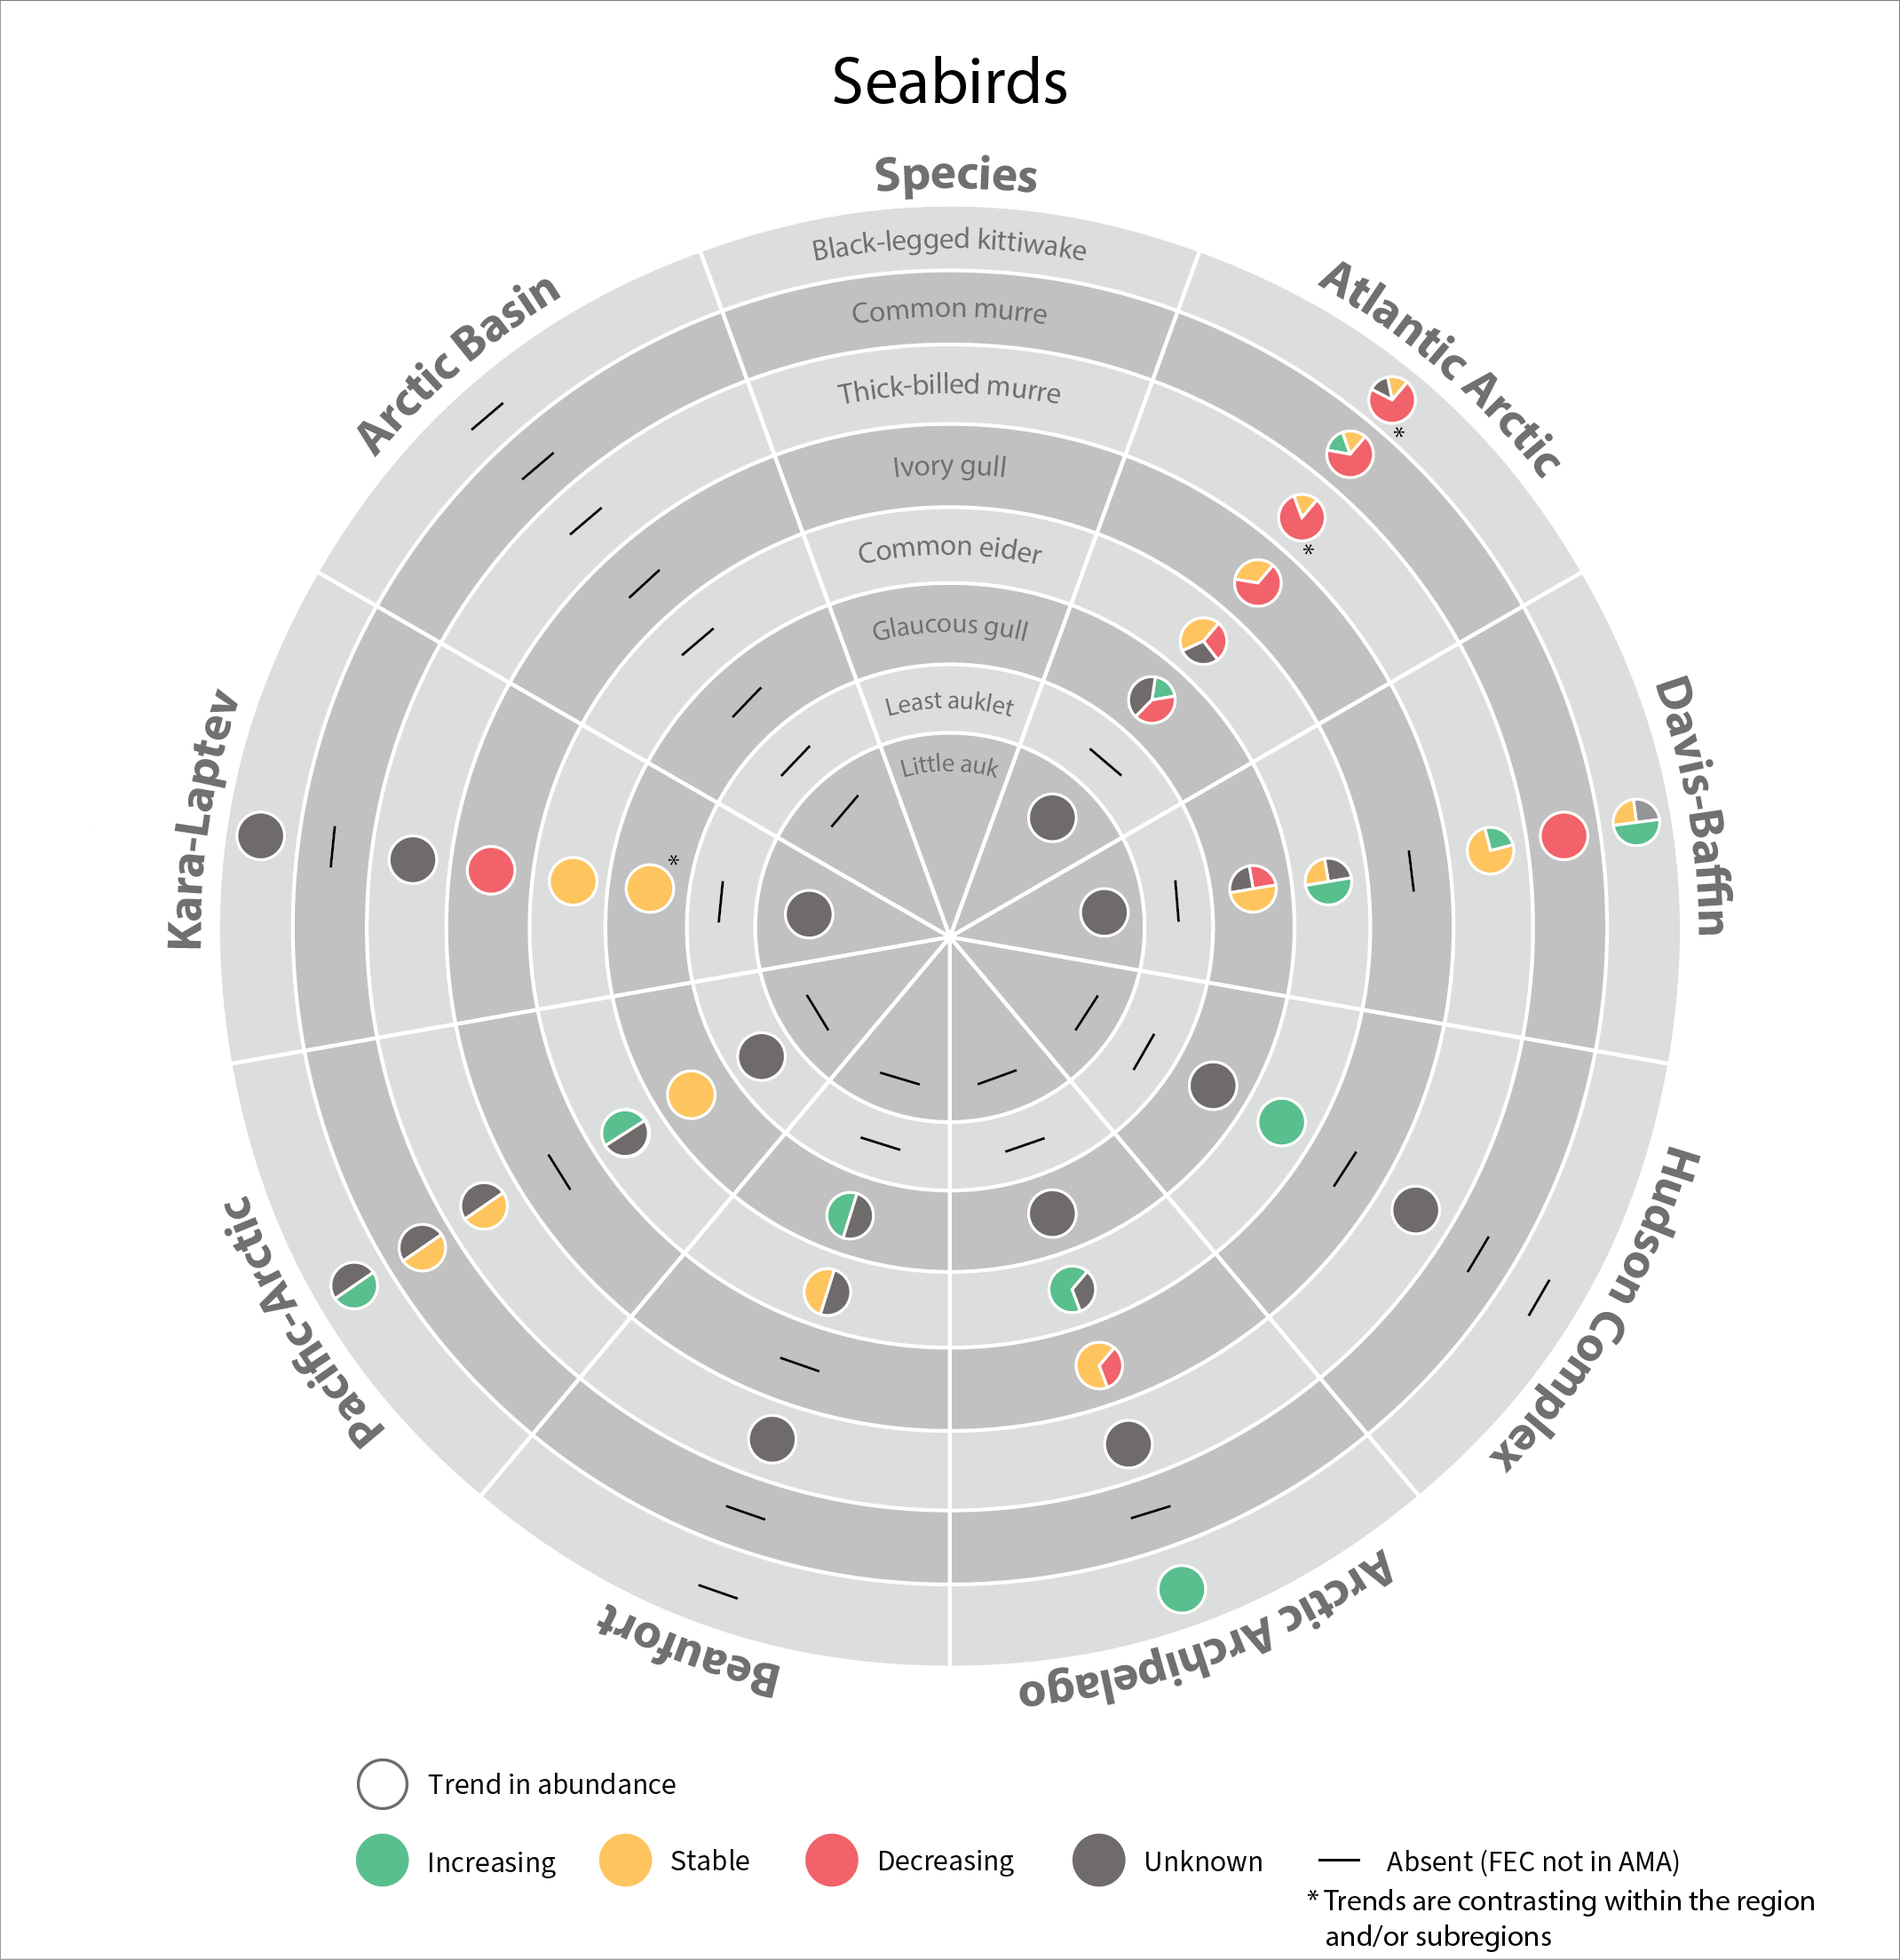
Trends in abundance of seabird Focal Ecosystem Components across each Arctic Marine Area. STATE OF THE ARCTIC MARINE BIODIVERSITY REPORT - Chapter 4 - Page 181 - Figure 4.5
-
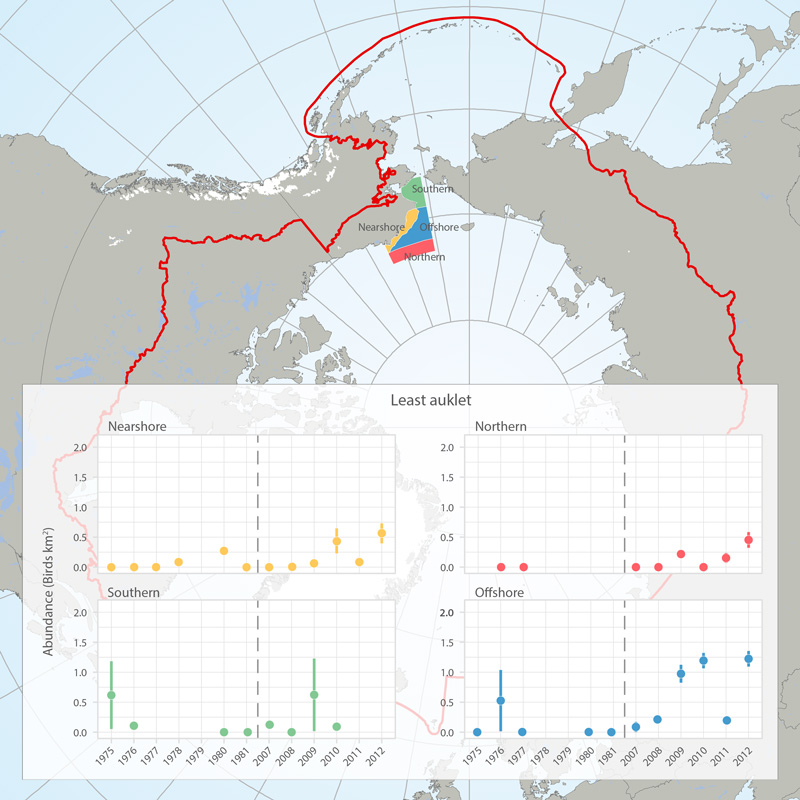
Abundance (birds/km2) of least auklets in four regions (see map) of the eastern Chukchi Sea, 1975-1981 and 2007-2012, based on at-sea surveys (archived in the North Pacific Pelagic Seabird Database). Figures provided by Adrian Gall, ABR, Inc. and reprinted with permission. STATE OF THE ARCTIC MARINE BIODIVERSITY REPORT - <a href="https://arcticbiodiversity.is/findings/seabirds" target="_blank">Chapter 3</a> - Page 138 - Box fig. 3.5.1 The shapefile outlines 4 regions of the eastern Chukchi Sea that were surveyed for seabirds during the open-water seasons of 1976-2012. We compared the density of seabirds in these regions among two time periods (1975-1981 and 2008-2012) to assess changes in seabird abundance over the past 4 decades. We also include a figure showing abundance of Least Auklets 1975-2012. Data are from the North Pacific Pelagic Seabird Database, maintained by the USGS (http://alaska.usgs.gov/science/biology/nppsd/index.php).
-
In 2017, the SAMBR synthesized data about biodiversity in Arctic marine ecosystems around the circumpolar Arctic. SAMBR highlighted observed changes and relevant monitoring gaps using data compiled through 2015. In 2021 an update was provided on the status of seabirds in circumpolar Arctic using data from 2016–2019. Most changes reflect access to improved population estimates, orimproved data for monitoring trends,independent of recognized trends in population size.
-
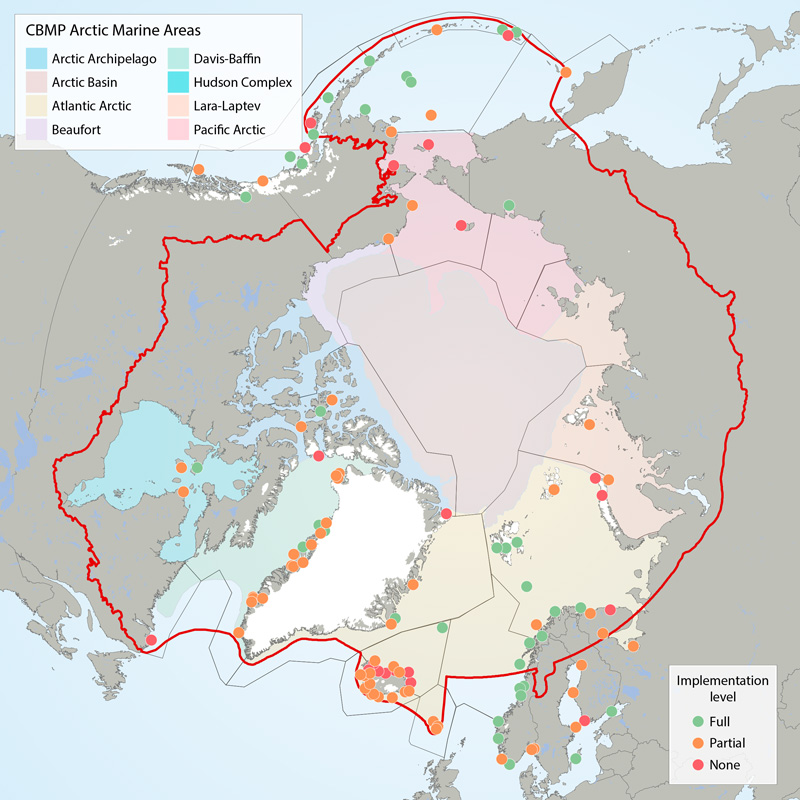
Boundaries of the 22 ecoregions (grey lines) as defined in the CSMP (Irons et al. 2015) and the Arctic Marine Areas (colored polygons with names in legend). Filled circles show locations of seabird colony sites recommended for monitoring (‘key sites’). The current level of monitoring plan implementation are green = fully implemented, amber = partially implemented, red = not implemented. The CSMP provides implementation maps for each forage guild. STATE OF THE ARCTIC MARINE BIODIVERSITY REPORT - <a href="https://arcticbiodiversity.is/findings/seabirds" target="_blank">Chapter 3</a> - Page 132 - Figure 3.5.1 This graphic displays the status of seabird monitoring at key sites in CBMP areas across the Arctic.
-
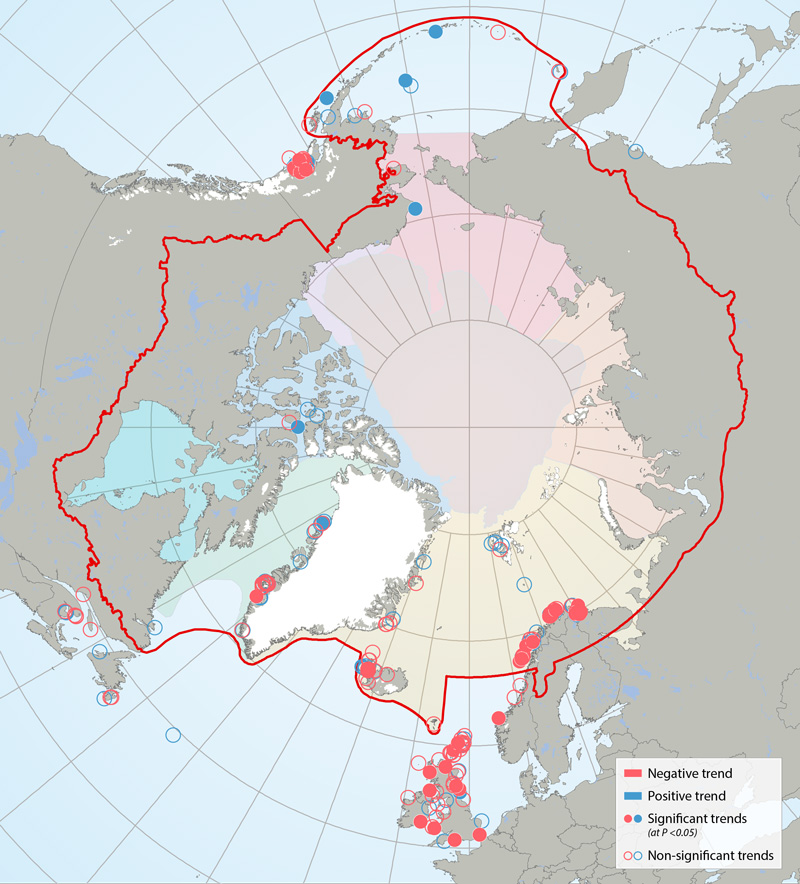
Trends in kittiwake colonies 2001-2010, based on linear regression with year as the explanatory variable. Slope of the regression is red = negative trend, blue = positive trend; shaded circle = significant trend (at p<0.05), open circle = non-significant trend. Non-significant deviation from zero could imply a stable population, but in some cases was due to low sample size and low power. Provided with permission from Descamps et al. (in prep). STATE OF THE ARCTIC MARINE BIODIVERSITY REPORT - <a href="https://arcticbiodiversity.is/findings/seabirds" target="_blank">Chapter 3</a> - Page 135 - Figure 3.5.3 This figure is compiled from data from researchers working throughout circumpolar regions, primarily members of the Circumpolar Seabird Group, an EN of CAFF/seabirds. Dr. Sebastien Decamps conducted the analysis and produced the original figure; the full results will be available in an article in prep titled: “Descamps et al. in prep. Circumpolar dynamics of black-legged kittiwakes track large-scale environmental shifts and oceans' warming rate.” [expected submission spring 2016]. Colony population trends were analyzed using a linear regression with the year as explanatory variable. Based on slope of the regression (which cannot be exactly 0) colonies are either Declining (Slope of the regression <0) or Increasing (Slope of the regression >0). (Colonies may have had a negative but not significant slope, and could be stable but for some others, the slope is not significant due to small sample size / low power; thus we cannot say that all colonies with a non- significant slope are stable. The threshold was put at 5% to assess the significance of the trend.
-
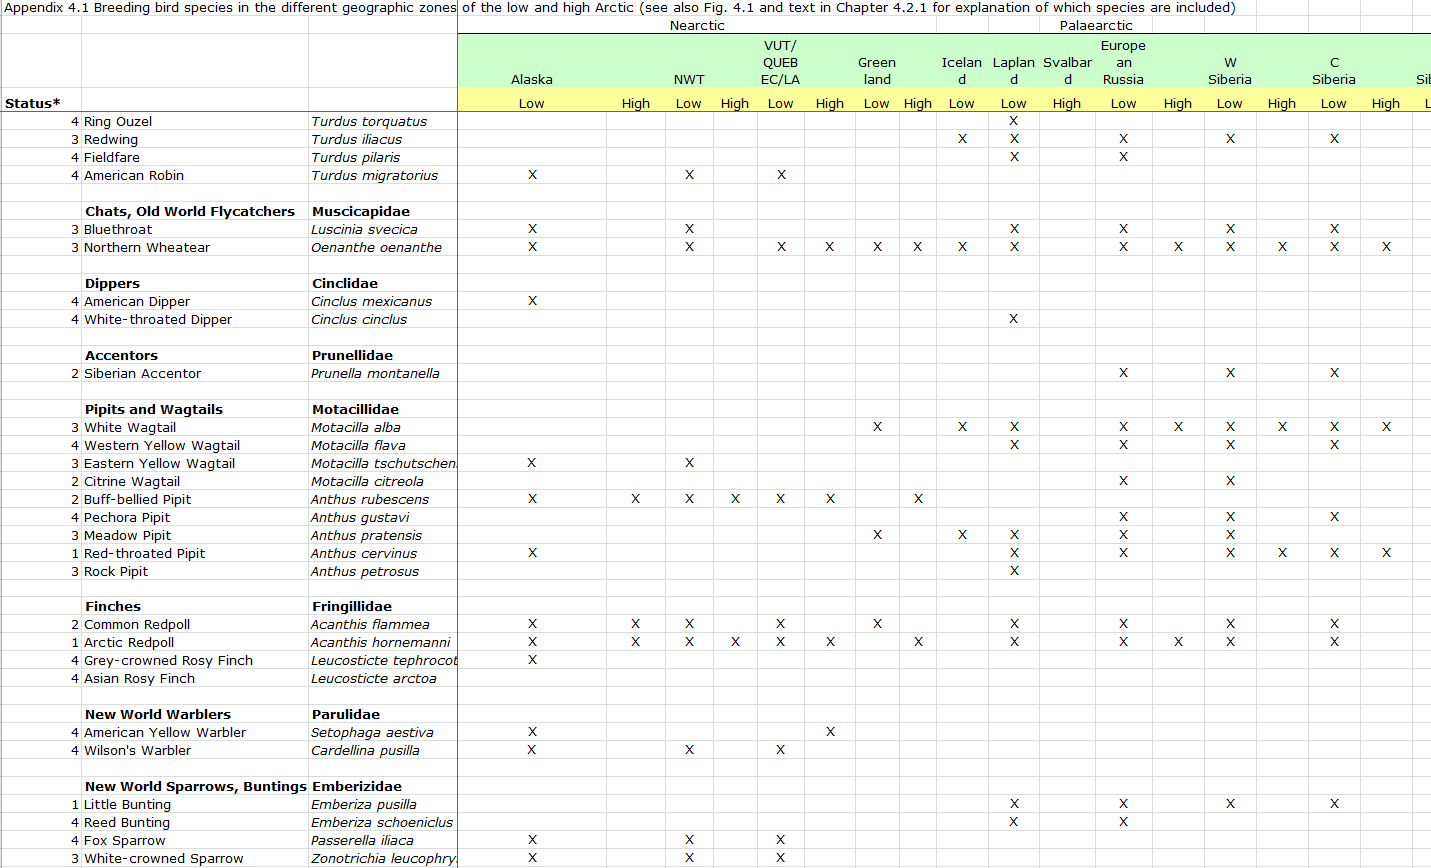
Breeding bird species in the different geographic zones of the low and high Arctic
-
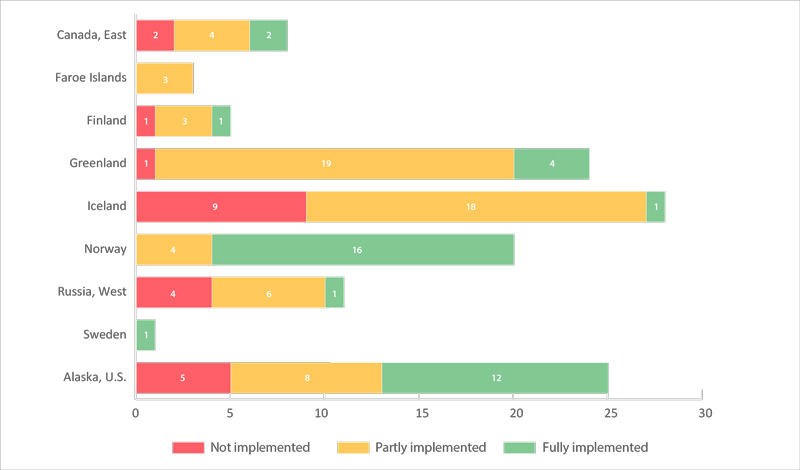
The number of key sites (monitored colonies) for seabirds (in 22 CSMP ecoregions) by country (a total of 125 sites). Sites are categorized as having fully, partially, or not met the CSMP criteria for parameters monitored (see 2.6.2). Data were from Appendix 3 of the CSMP (Irons et al. 2015); the degree of implementation may have changed at some sites since this summary was compiled. STATE OF THE ARCTIC MARINE BIODIVERSITY REPORT - <a href="https://arcticbiodiversity.is/findings/seabirds" target="_blank">Chapter 3</a> - Page 134 - Figure 3.5.2