From 1 - 7 / 7
  • Categories  

    The Peregrine Falcon (Falco peregrinus tundrius) population in South Greenland has been monitored annually 1981-2021 (except 1993, 2004 and 2020). At visits to known breeding sites we recorded presence/absence of territorial falcons as well as their breeding outputs (number of eggs and/or young). The file named S_Greenland_Peregrine_monitoring_data-1981-2021.csv contains the raw data from 835 site checks (sometimes several per site per year). The file named S_Greenland_Summary_occupancy_and_productivity-1981-2021.csv contains a summary of the raw data, providing annual estimates of occupancy, productivity and average brood size (young/ successful nest). The respective ReadMe files specify the contents.

  • Categories  

    The Peregrine Falcon (Falco peregrinus tundrius) population in South Greenland has been monitored annually 1981-2018 (except 1993 and 2004). At visits to known breeding sites we recorded presence/absence of territorial falcons as well as their breeding outputs (number of eggs and/or young). The file named S_Greenland_Peregrine_monitoring_data.csv contains the raw data from 725 site checks (sometimes several per site per year). The file named S_Greenland_Summary_occupancy_and_productivity.csv contains a summary of the raw data, providing annual estimates of occupancy, productivity and average brood size. The respective ReadMe files specify the contents.

  • Categories  

    The Peregrine Falcon (Falco peregrinus tundrius) population in Greenland has been monitored in different survey areas in South and West Greenland since 1972. At visits to Peregrine Falcon nests, eggshell fragments from hatched eggs as well as addled (dead) eggs left behind have been collected with the aim of monitoring the thickness of the eggshells as well as analysing the whole eggs for contaminants. The shell thickness serves as a proxy for the falcons’ exposure to certain persistant organic pollutants, in particular DDT and its breakdown products (see summaries in Cade et al. 1988). This data set contains the raw data on 6665 eggshell thickness measurements of: 1. Whole eggs from South Greenland 1986-2015 2. Eggshell fragments from the study area in South Greenland 1981-2019 3. Eggshell fragments from the study area around Kangerlussuaq in West Greenland 1972-1989 The data set contains a mix of measurements of shell thickness including or excluding the eggshell membranes from the same clutch of eggs. Based on those measurements the average membrane thickness is 0.071 mm (SD=0.013) – a figure confirmed by other studies – and this ’membrane factor’ can be added or subtracted for comparisons with other data sets. Further details regarding the sampling areas, measurement methods and the results of trends analyses of changes in shell thickness are provided in Falk et al. (2006 and 2018). The file named 1_Data_Eggshell_Thickness_1972-2019.csv contains the raw measurements data and the file 2_ReadMe_Eggshell_Thickness_1972-2019.txt specifies the content. The file named 3_Rscript_Eggshell_Thickness_1972-2019.R provides an R script for summarizing and plotting the data as shown in the file 4_Plot_Eggshell_Thickness_1972-2019.pdf

  • Categories  

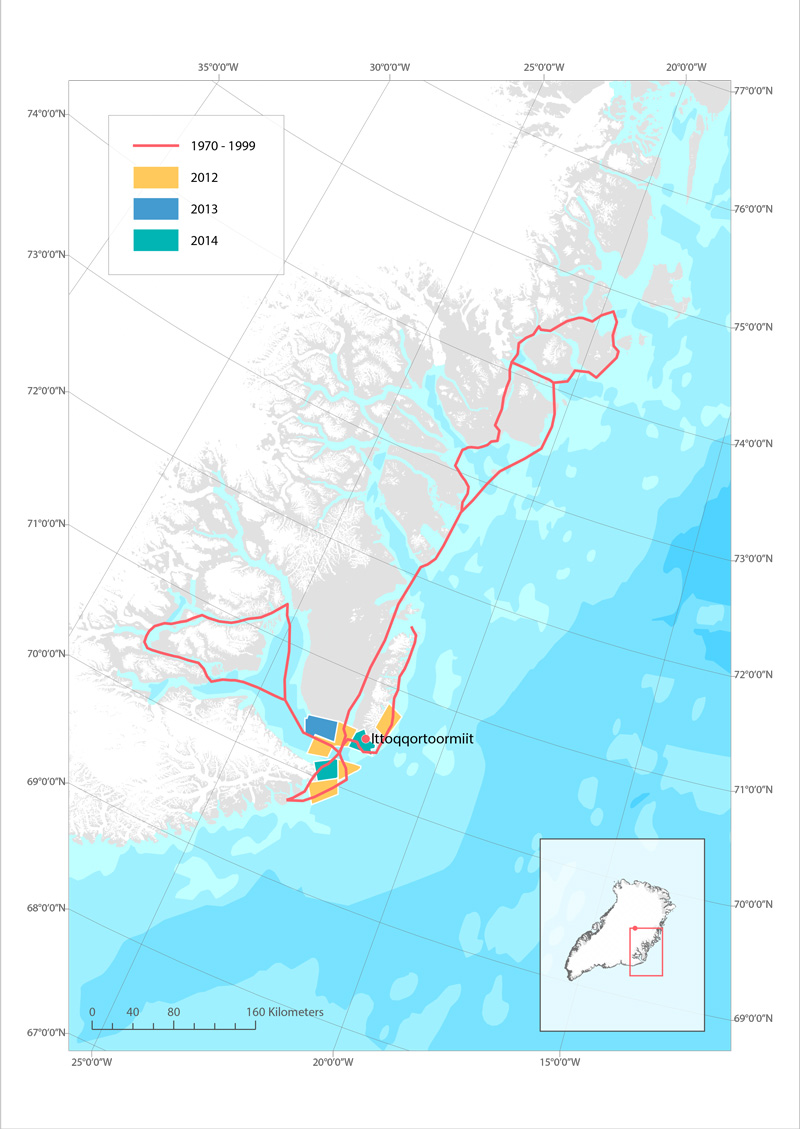
    Routes used for hunting polar bear in Ittoqqoortoormiit, East Greenland before 1999 (red line), and in 2012 (yellow), 2013 (blue) and 2014 (green). STATE OF THE ARCTIC MARINE BIODIVERSITY REPORT - <a href="https://arcticbiodiversity.is/findings/marine-mammals" target="_blank">Chapter 3</a> - Page 159 - Box figure 3.6.1

  • Categories  

    The baseline survey and ongoing monitoring required to adequately describe Arctic arthropod biodiversity and to identify trends is largely lacking. Although some existing publications reporting long-term and extensive sampling exist, they are limited in species level information, taxonomic coverage and/or geographic location/extent (Figure 3-19) STATE OF THE ARCTIC TERRESTRIAL BIODIVERSITY REPORT - Chapter 3 - Page 44 - Figure 3.19

  • Categories    

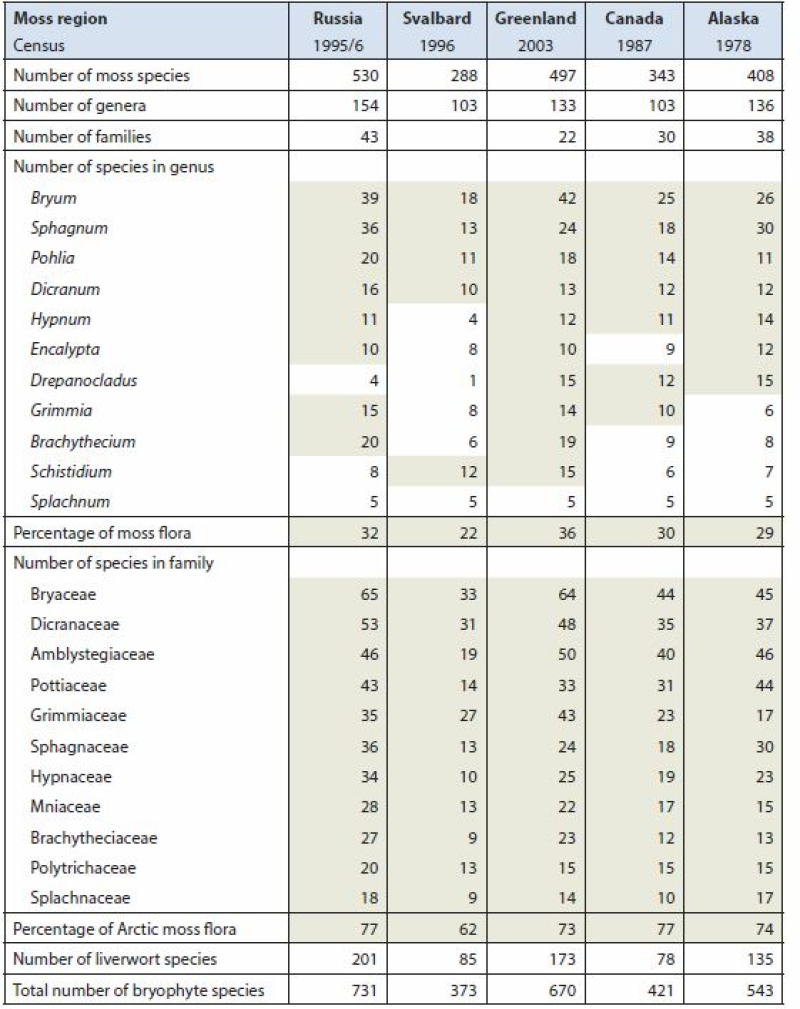
    Arctic Biodiversity Assessment (ABA) 2013. Table 9.5. Species numbers of species-rich moss genera and families. Numbers highlighted in grey fields are used in calculating the percentage of the total moss flora. Listed are Splachnum, genera with at least 10 species and families with at least nine species. Conservation of Arctic Flora and Fauna, CAFF 2013 - Akureyri . Arctic Biodiversity Assessment. Status and Trends in Arctic biodiversity. - Plants(Chapter 9) page 333
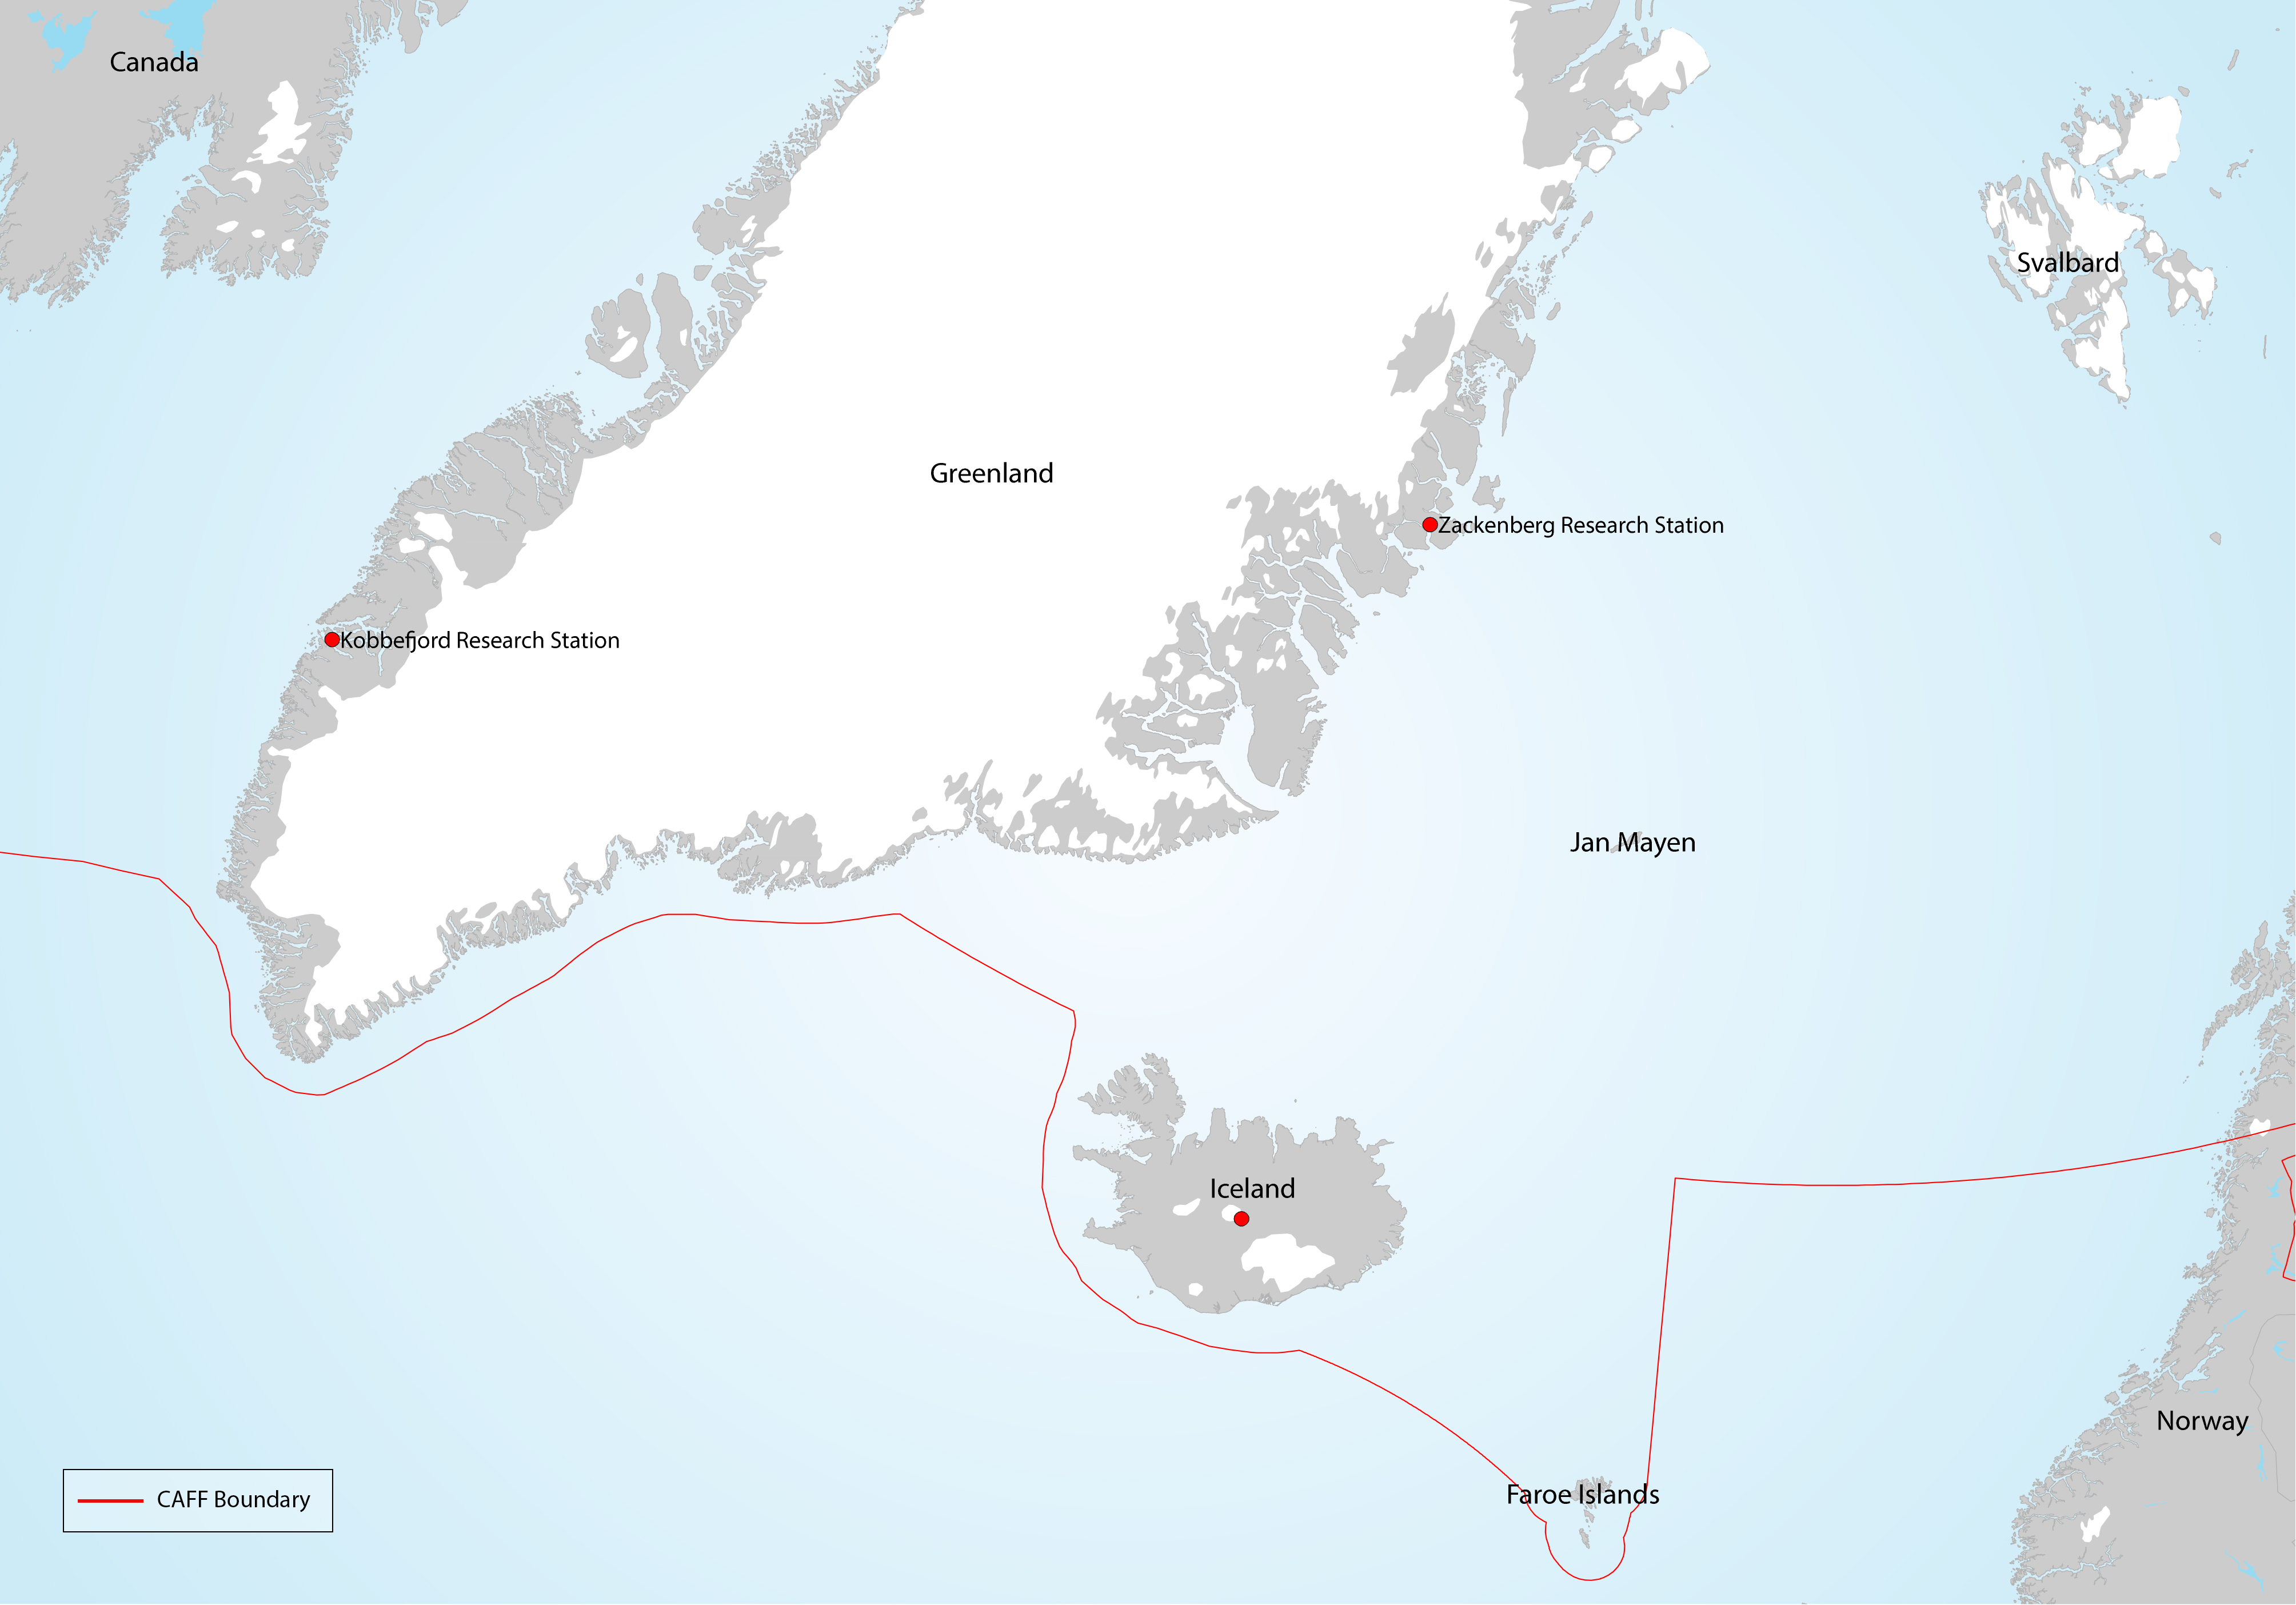
  • Categories    

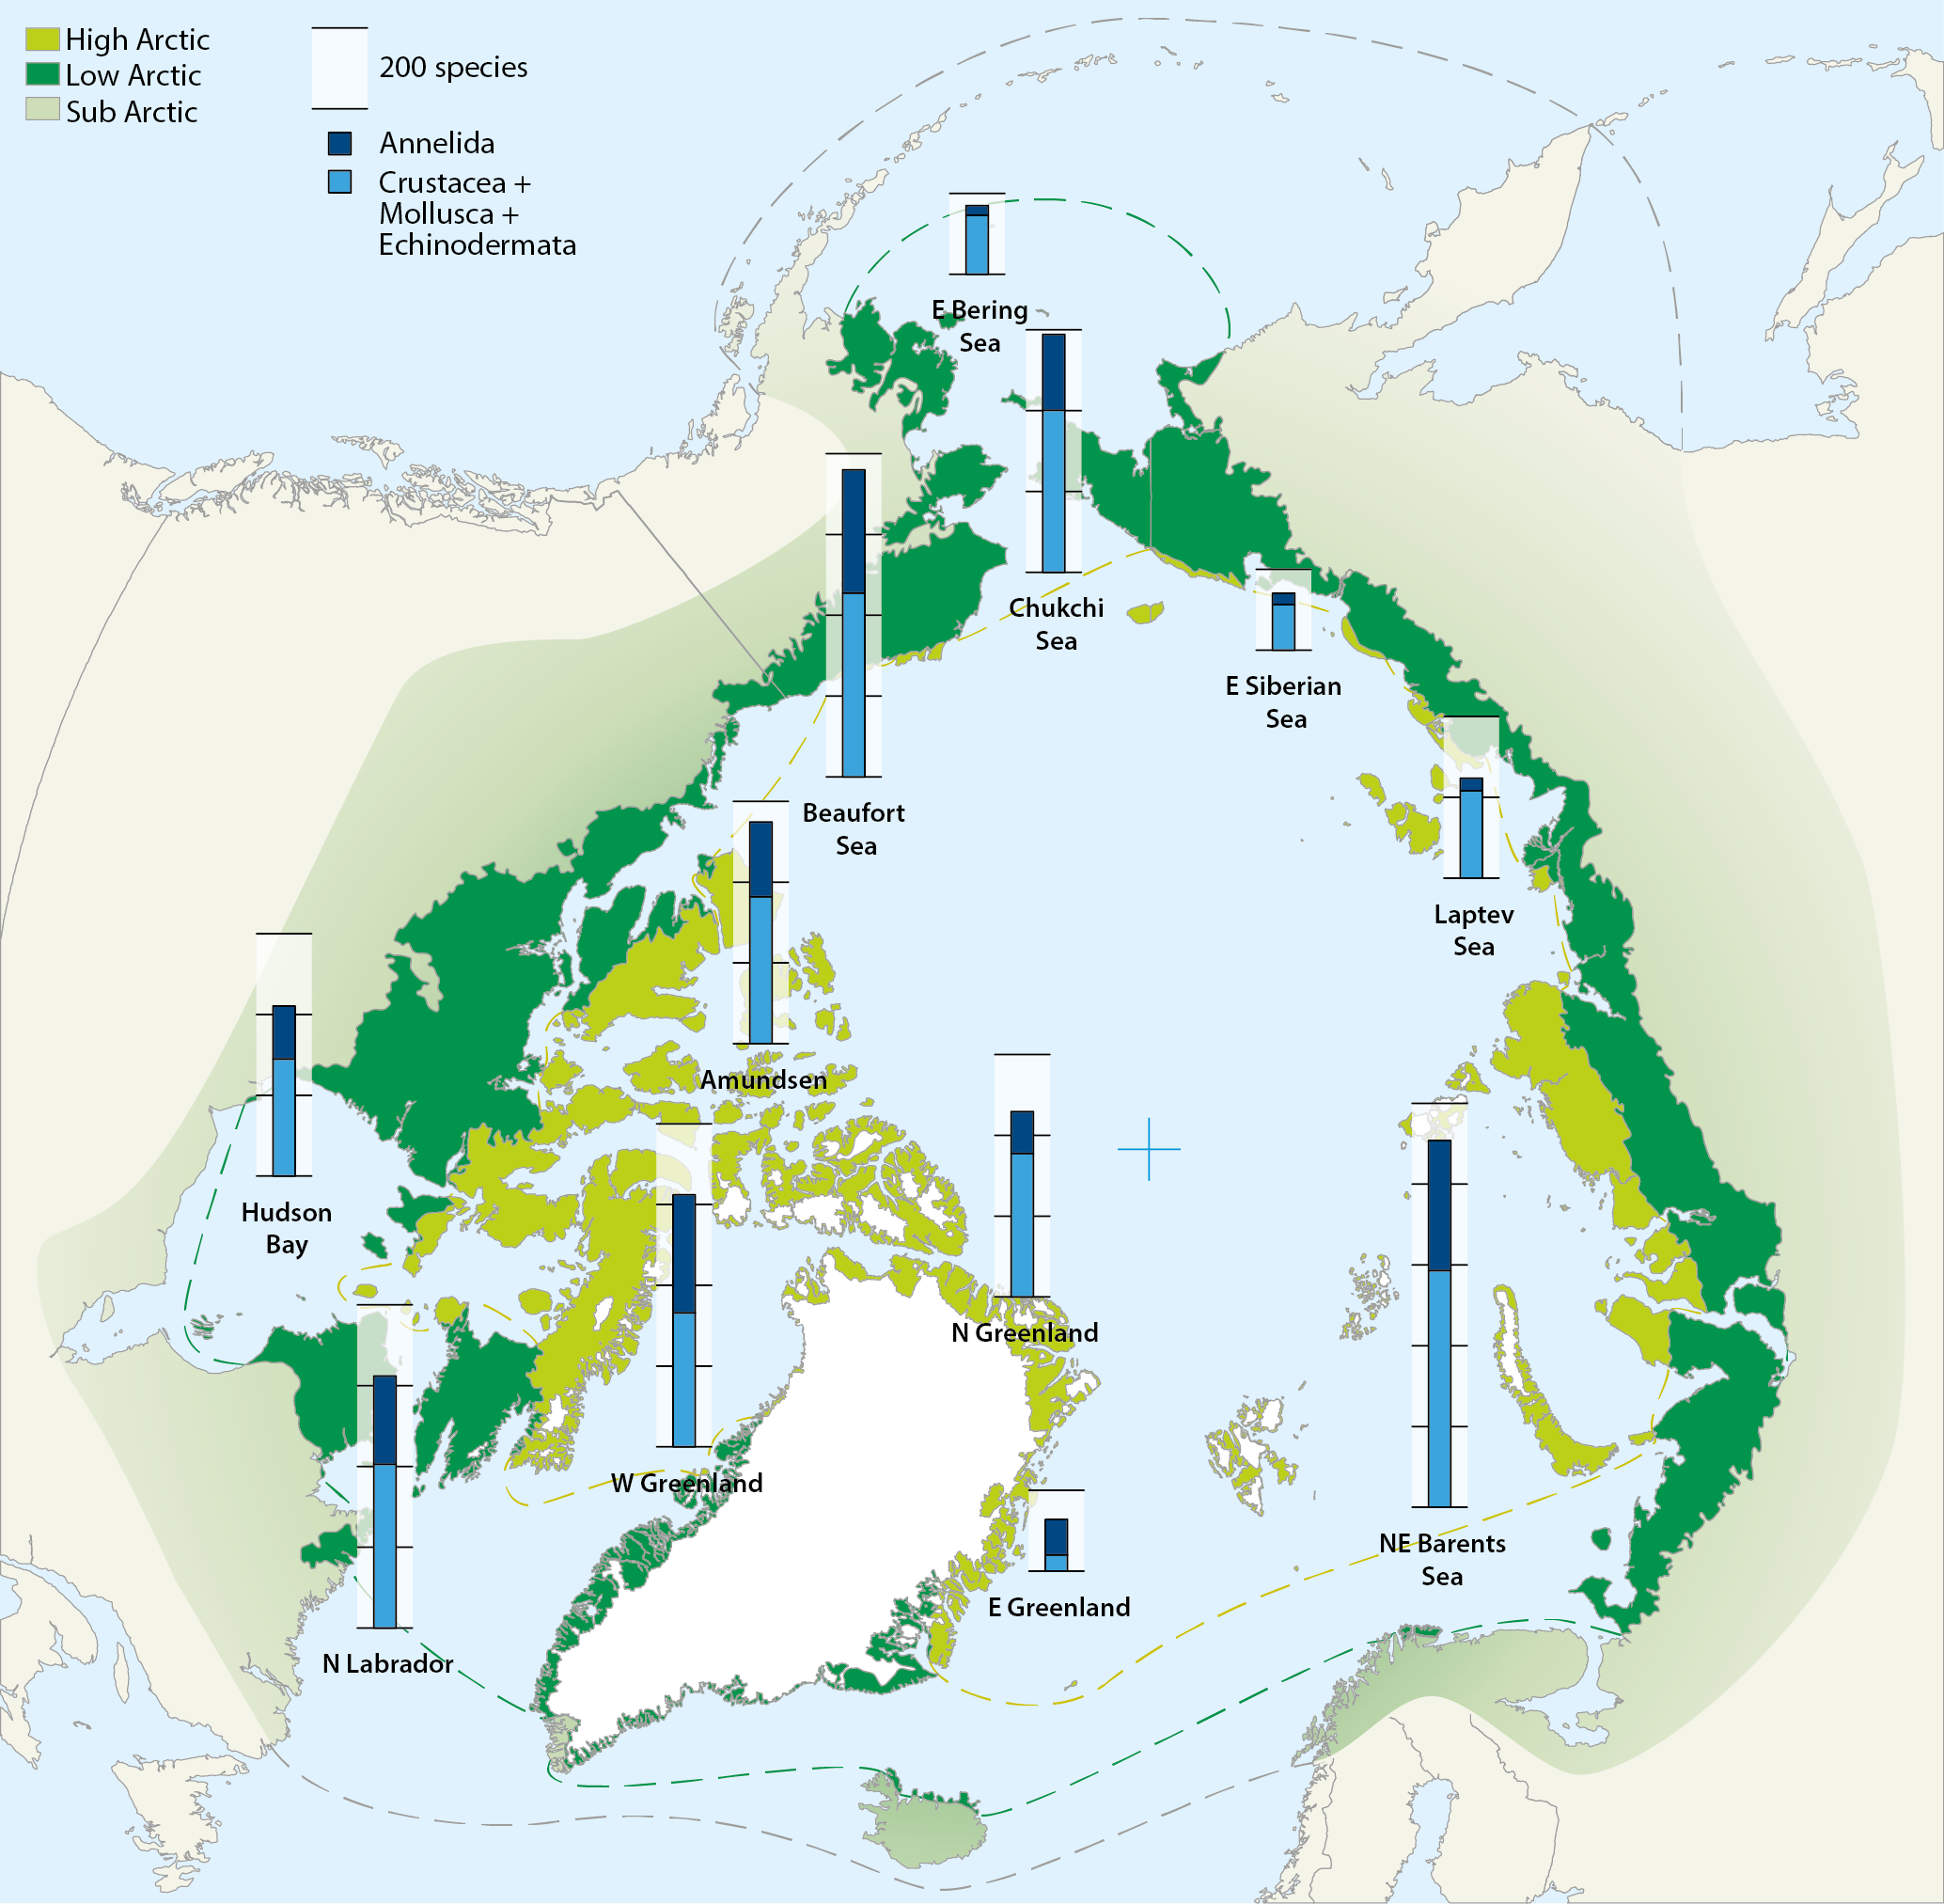
    Map of the Arctic Ocean with superimposed stacked bars representing species numbers of macrozoobenthos from different shelf sea areas: Crustacea+Mollusca+Echinodermata (blue) and Annelida (black). Compiled by Piepenburg et al. (2011). Conservation of Arctic Flora and Fauna, CAFF 2013 - Akureyri . Arctic Biodiversity Assessment. Status and Trends in Arctic biodiversity. - Marine Invertebrates(Chapter 8) page 282