Vegetation
Type of resources
Available actions
Topics
Keywords
Contact for the resource
Provided by
Representation types
Update frequencies
status
-
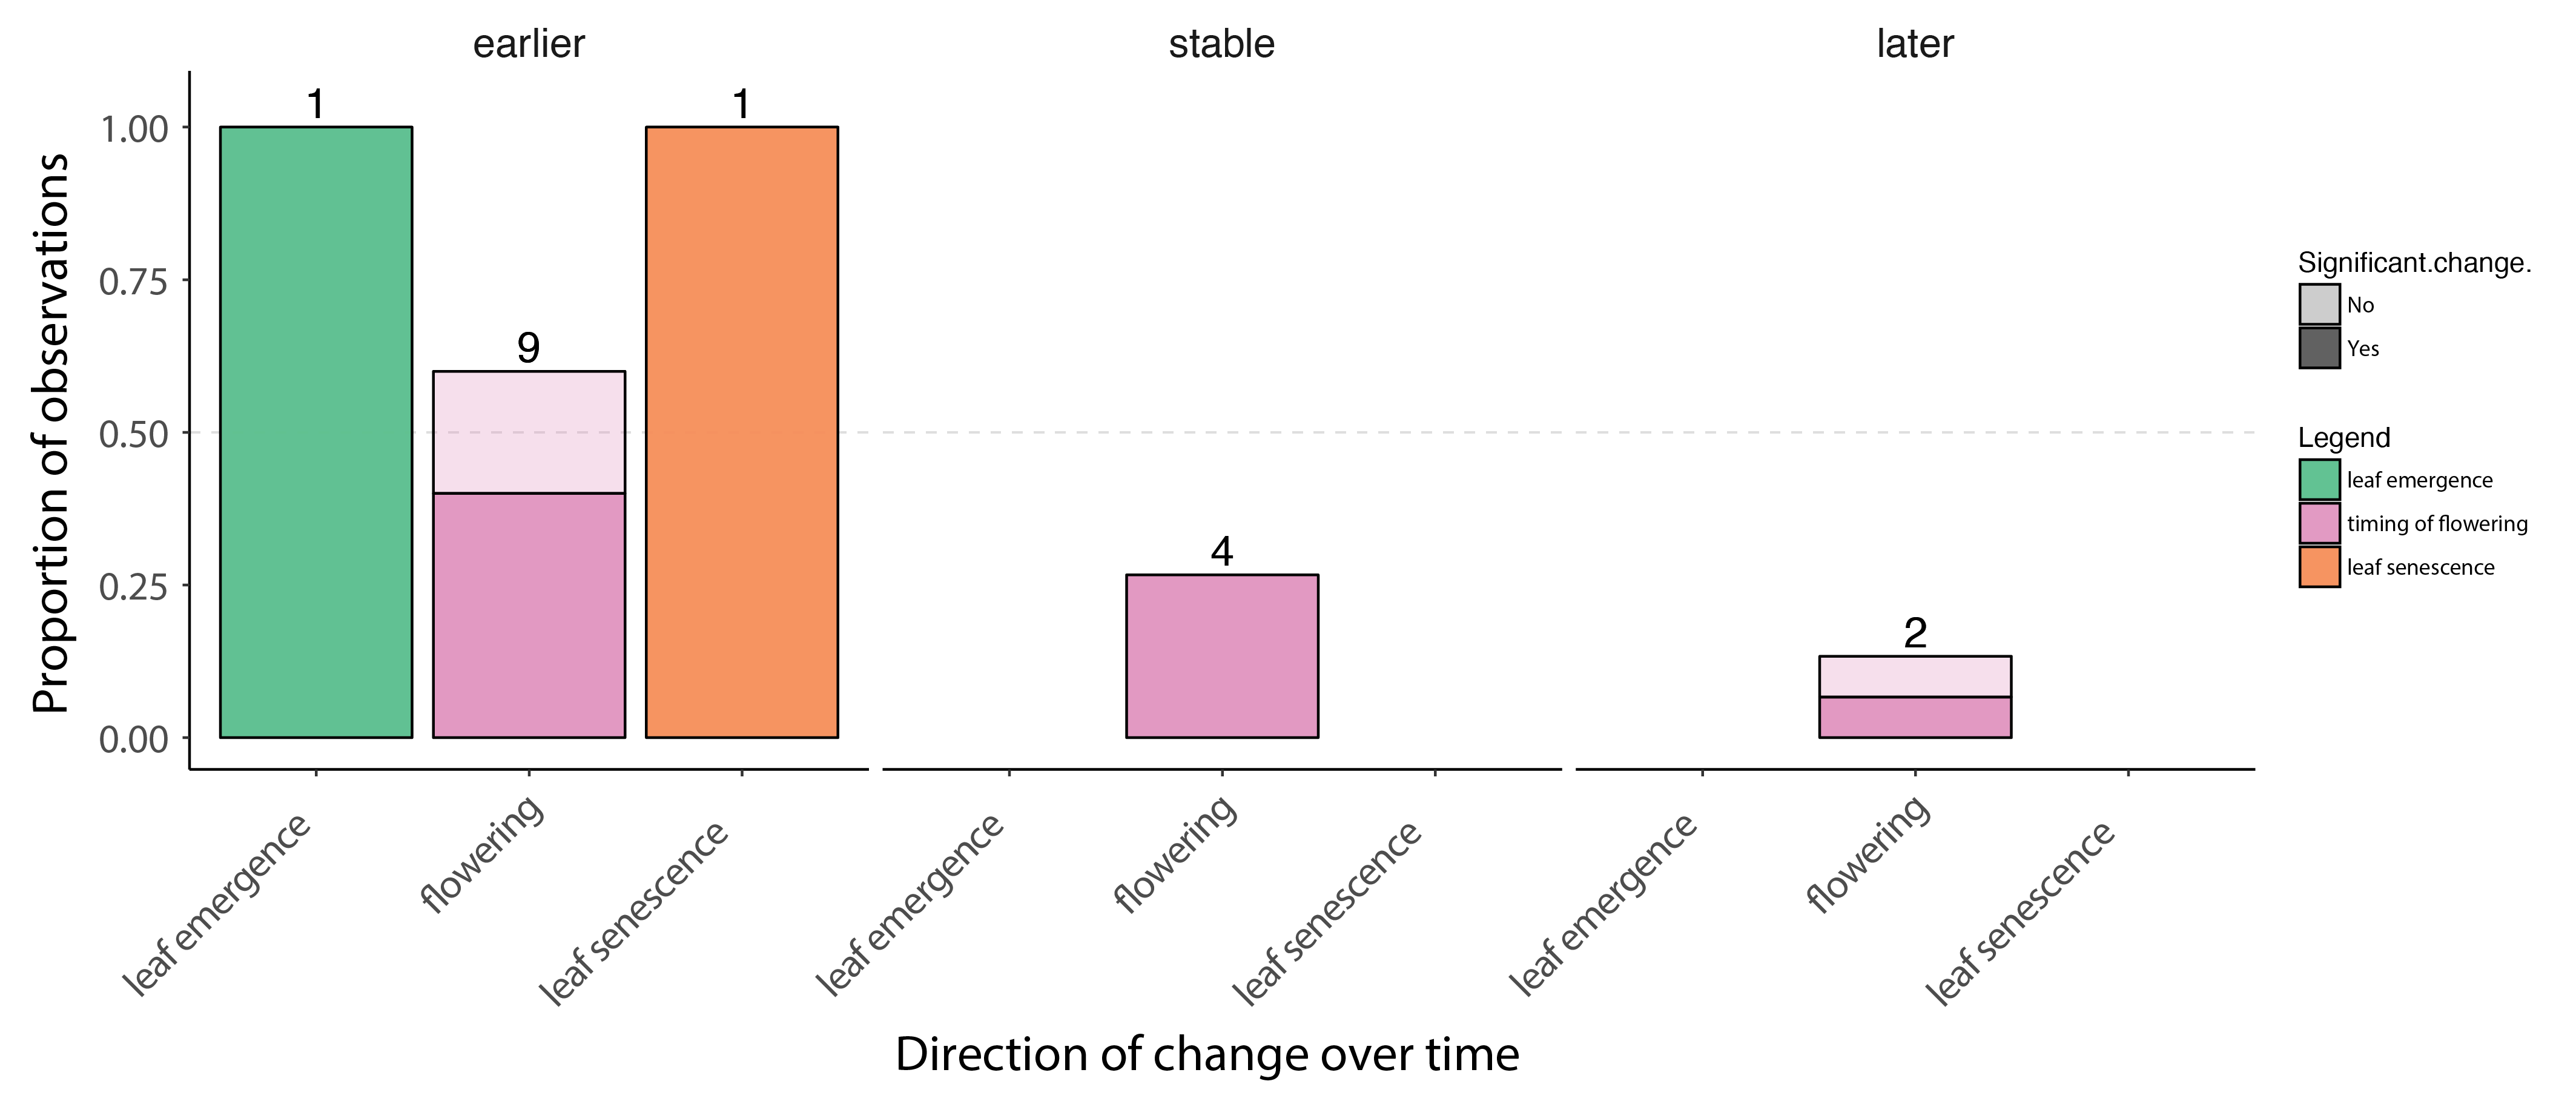
Change in plant phenology over time based on published studies, ranging from 9 to 21 years of duration. The bars show the proportion of observations where timing of phenological events advanced (earlier) was stable or were delayed (later) over time. The darker portions of each bar represent visible decrease, stable state, or increase results, and lighter portions represent marginally significant change. The numbers above each bar indicate the number of observations in that group. Figure from Bjorkman et al. 2020. STATE OF THE ARCTIC TERRESTRIAL BIODIVERSITY REPORT - Chapter 3 - Page 31- Figure 3.3
-
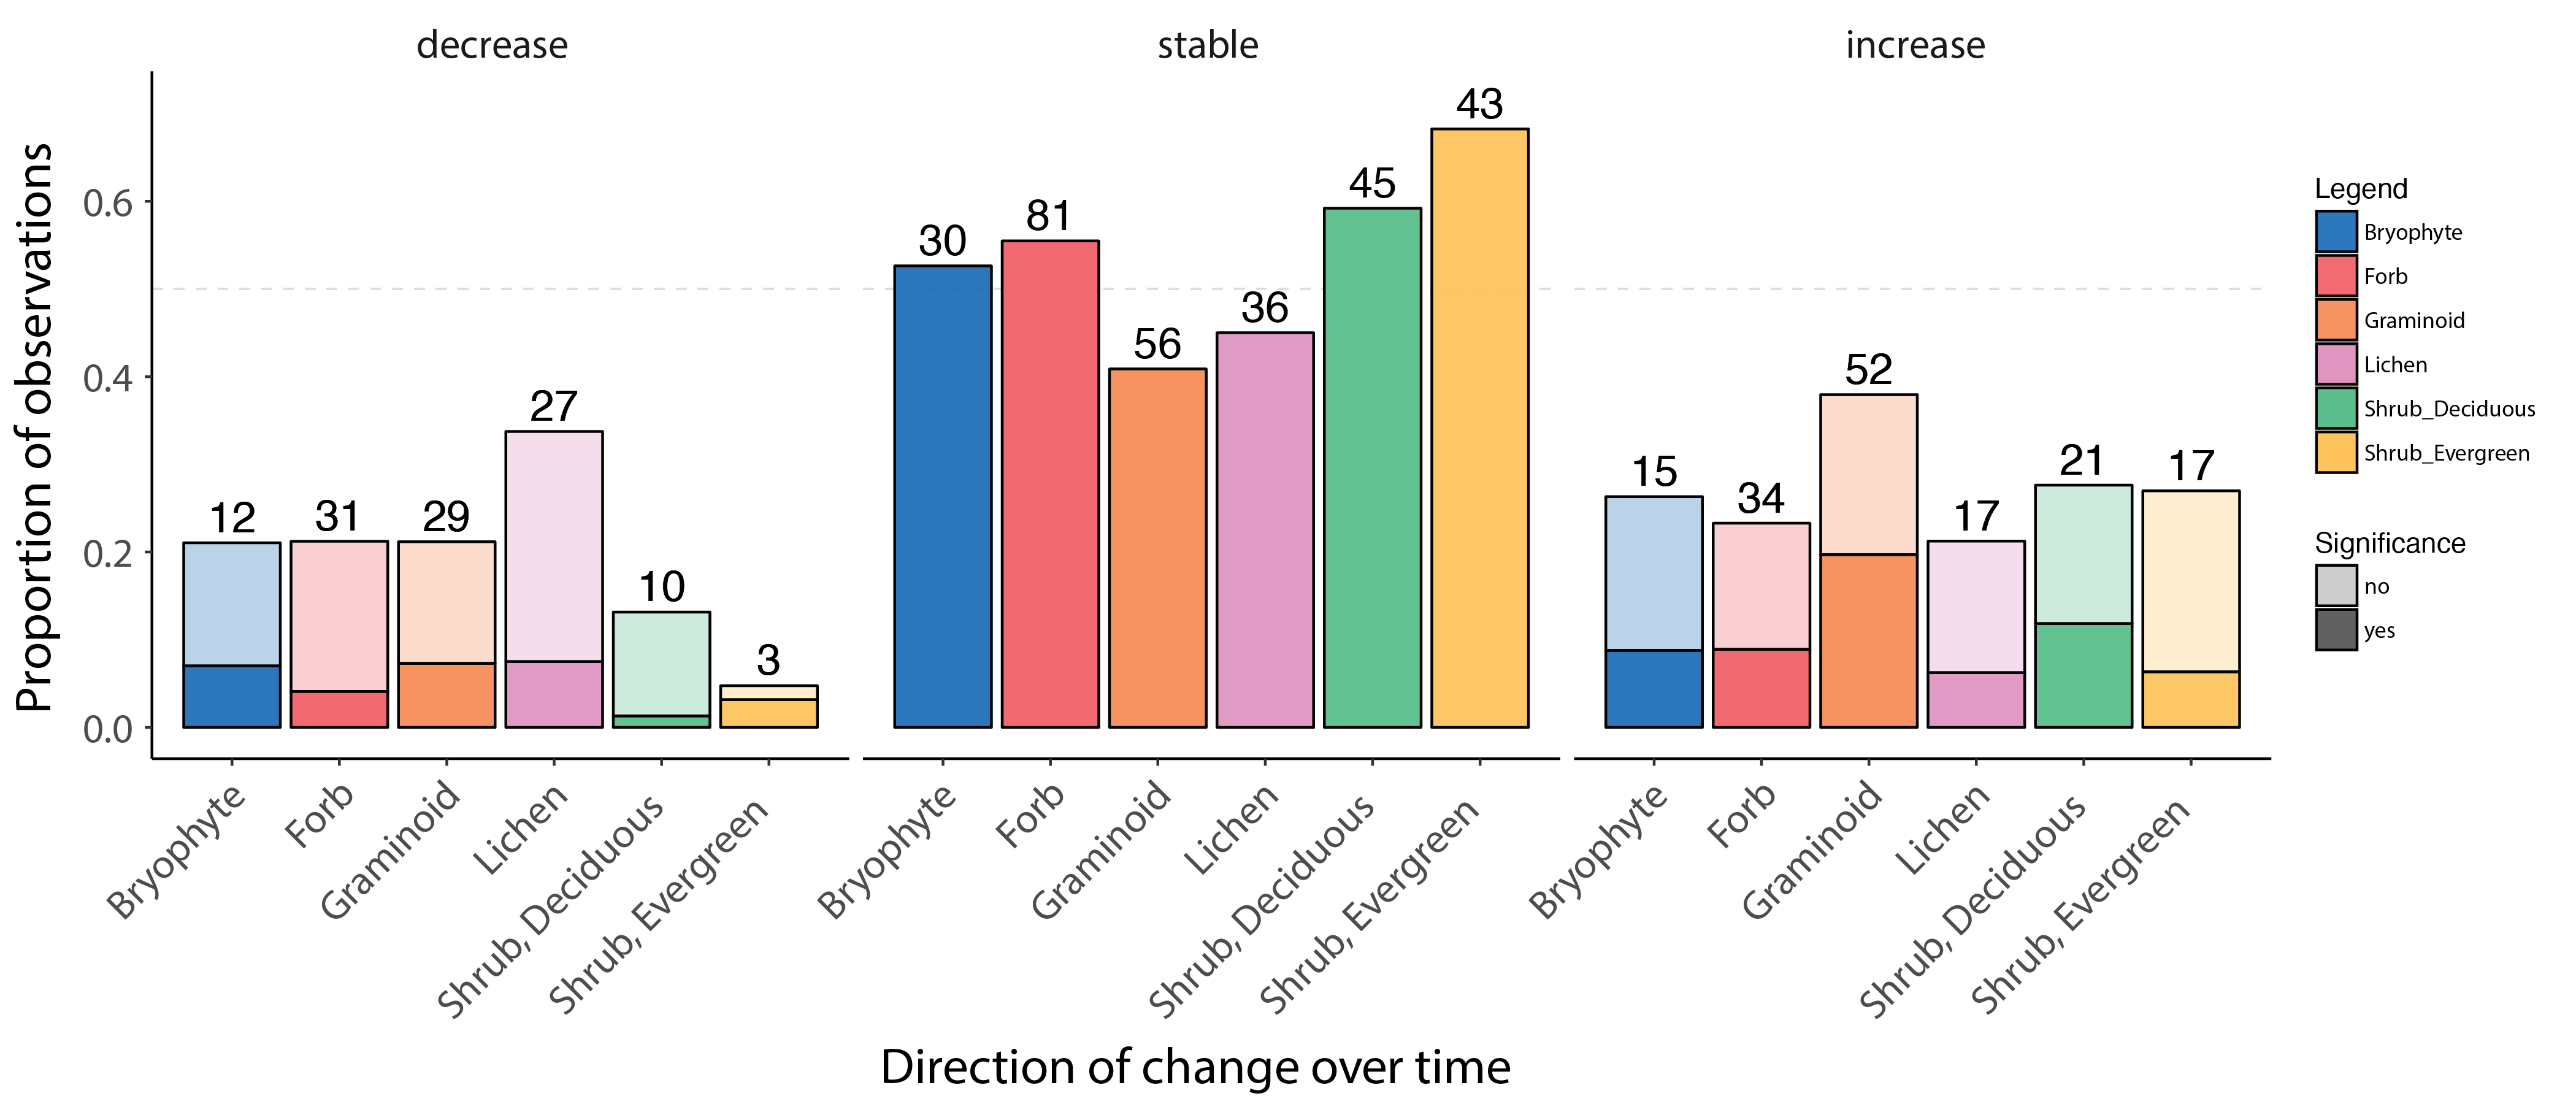
Change in forb, graminoid and shrub abundance by species or functional group over time based on local field studies across the Arctic, ranging from 5 to 43 years of duration. The bars show the proportion of observed decreasing, stable and increasing change in abundance, based on published studies. The darker portions of each bar represent a significant decrease, stable state, or increase, and lighter shading represents marginally significant change. The numbers above each bar indicate the number of observations in that group. Modified from Bjorkman et al. 2020. STATE OF THE ARCTIC TERRESTRIAL BIODIVERSITY REPORT - Chapter 3 - Page 31- Figure 3.2
-
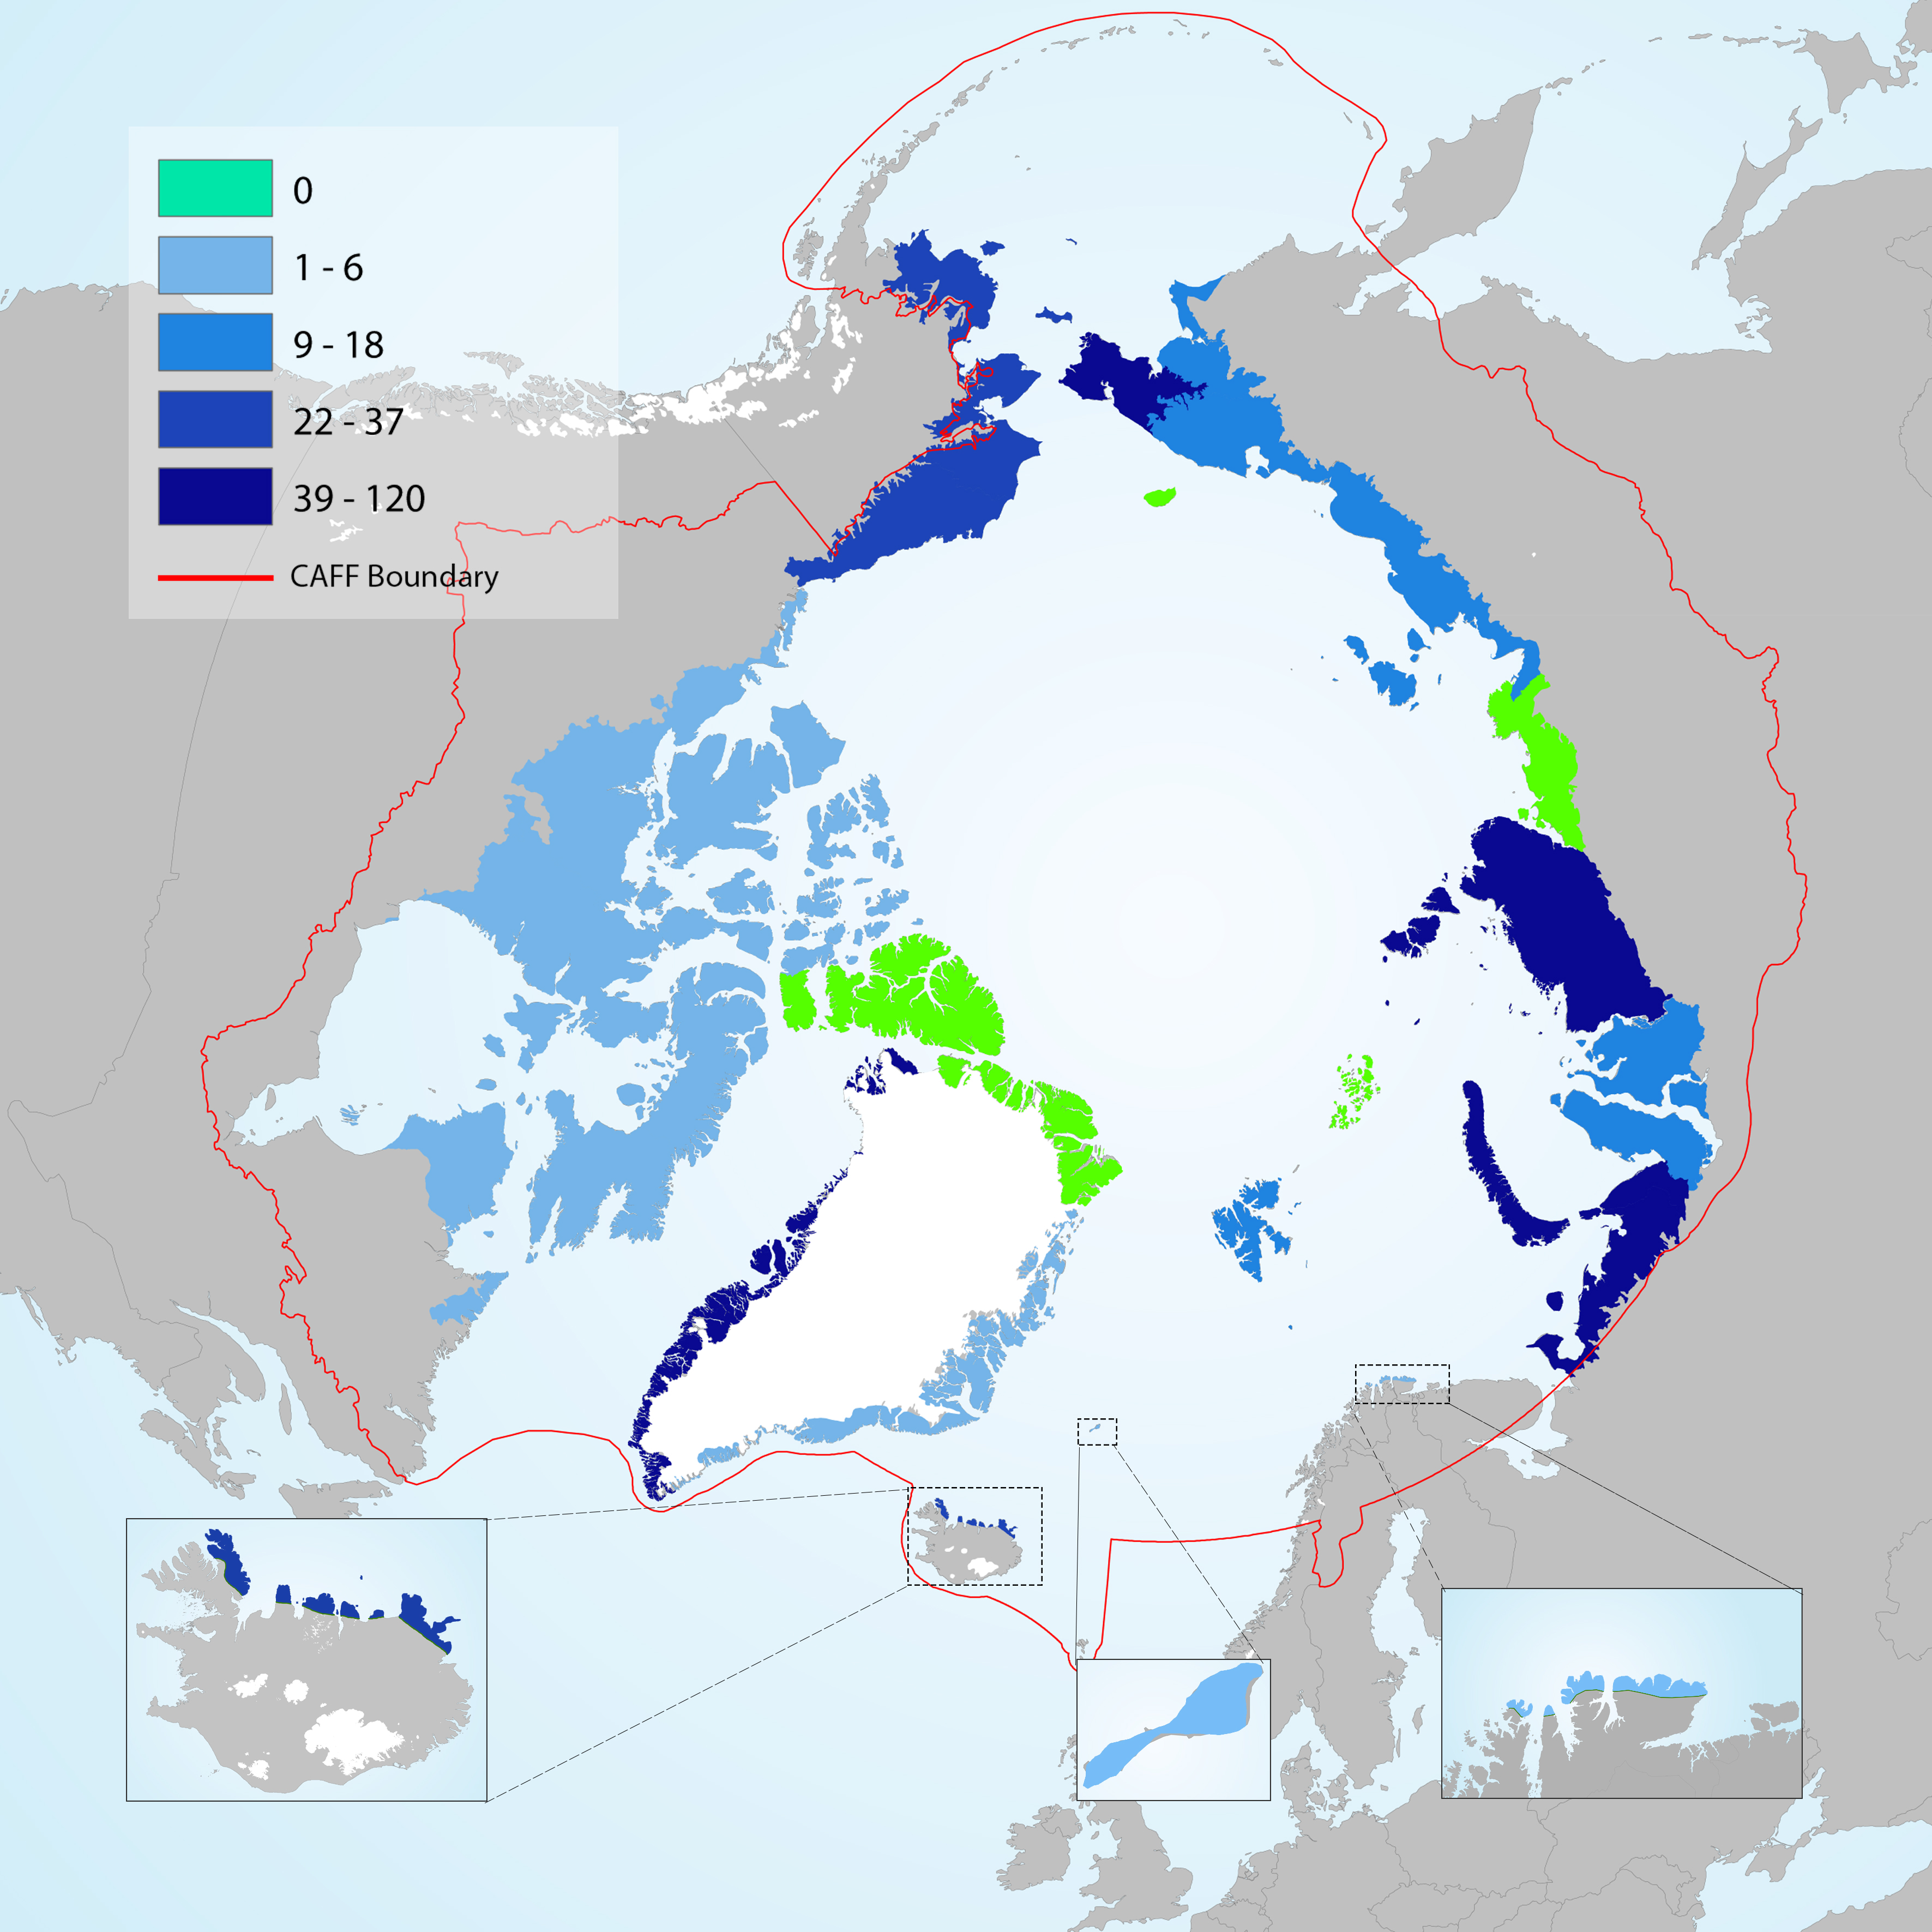
Number of non-native plant taxa that have become naturalised across the Arctic. No naturalised non-native taxa are recorded from Wrangel Island, Ellesmere Land – northern Greenland, Anabar-Olenyok and Frans Josef Land. Modified from Wasowicz et al. 2020 STATE OF THE ARCTIC TERRESTRIAL BIODIVERSITY REPORT - Chapter 3 - Page 32 - Figure 3.4
-
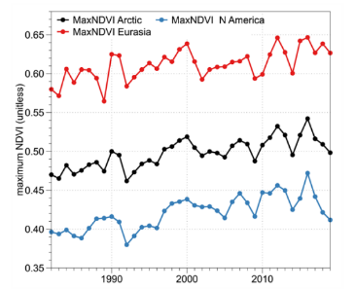
Circumpolar trends in primary productivity as indicated by the maximum Normalised Difference Vegetation Index, 1982–2017. (a) Brown shading indicates negative MaxNDVI trends, green shading indicates positive MaxNDVI trends. (b) Chart of trends for the circumpolar Arctic, Eurasia, and North America. Modified from Frost et al. 2020. STATE OF THE ARCTIC TERRESTRIAL BIODIVERSITY REPORT - Chapter 3 - Page 30 - Figure 3.1
-
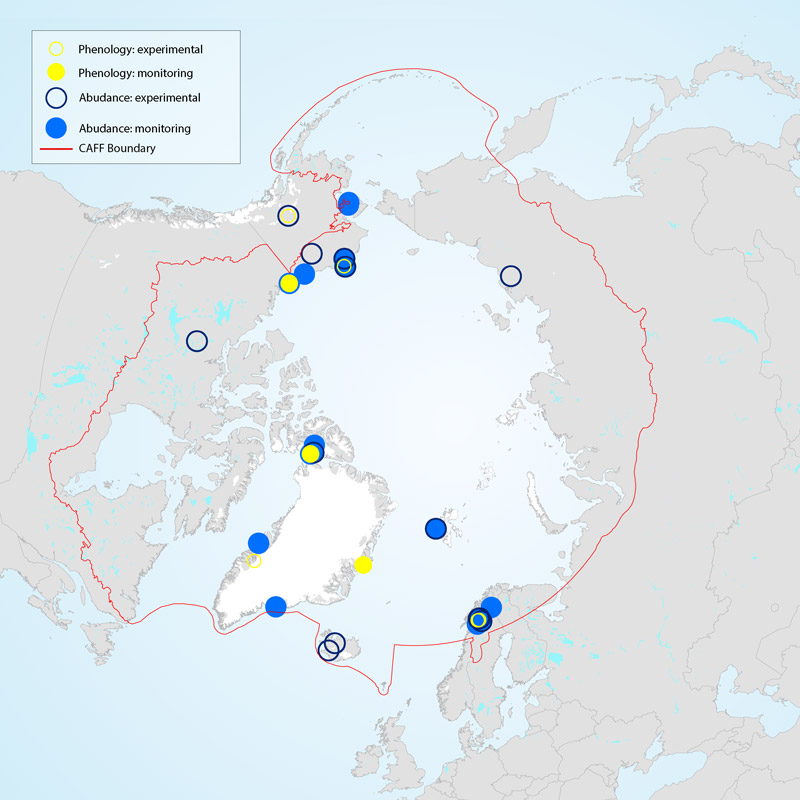
Vegetation monitoring occurs across the Arctic, but the duration of monitoring efforts is variable and is dependent upon both study design and access to resources. Although many field studies on vegetation have been conducted in the Arctic (Figure 3-5), not all can be considered monitoring since some recorded only select measurements over limited time frames. Studies reporting on abundance and composition of vegetation reflect a larger and more widespread geographical coverage than the typically more site-limited and time-consuming phenology studies (Figure 3-5). Geographical gaps in coverage of Siberia and large parts of the Canadian Arctic are evident. STATE OF THE ARCTIC TERRESTRIAL BIODIVERSITY REPORT - Chapter 3 - Page 34 - Figure 3.5
 CAFF - Arctic Biodiversity Data Service (ABDS)