 CAFF - Arctic Biodiversity Data Service (ABDS)
Temperature
Type of resources
Available actions
Topics
Keywords
Contact for the resource
Provided by
Representation types
Update frequencies
status
Scale
-
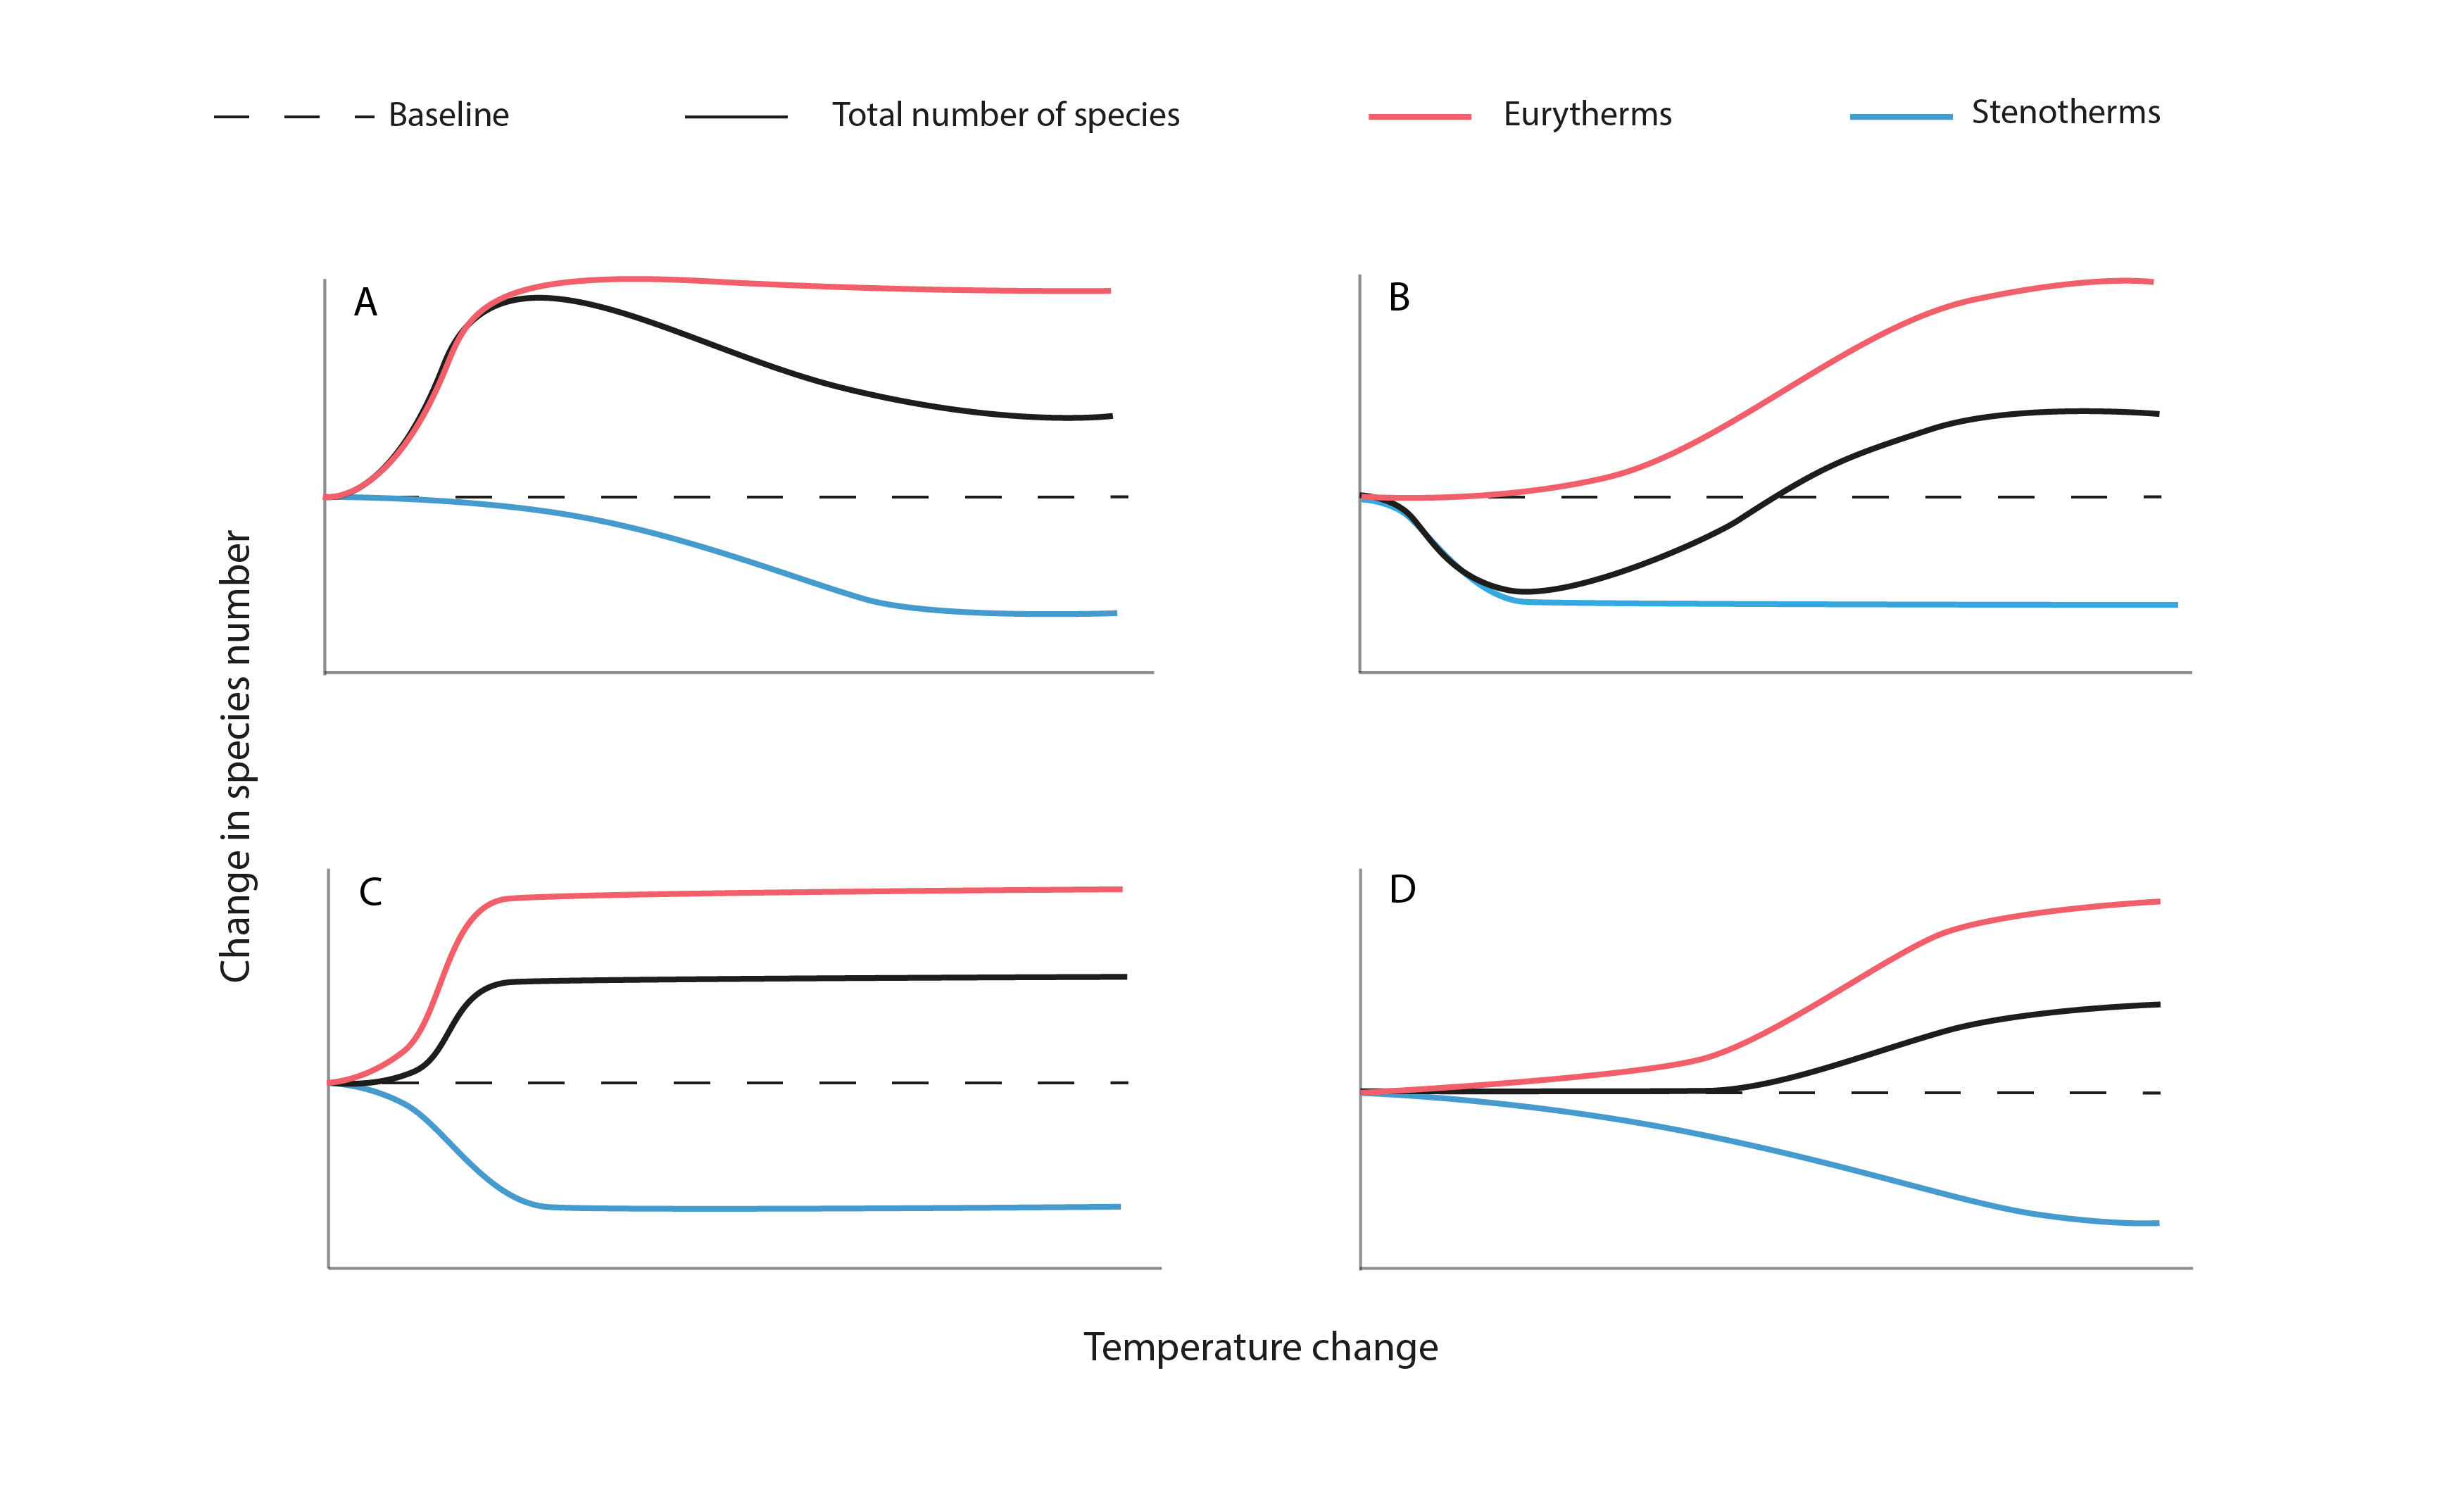
Figure 3-6. The hypothesized effects of rising mean water temperature on biodiversity (as total species number) of Arctic freshwater ecosystems. A pulsed increase in gamma biodiversity (a) results from the combination of high eurythermal invasion and establishment and low stenothermic loss with increasing water temperature. A pulsed decrease in gamma biodiversity (b) results from the combination of low eurythermal invasion and establishment and high stenothermic loss. Rapid increases (c) and slow increases (d) in species diversity occur, respectively, with high eurythermal invasion and establishment coupled with high stenothermic loss or low eurythermal invasion and establishment and low stenothermic loss as temperatures increase. For simplification, barriers to dispersal have been assumed to be limited in these models. State of the Arctic Freshwater Biodiversity Report - Chapter 3 - Page 23 - Figure 3-6
-
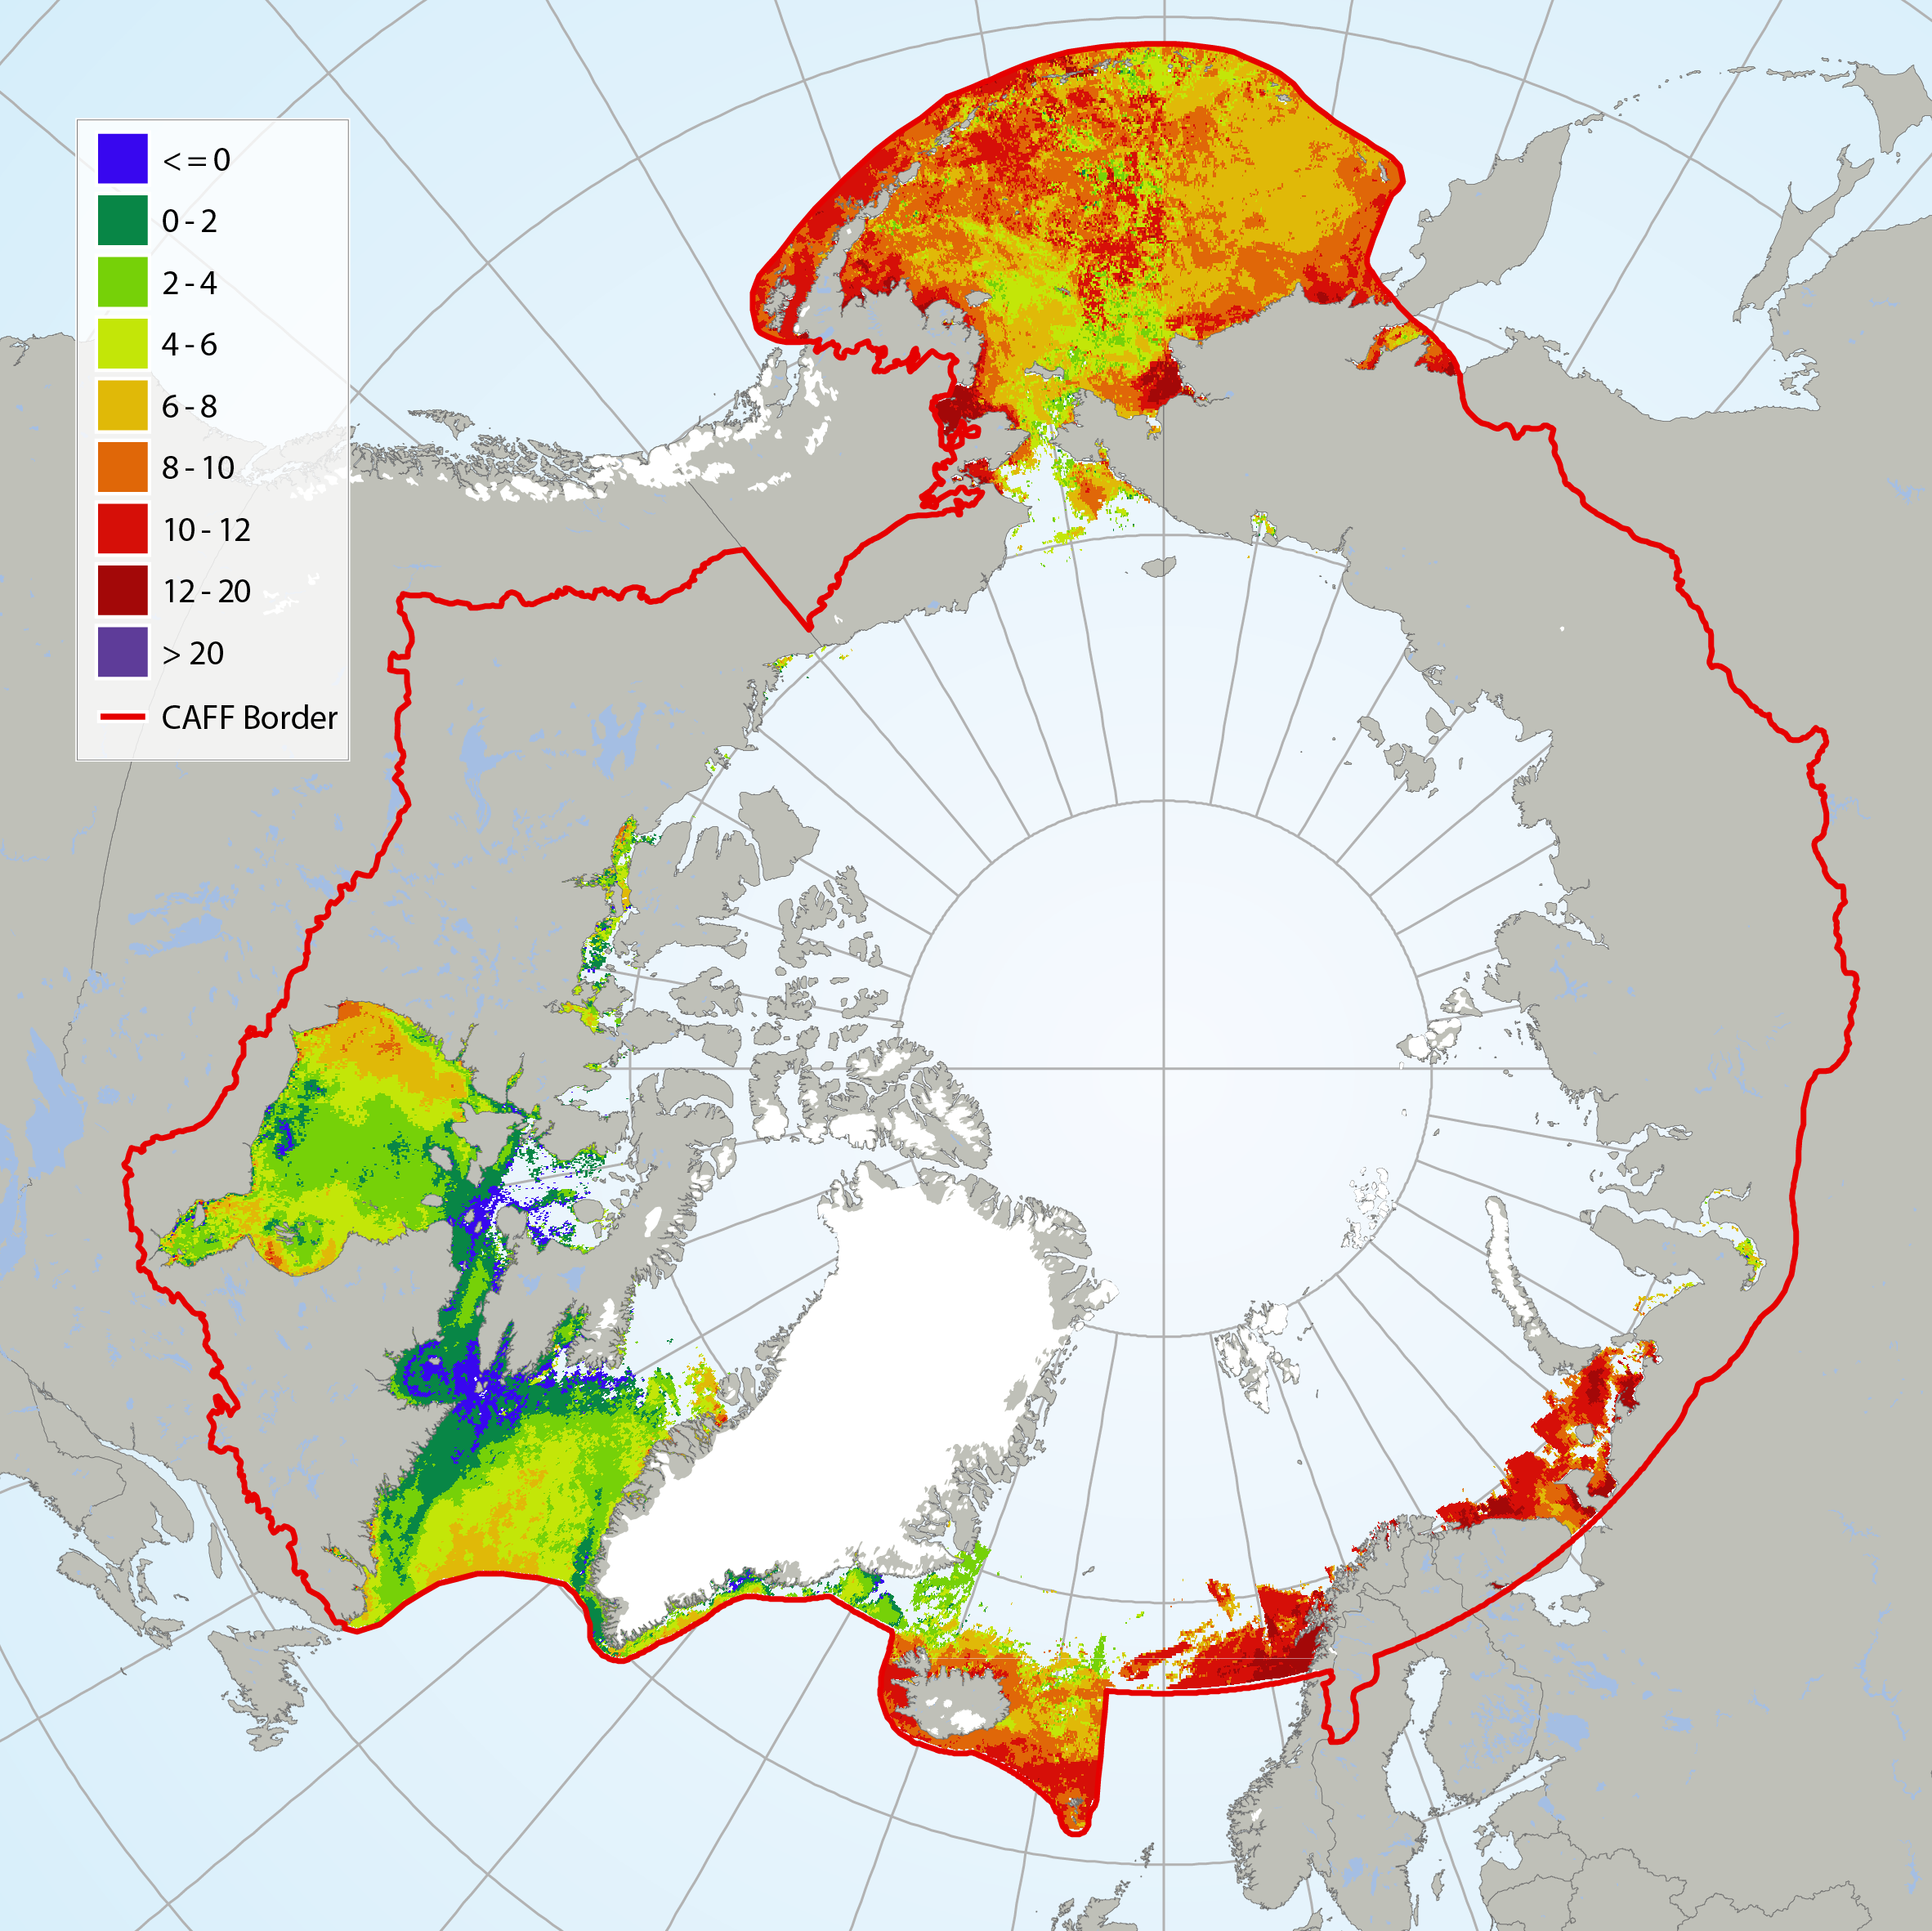
It has not been possible to identify available trend data for Arctic Ocean sea surface temperatures because there is not enough data to calculate reliable long-term trends for much of the Arctic marine environment (IPCC 2013, NOAA 2015). Here, sea surface temperature for July 2015 is shown from CAFF’s Land Cover Change Index. MODIS Sea Surface Temperature (SST) provided a four-kilometre spatial resolution monthly composite snapshot made from night-time measurements from the NASA Aqua Satellite. The night-time measurements are used to collect a consistent temperature measurement that is unaffected by the warming of the top layer of water by the sun. STATE OF THE ARCTIC MARINE BIODIVERSITY REPORT - <a href="https://arcticbiodiversity.is/marine" target="_blank">Chapter 2</a> - Page 25 - Figure 2.3
-
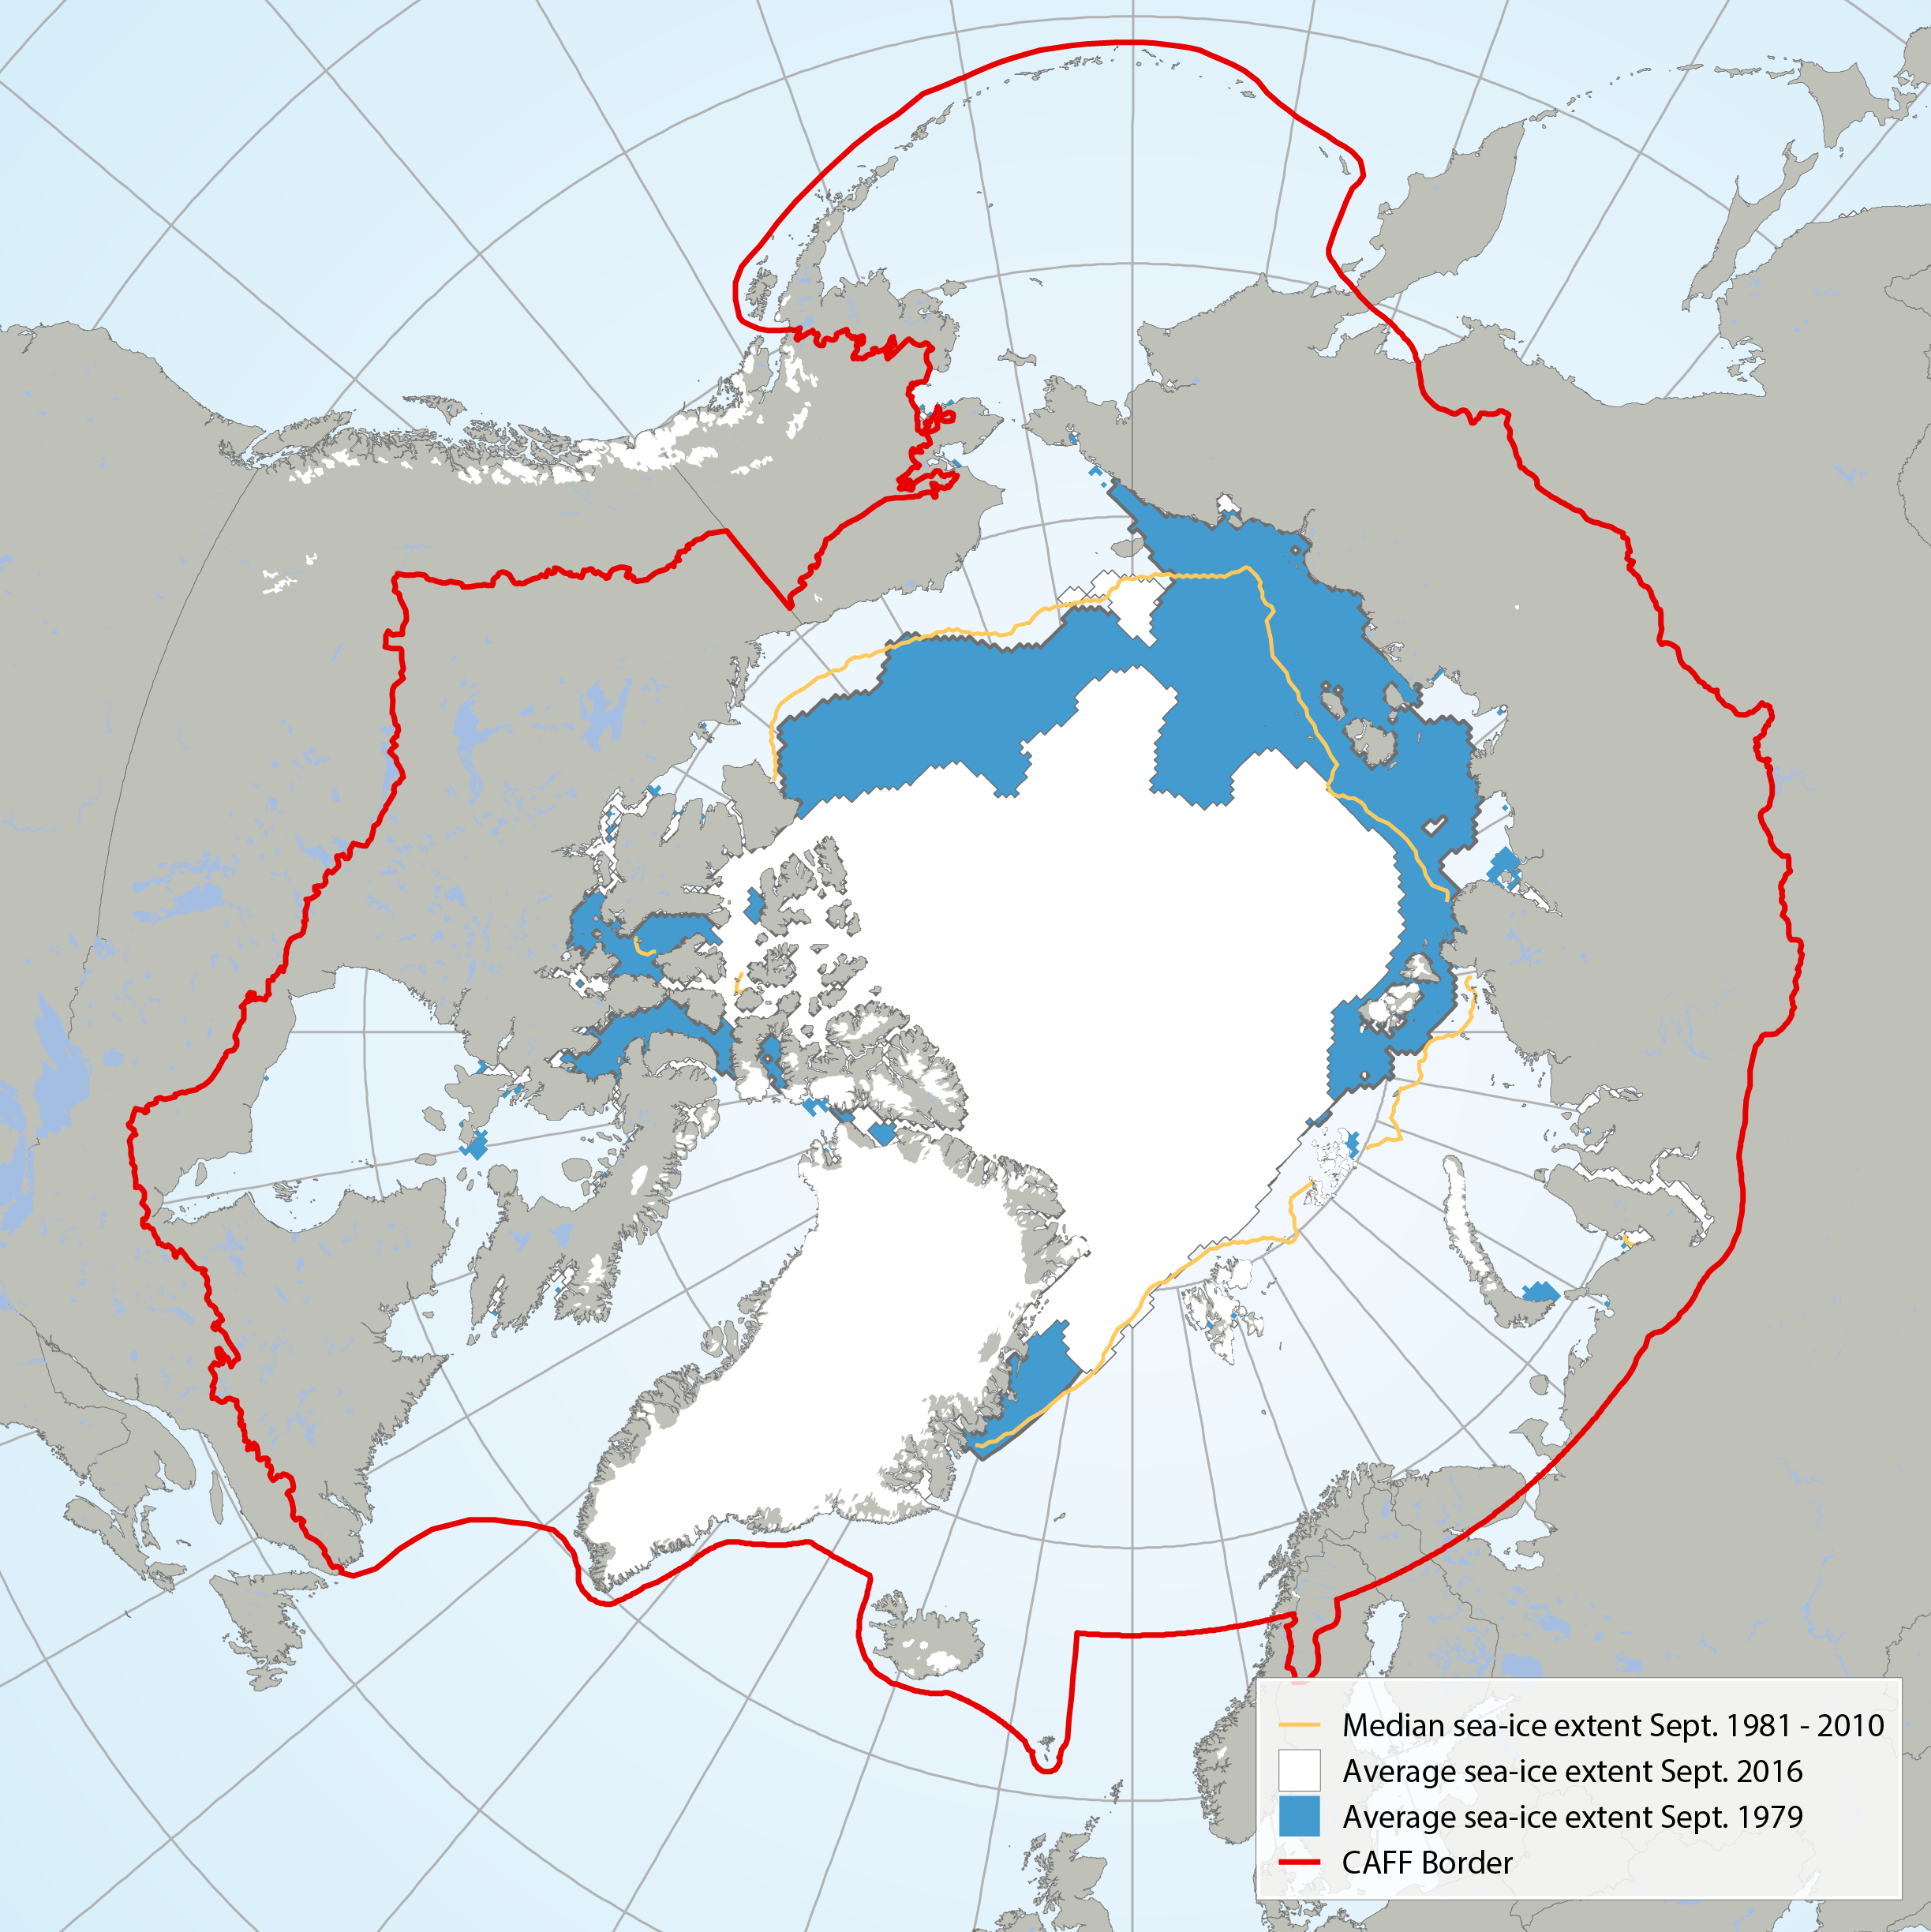
Average September sea ice extent in 1979 (blue) compared with 2016 (white) and the median sea ice extent (yellow line) from 1981 to 2010 (Data: NSDIC 2016). STATE OF THE ARCTIC MARINE BIODIVERSITY REPORT - <a href="https://arcticbiodiversity.is/marine" target="_blank">Chapter 2</a> - Page 27 - Figure 2.4
-
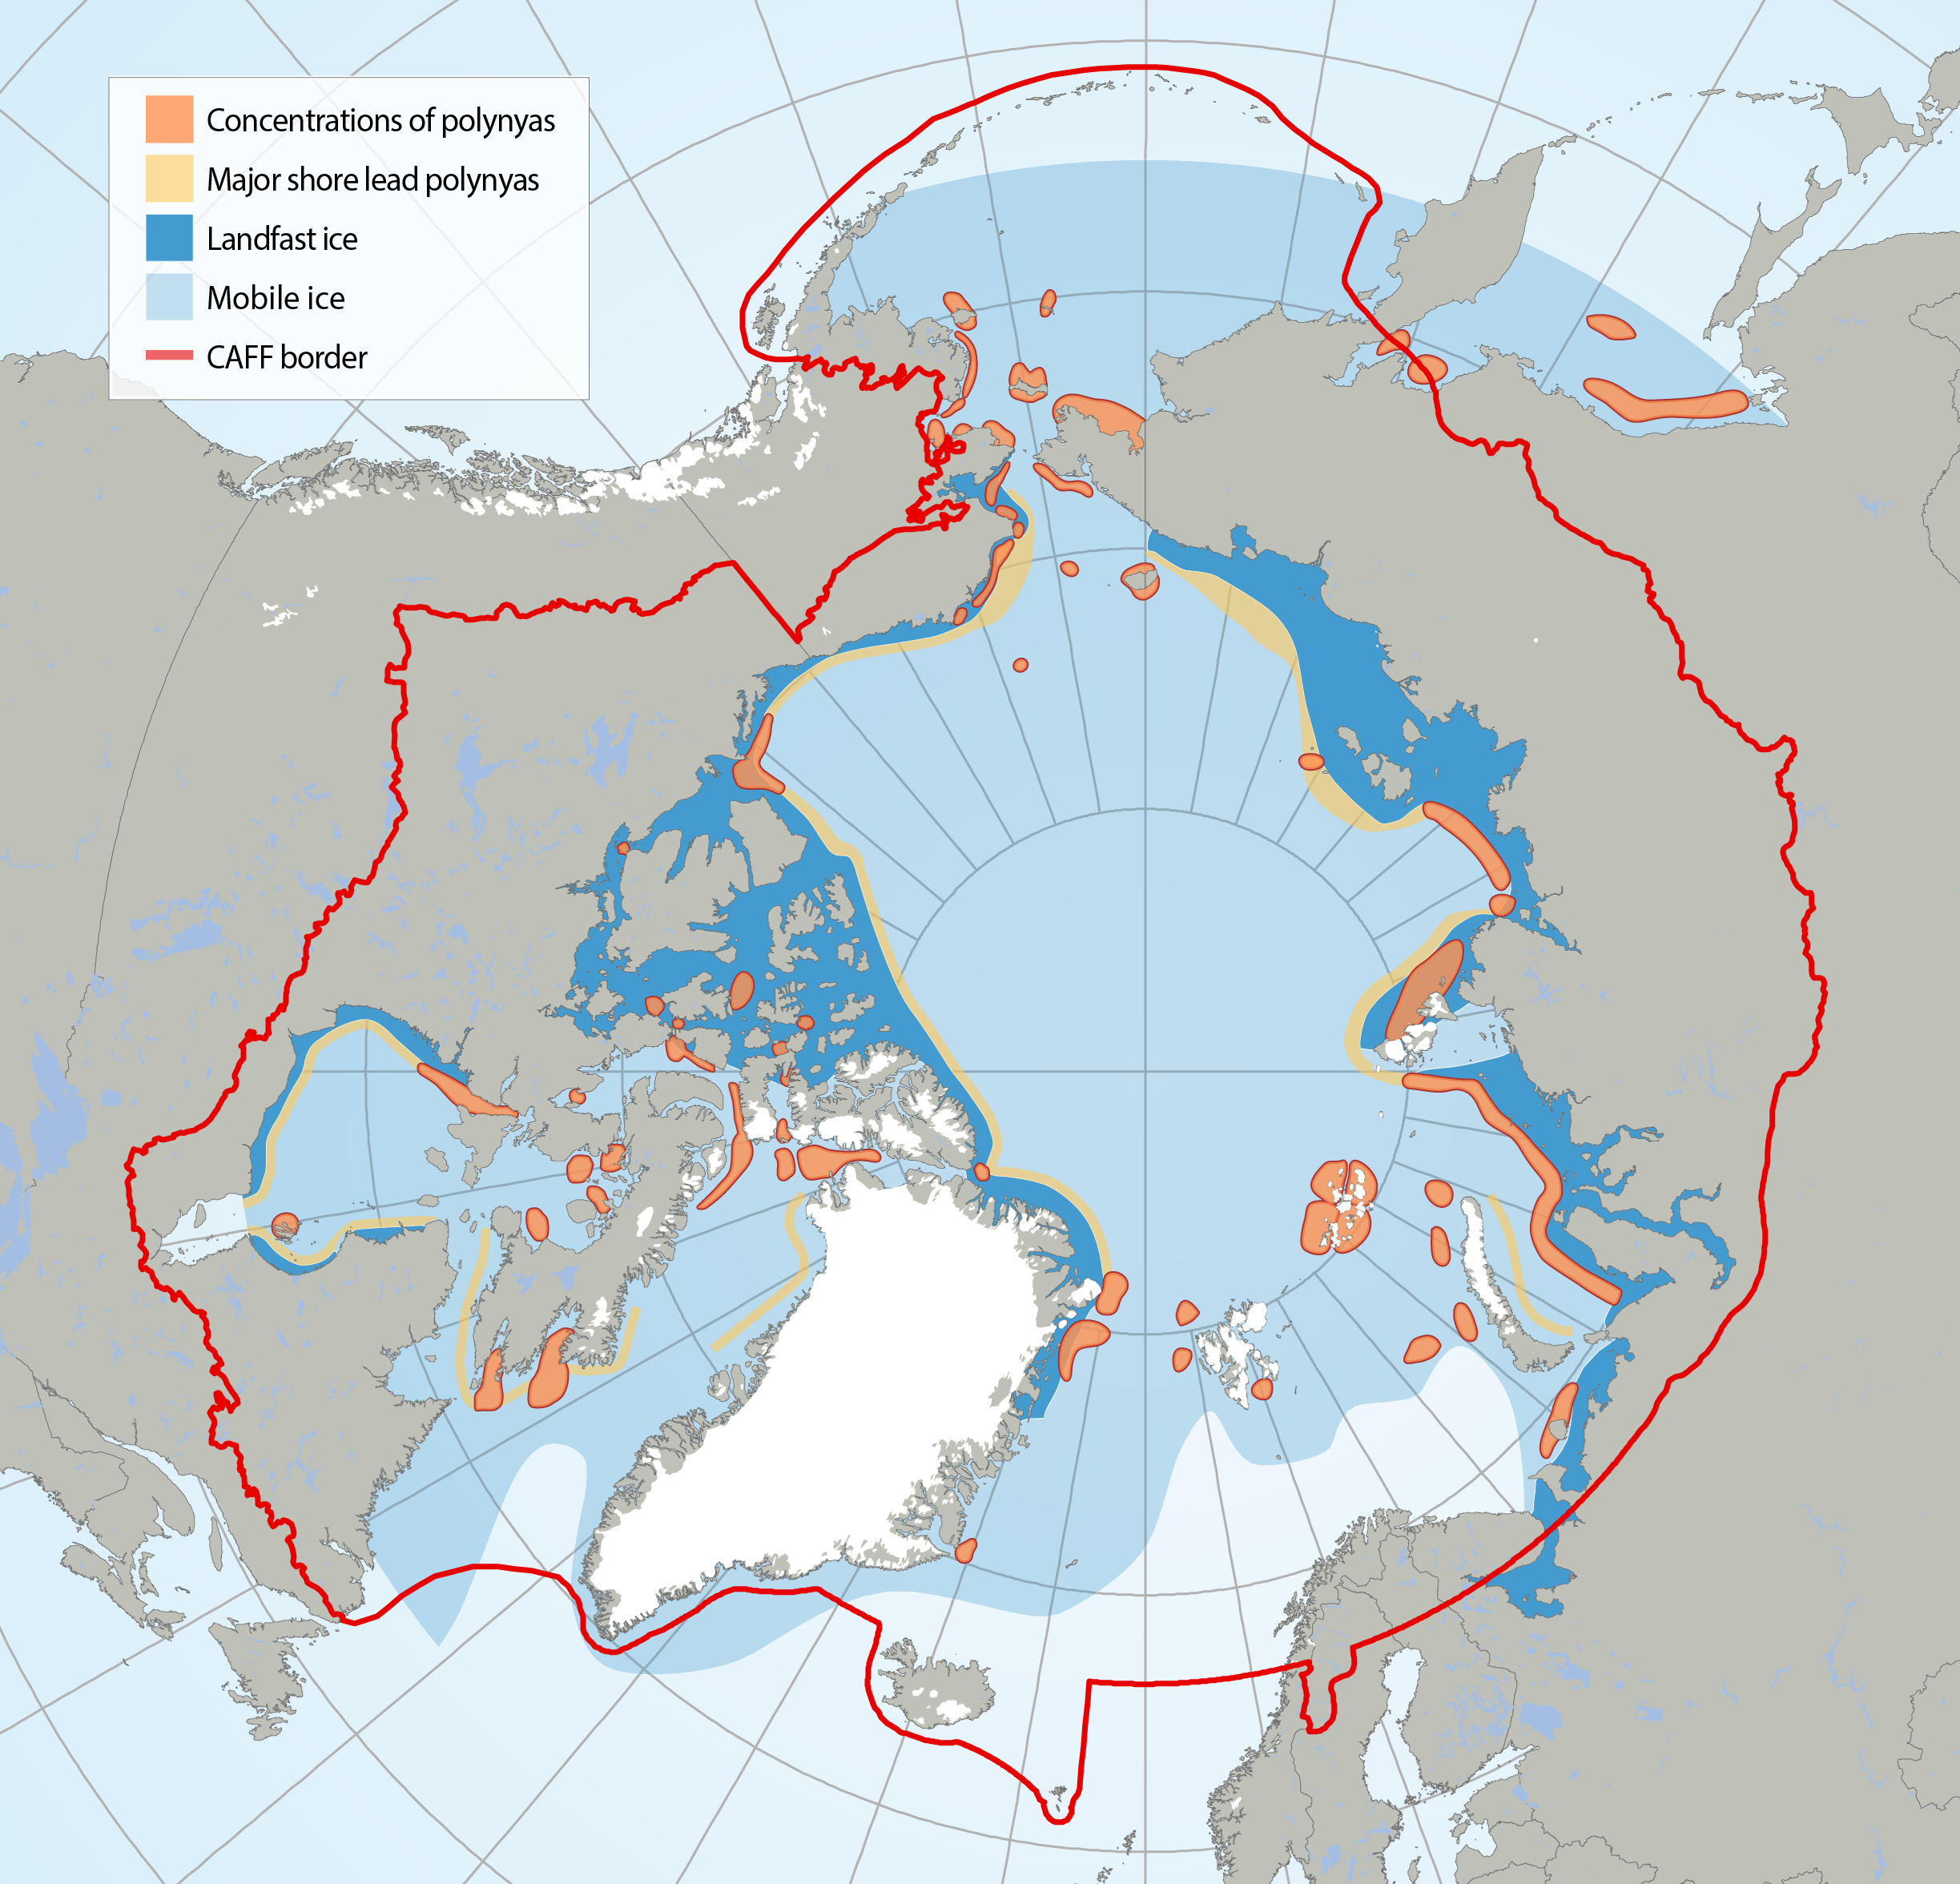
Circumpolar map of known polynyas. Note that polynyas are dynamic systems and some may no longer exist in the form known from their recent history. Adapted from Meltofte (2013) and based on Barber and Massom (2007). STATE OF THE ARCTIC MARINE BIODIVERSITY REPORT - <a href="https://arcticbiodiversity.is/marine" target="_blank">Chapter 2</a> - Page 28 - Figure 2.5
-
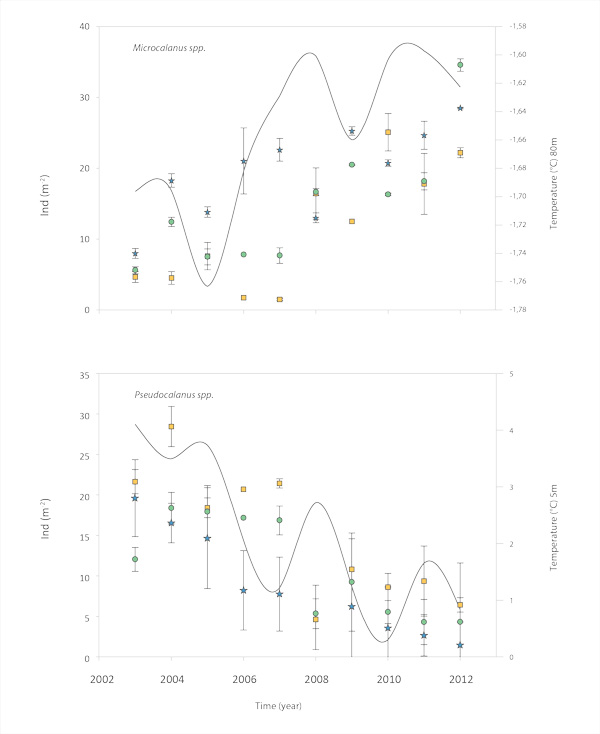
Temperature and copepod abundance in Zackenberg, northeastern Greenland. Temperature is measured at 80 m for Microcalanus and 5 m for Pseudocalanus (Arendt et al. 2016). STATE OF THE ARCTIC MARINE BIODIVERSITY REPORT - <a href="https://arcticbiodiversity.is/findings/plankton" target="_blank">Chapter 3</a> - Page 76 - Figure 3.2.7