 CAFF - Arctic Biodiversity Data Service (ABDS)
Conservation of Arctic Flora and Fauna (CAFF)
Type of resources
Available actions
Topics
Keywords
Contact for the resource
Provided by
Years
Formats
Representation types
Update frequencies
status
Service types
Scale
-
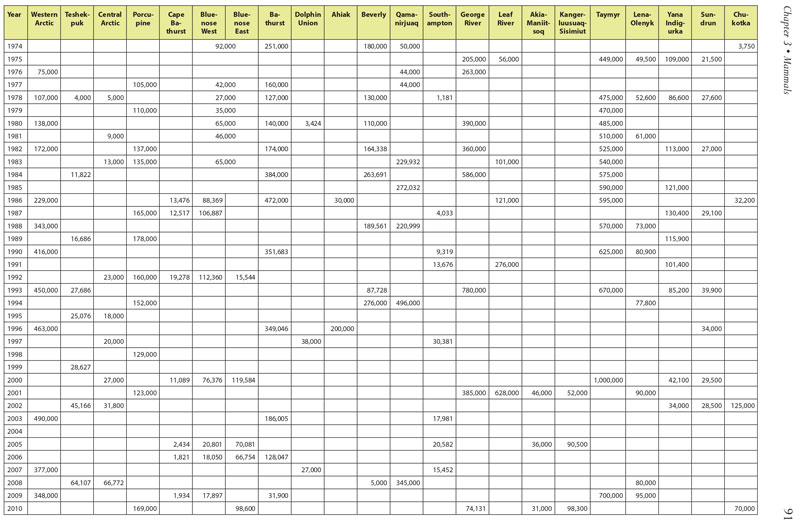
Table 3.1. Summary of historical population estimates for 22 circumpolar caribou and wild reindeer herds. Data courtesy of Circum-Arctic Rangifer Monitoring Assessment Network (CARMA) and D.E. Russell & A. Gunn; www.carmanetwork.com/display/ public/home. Data vary substantially among herds and over time in accuracy and precision, and represent only general patterns of abundance. Conservation of Arctic Flora and Fauna, CAFF 2013 - Akureyri . Arctic Biodiversity Assessment. Status and Trends in Arctic biodiversity. - Mammals(Chapter 3) page 91
-
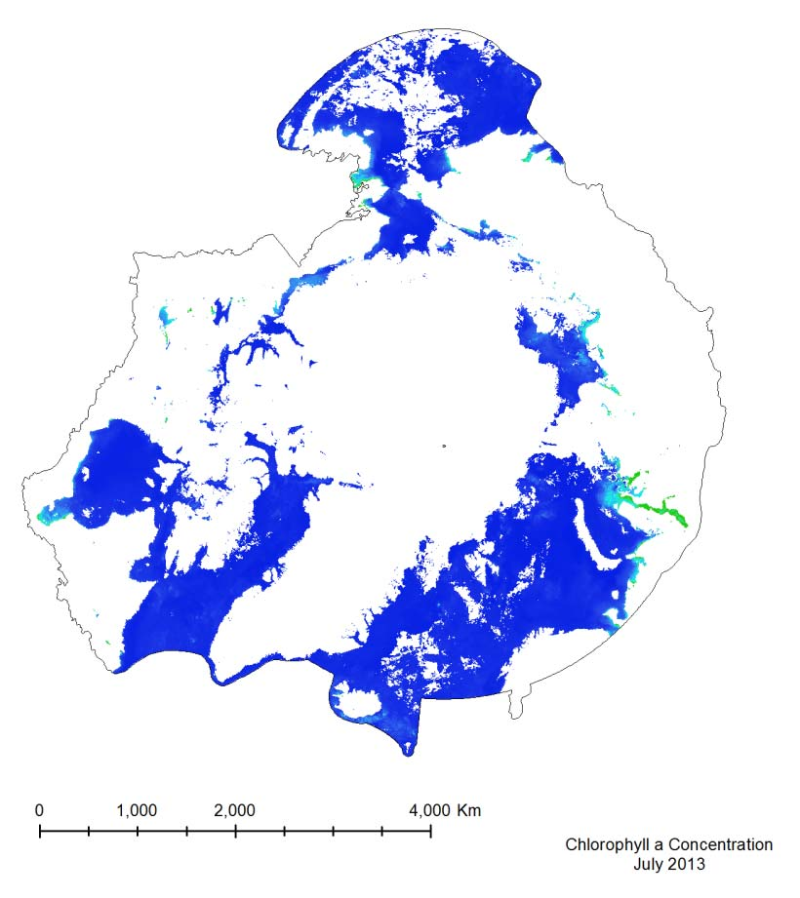
The MODIS marine chlorophyll a product provided, similar to SST, is a 4 km global monthly composite based on smaller resolution daily imagery compiled by NASA. The imagery is reliant on clear ocean (free of clouds and ice) so only months from March to October have been provided, as the chlorophyll levels in the Arctic diminish during the winter months, when sea ice is prevalent. The marine chlorophyll a is measured in mg/m3
-
The Land Cover Dynamics MODIS product is a yearly product that represents thetiming of vegetation phenology globally. Sub-datasets include vegetation growth, maturity,senescence, and dormancy. This product also includes the NBAR-(Nadir Bidirectionalreflectance distribution function (BRDF) adjusted Reflectance) based EVI, in part becausethe EVI is used to create the Land Cover Dynamics. The Land Cover Dynamics product uses both Terra and Aqua MODIS data. Version005 (provided) has a 500 m spatial resolution, which is an improvement from the 1,000 mversion 004 product. This product is only available in MODIS tiles, so the tiles needed tocover the CAFF pan-Arctic region has been downloaded but not clipped to the pan-Arcticextent at this time.
-
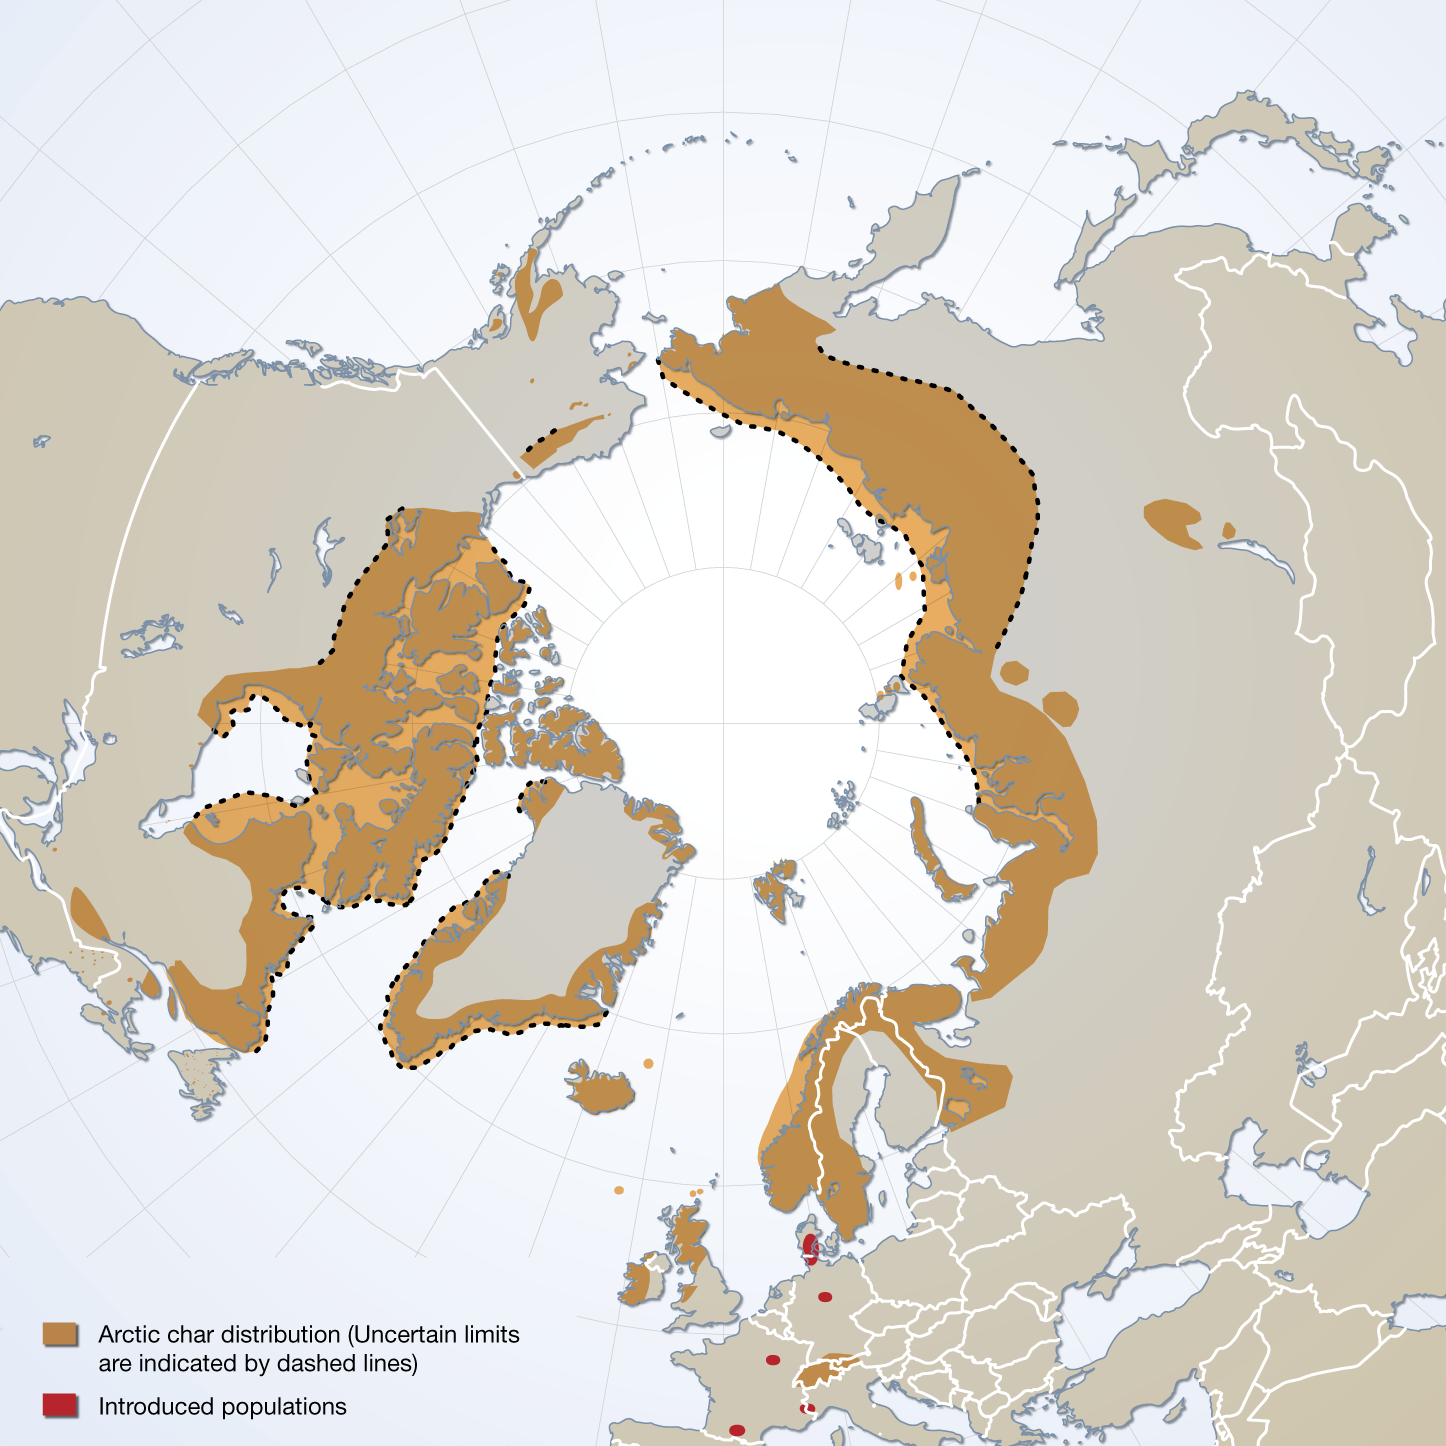
The distribution of Arctic char species complex, sensu stricto, and the location of introduced populations. Published in the Arctic Biodiversity trends 2010, Indicator #06 Arctic char, page 41 - released in May 2010
-
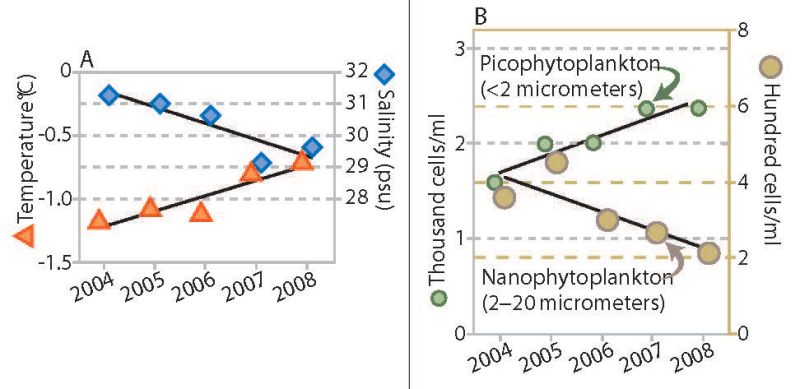
Trends in water temperature and salinity (A) and density of phytoplankton of two size ranges (B), Canada Basin, 2004 to 2008. Stratification of the water column increased throughout the Canada Basin over a recent five-year period, accompanied by a change in phytoplankton communities. The upper ocean layer showed trends of increased temperature and decreased salinity (Figure 18A), which combine to make this layer progressively less dense. The layer of water below this did not change in density over this period (not shown). The larger size class of phytoplankton (which would include diatoms) decreased in abundance, while the smaller types of plankton increased (Figure 18B). In addition to the trends shown, nutrient content in the upper ocean water layer decreased. Abundance of microbes (bacteria and similar organisms) that subsist on organic matter increased. Total phytoplankton biomass, however, remained unchanged. If this trend towards smaller species of phytoplankton and microbes is sustained, it may lead to reduced production of zooplankton, an impact that would be transmitted through the food web to birds, fish and mammals. Published in the Life Linked to Ice released in 2013, page 30. Life Linked to Ice: A guide to sea-ice-associated biodiversity in this time of rapid change. CAFF Assessment Series No. 10. Conservation of Arctic Flora and Fauna, Iceland. ISBN: 978-9935-431-25-7.
-
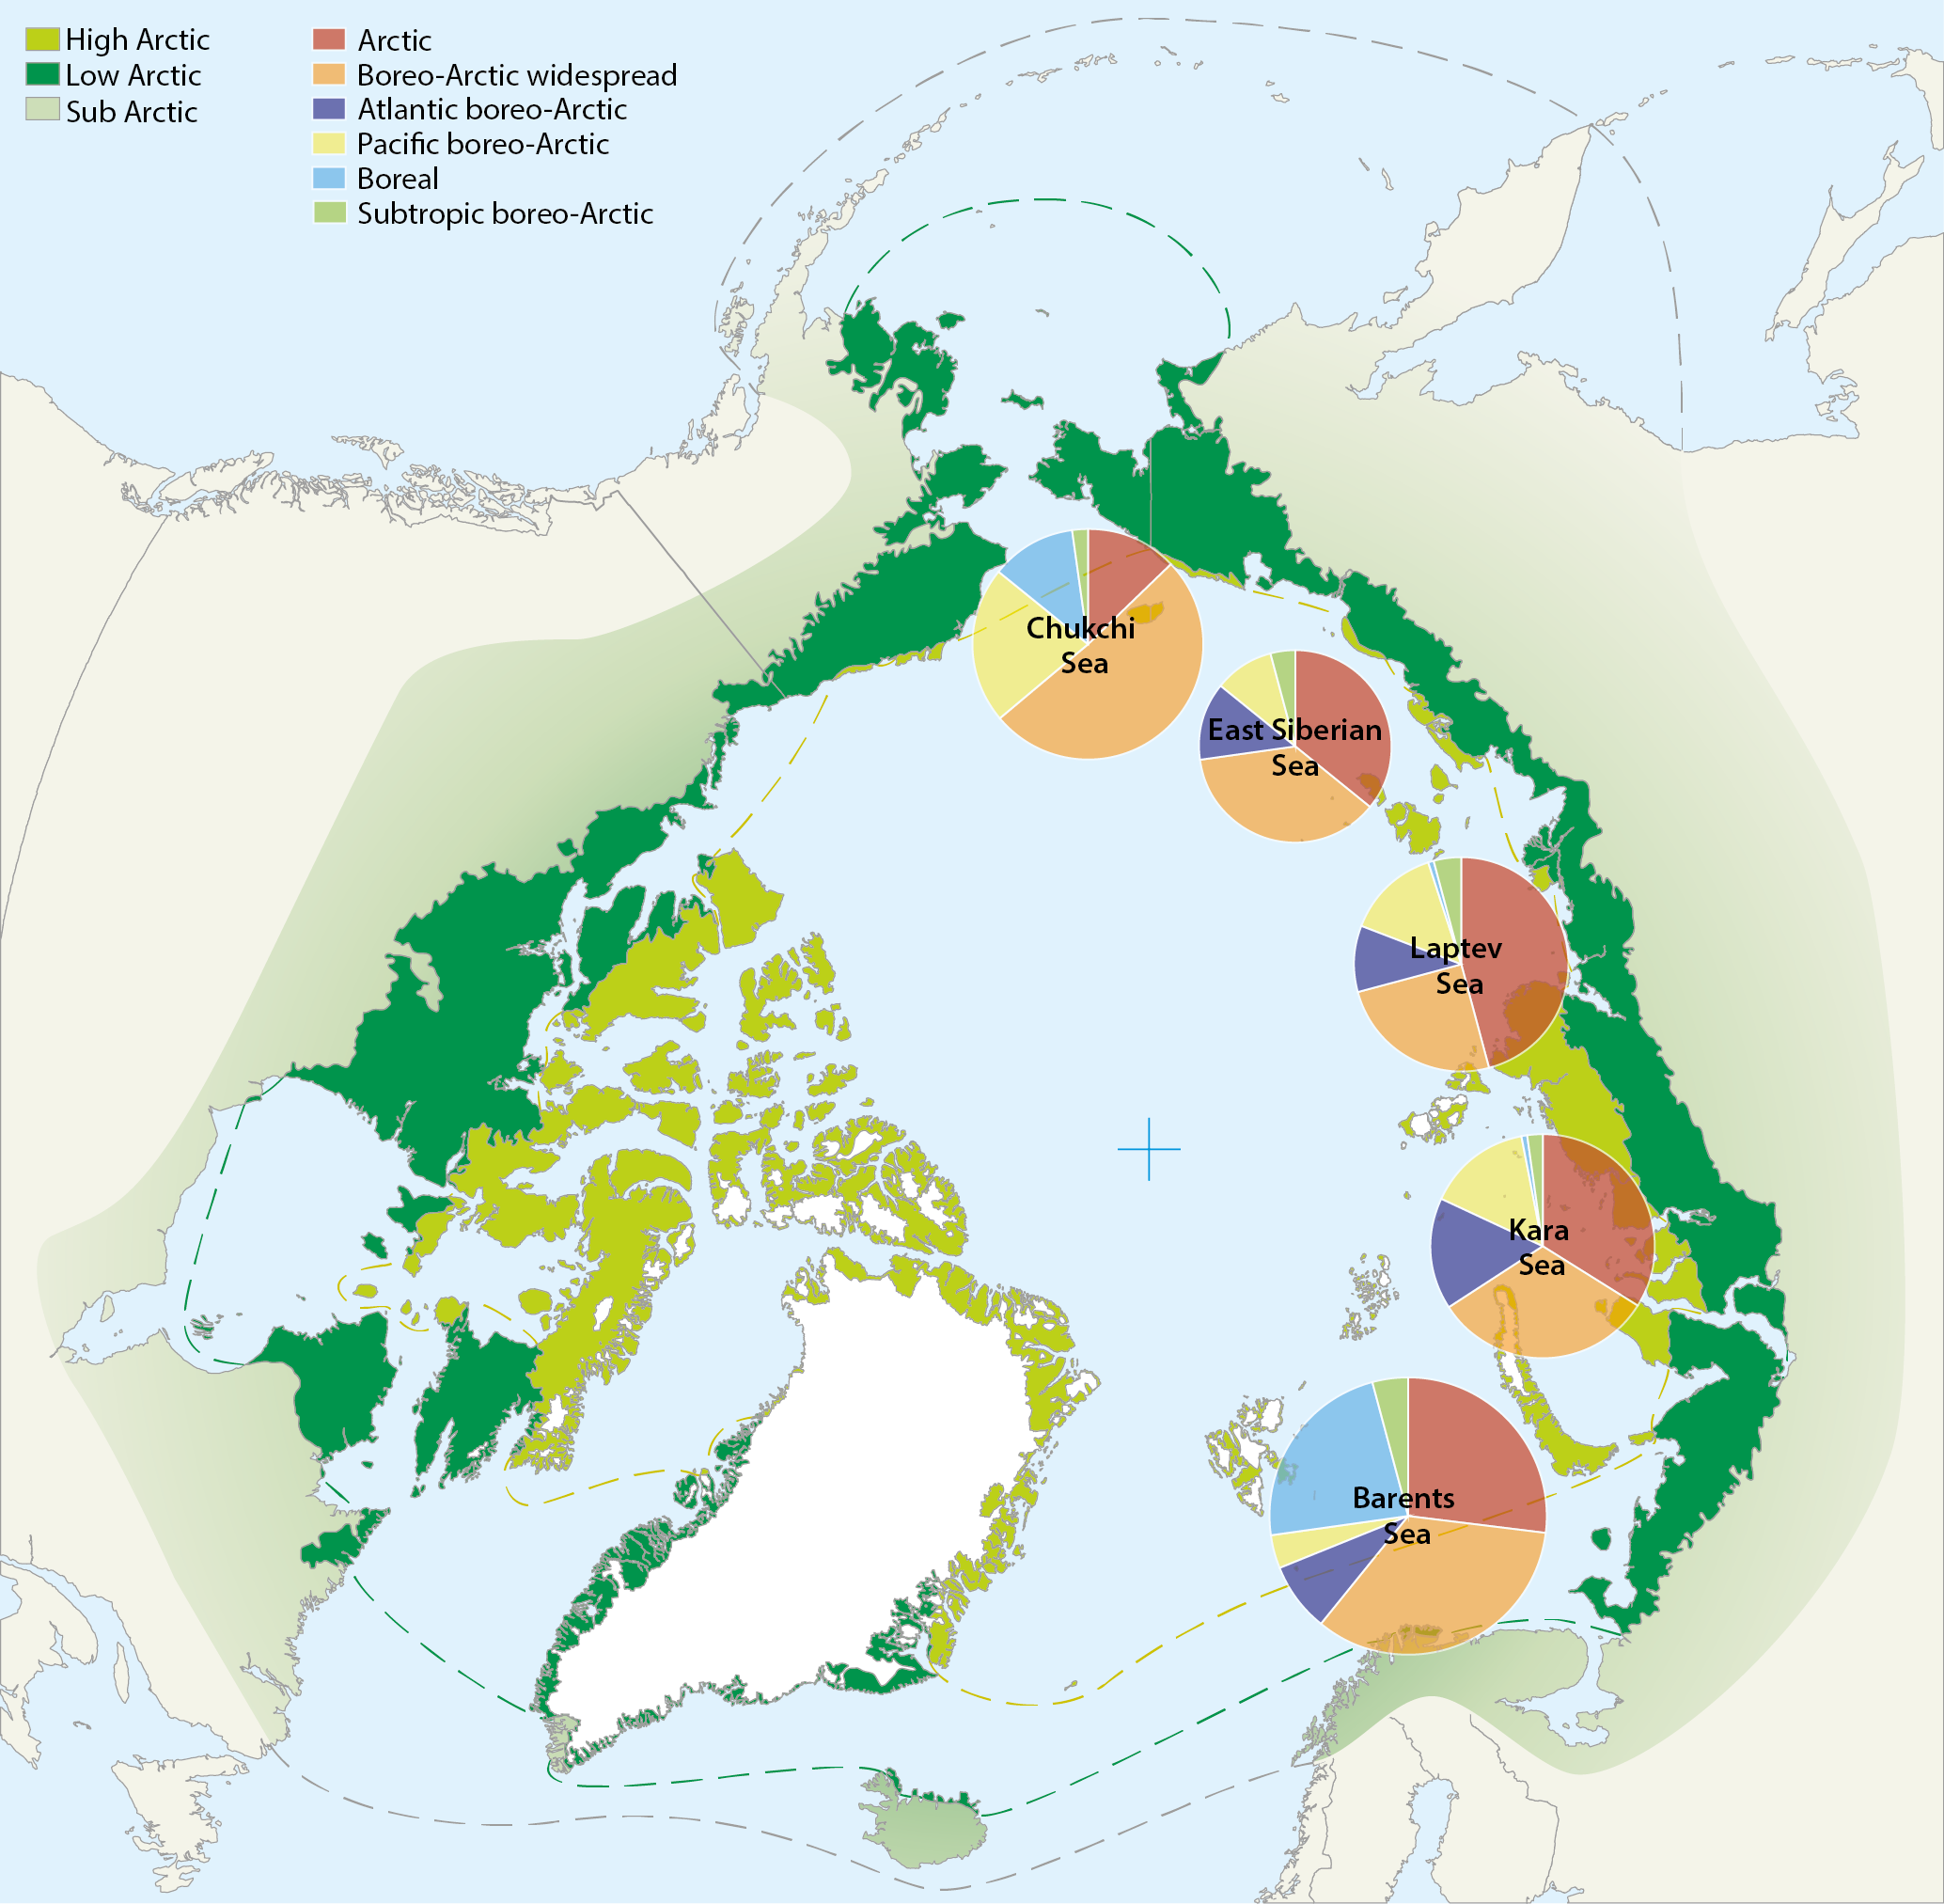
Map of the Arctic Ocean showing the distribution of species richness of Bryozoa for different shelf seas along the Eurasian continental shelf. Diameters of circles are proportional to the number of bryozoan species given in Tab. 8.3. Species numbers partitioned into six zoogeographical affinities are shown from the: Barents Sea (Denisenko 1990), Kara Sea (Gontar & Denisenko 1989); Laptev Sea (Gontar 2004), East Siberian Sea (Denisenko 2010), Chukchi Sea (Denisenko 2008). Conservation of Arctic Flora and Fauna, CAFF 2013 - Akureyri . Arctic Biodiversity Assessment. Status and Trends in Arctic biodiversity. - Marine Invertebrates(Chapter 8) page 282
-
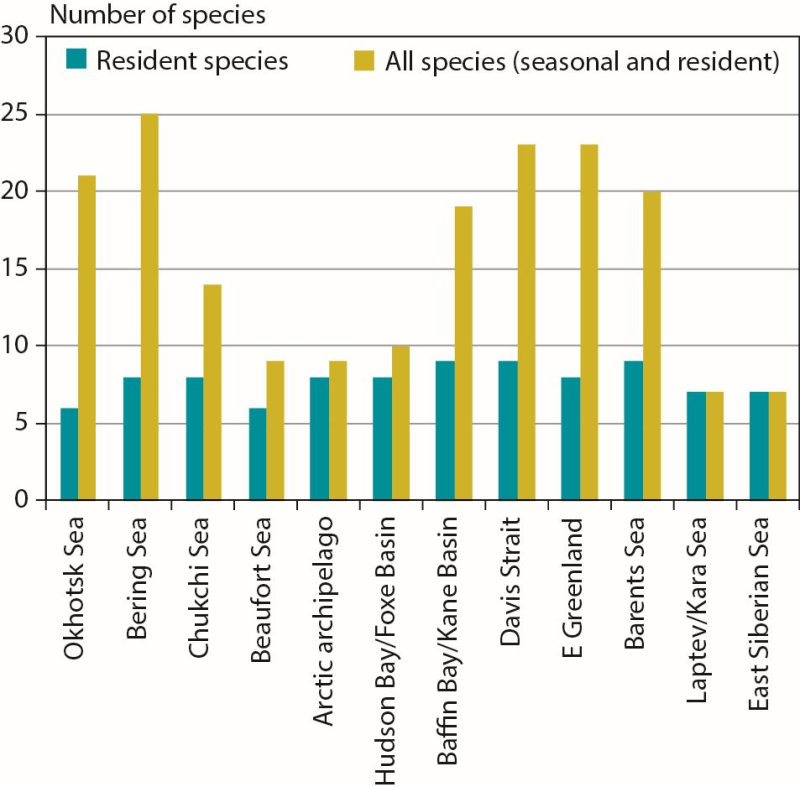
Number of marine mammal species in Arctic marine regions classified by resident species (n = 11 total) or all species (including seasonal visitors, n = 35 total). CAFF 2013. Arctic Biodiversity Assessment. Status and Trends in Arctic biodiversity. Conservation of Arctic Flora and Fauna, Akureyri - Mammal (Chapter 3) page 84
-
Extensive oil and gas activity has occurred in the Arctic, primarily land-based, with Russia extracting 80% of the oil and 99% of the gas to date (AMAP 2008). Furthermore, the Arctic still contains large petroleum hydrocarbon reserves and potentially holds one fifth of the world’s yet undiscovered resources, according to the US Geological Survey (USGS 2008) (Fig. 14.4). While much of the currently known Arctic oil and gas reserves are in Russia (75% of oil and 90% of gas; AMAP 2008), more than half of the estimated undiscovered Arctic oil reserves are in Alaska (offshore and onshore), the Amerasian Basin (offshore north of the Beaufort Sea) and in W and E Greenland (offshore). More than 70% of the Arctic undiscovered natural gas is estimated to be located in the W Siberian Basin (Yamal Peninsula and offshore in the Kara Sea), the E Barents Basin and in Alaska (offshore and onshore) (AMSA 2009). Associated with future exploration and development, each of these regions would require vastly expanded Arctic marine operations, and several regions such as offshore Greenland would require fully developed Arctic marine transport systems to carry hydrocarbons to global markets. In this context, regions of high interest for economic development face cumulative environmental pressure from anthropogenic activities such as hydrocarbon exploitation locally, together with global changes associated with climatic and oceanographic trends. Conservation of Arctic Flora and Fauna, CAFF 2013 - Akureyri . Arctic Biodiversity Assessment. Status and Trends in Arctic biodiversity. - Marine ecosystems (Chapter 14 - page 501). Figure adapted from the USGS
-
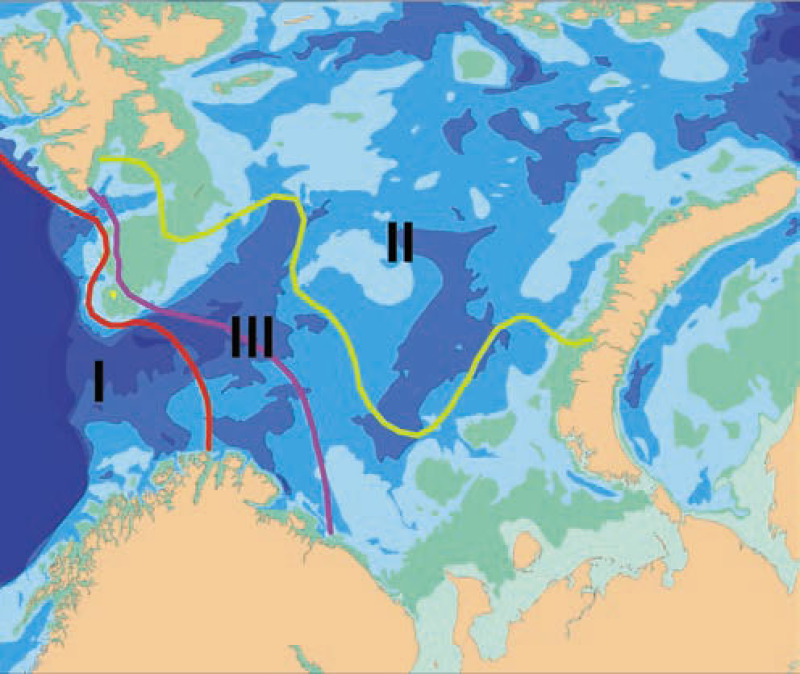
Biogeographic borders in the Barents Sea based on species distributions of bryozoans. Average position of the border with 50:50% of Atlantic boreal and Arctic species numbers is indicated by the pink line, and the red and green lines indicate the extreme positions of the border in cold and warm periods respectively. Area III between them is the transitional zone between the Atlantic boreal and the Arctic regions. Thus, area I always has > 50% Atlantic boreal species, and area II always > 50% Arctic species (after Denisenko 1990).
-
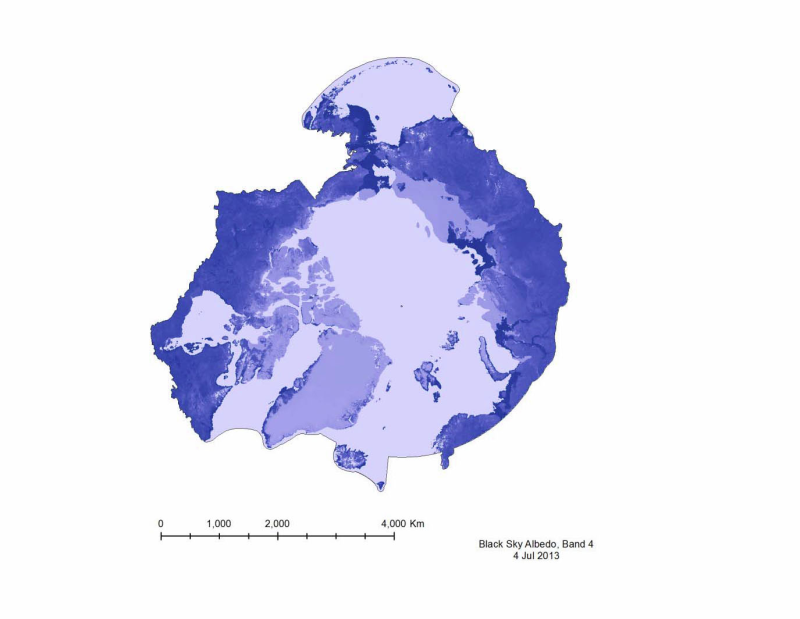
Albedo is a reflection coefficient that describes the reflecting power of a surface. Data compiled for CAFFs Land Cover Change Initiative with dataset for the firs of very month during 2001- 20112. - <a href="http://www.caff.is/indices-and-indicators/land-cover-change-index" target="_blank"> Land Cover Change Initiative (LCC)</a>