 CAFF - Arctic Biodiversity Data Service (ABDS)
Conservation of Arctic Flora and Fauna (CAFF)
Type of resources
Available actions
Topics
Keywords
Contact for the resource
Provided by
Years
Formats
Representation types
Update frequencies
status
Service types
Scale
-
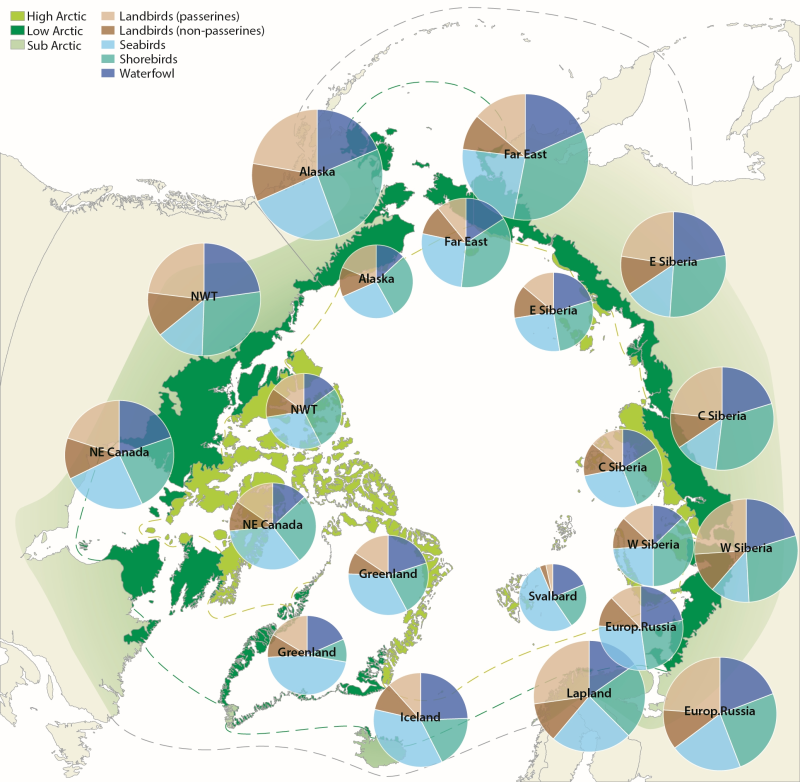
Figure 4.1. Avian biodiversity in different regions of the Arctic. Charts on the inner circle show species numbers of different bird groups in the high Arctic, on the outer circle in the low Arctic. The size of the charts is scaled to the number of species in each region, which ranges from 32 (Svalbard) to 117 (low Arctic Alaska). CAFF 2013. Arctic Biodiversity Assessment. Status and Trends in Arctic biodiversity. Conservation of Arctic Flora and Fauna, Akureyri - Birds (Chapter 4) page 145
-
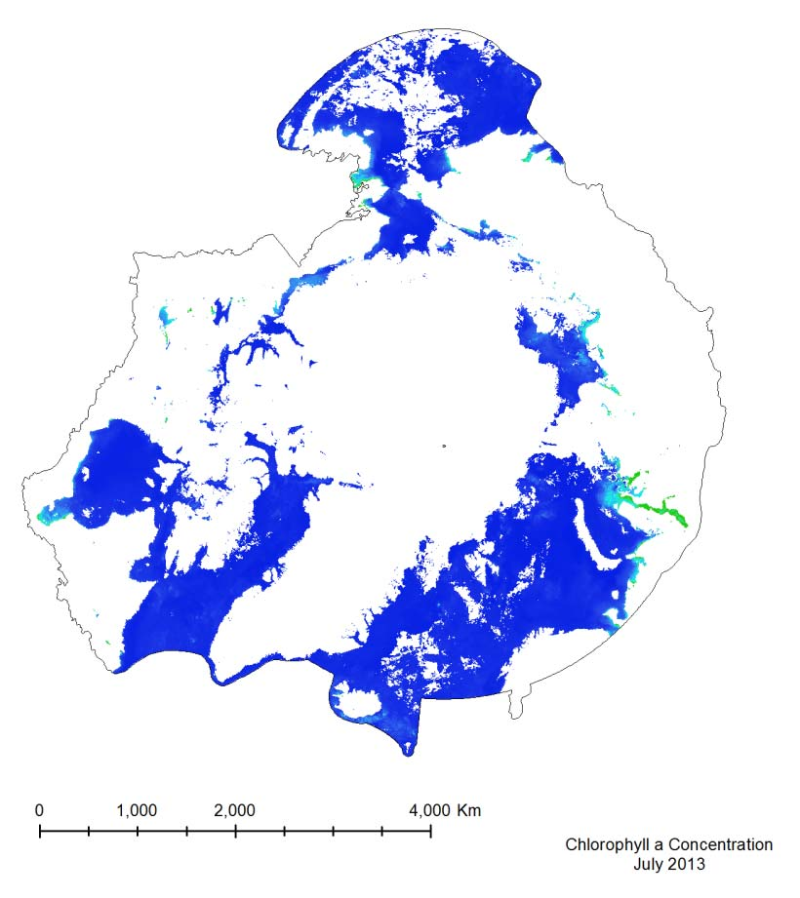
The MODIS marine chlorophyll a product provided, similar to SST, is a 4 km global monthly composite based on smaller resolution daily imagery compiled by NASA. The imagery is reliant on clear ocean (free of clouds and ice) so only months from March to October have been provided, as the chlorophyll levels in the Arctic diminish during the winter months, when sea ice is prevalent. The marine chlorophyll a is measured in mg/m3
-
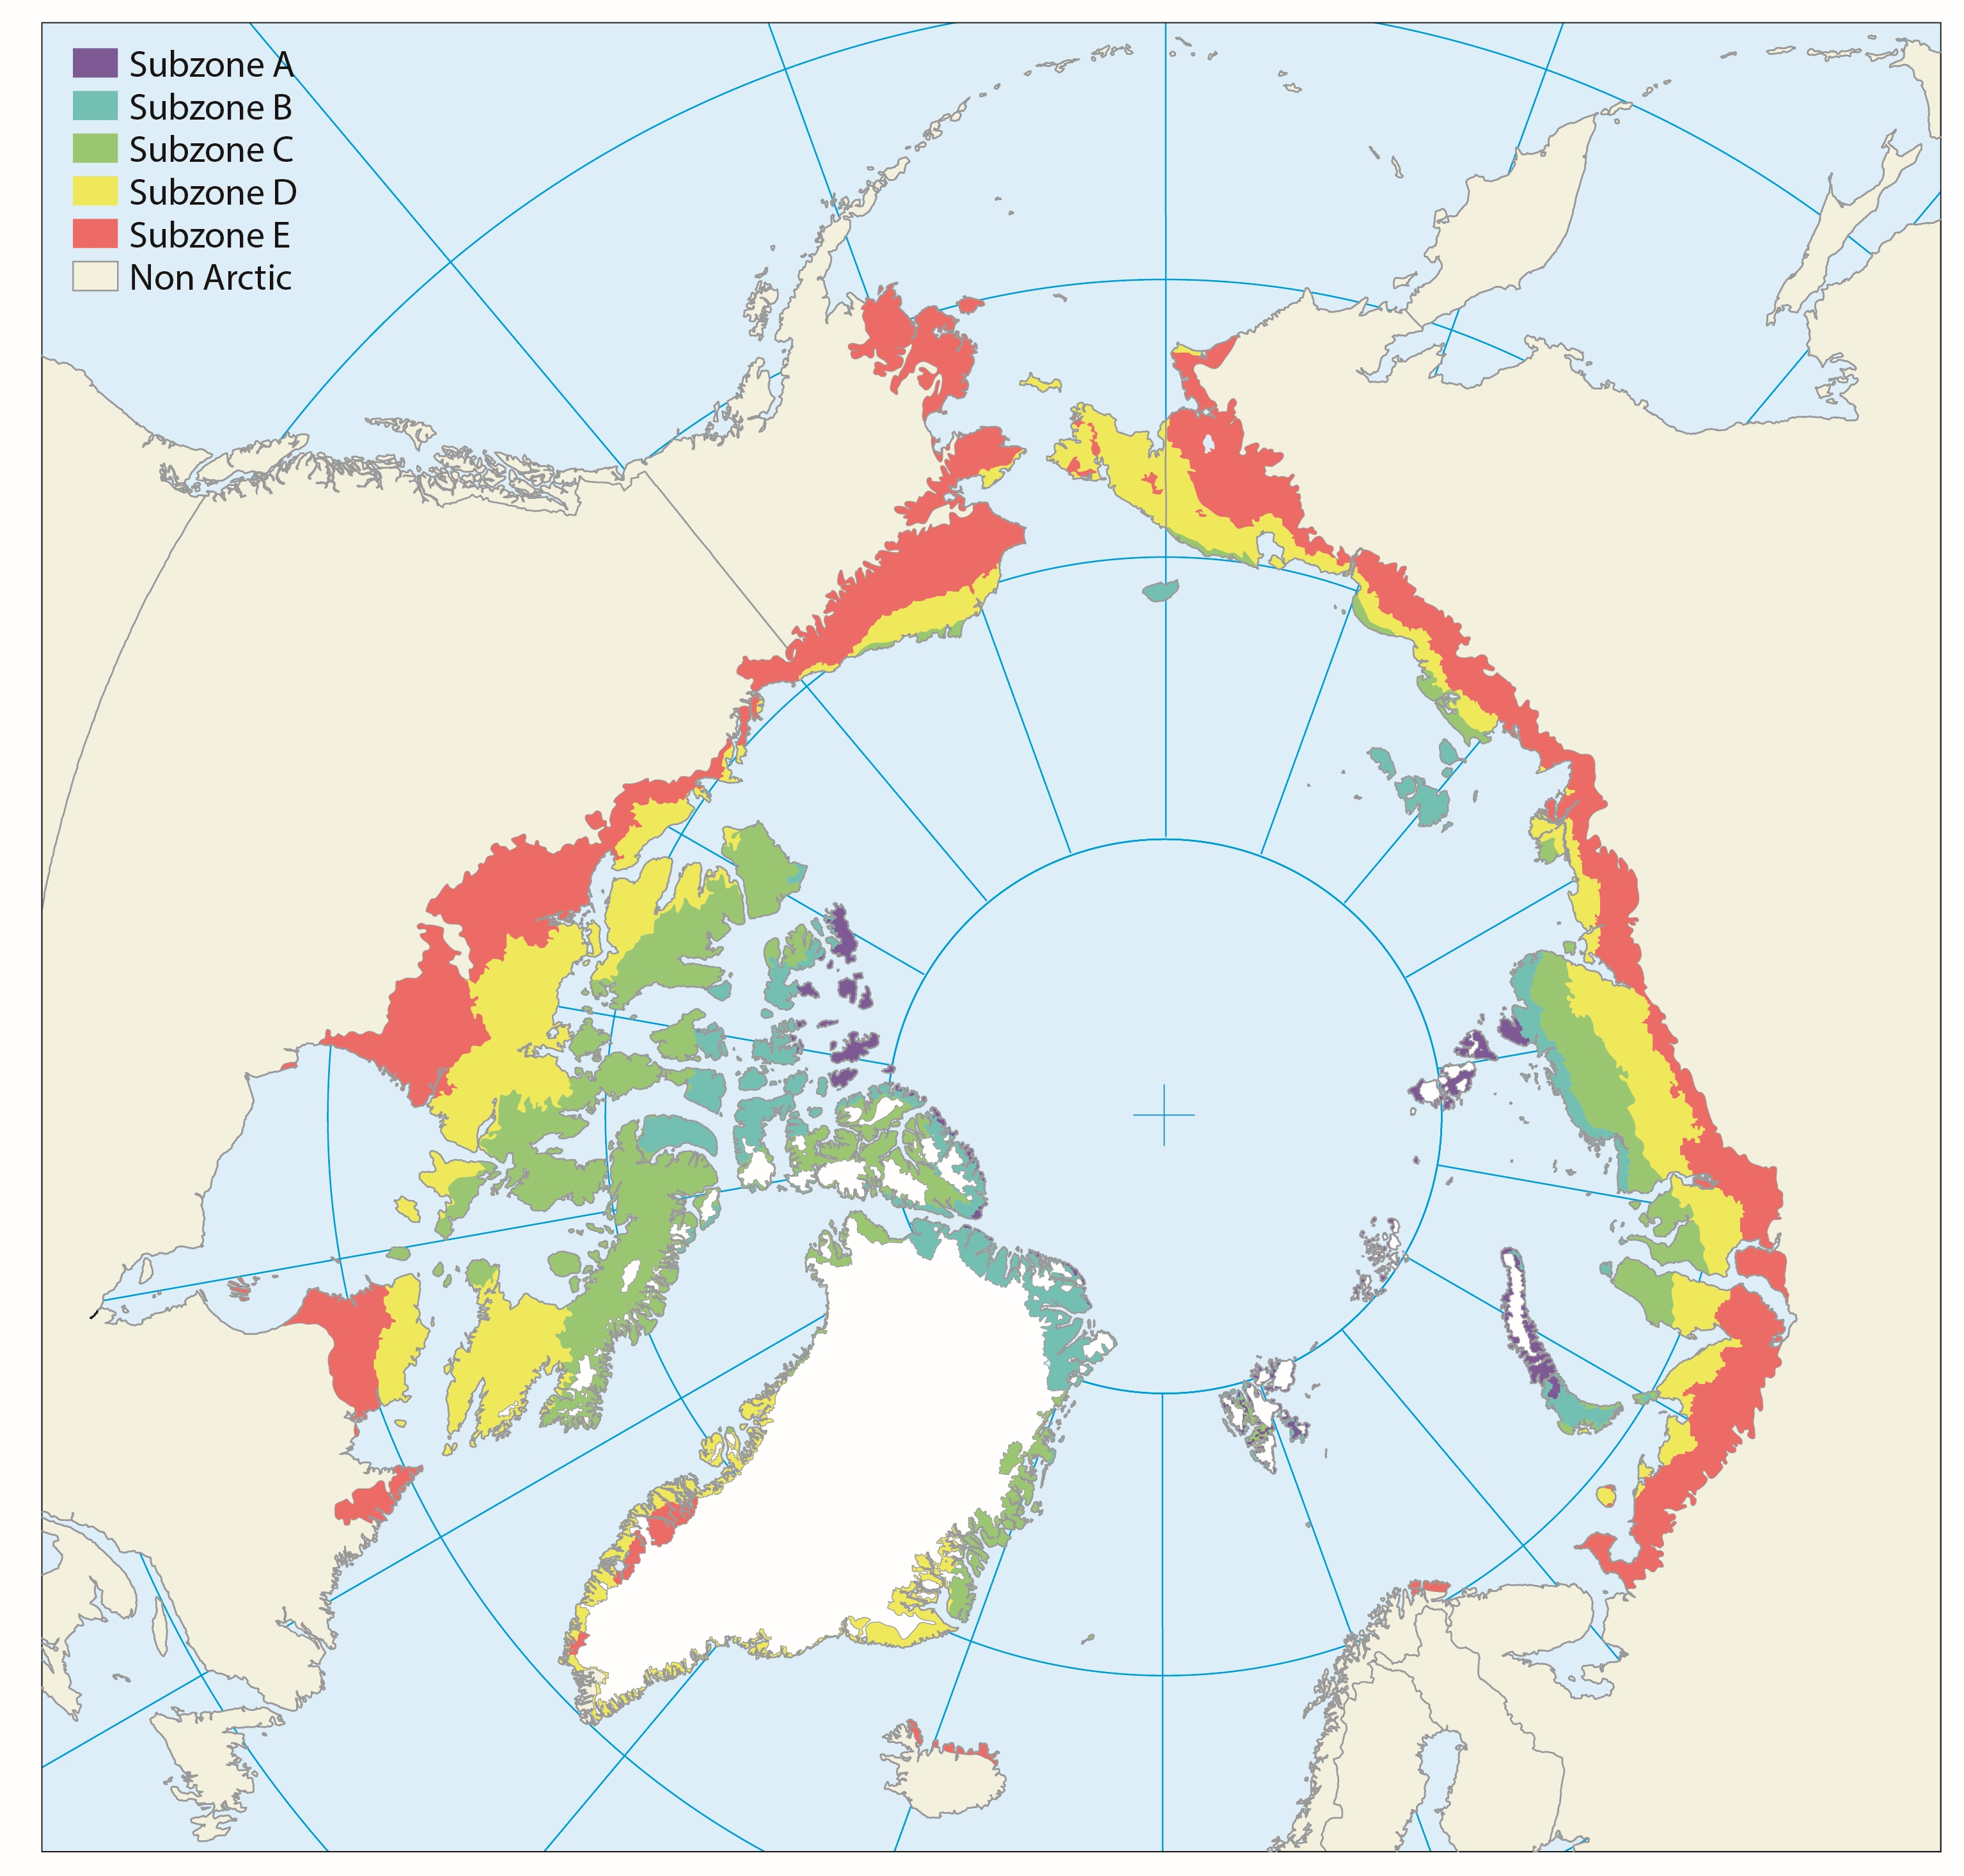
The Arctic territory is roughly subdivided along two main axes in latitudinal subzones (Fig. 9.1) and longitudinal floristic provinces (Fig. 9.2). The latitudinal northsouth axis mainly reflects the present climate gradient divided into five different subzones, which are separated according to climate and vegetation in the lowlands of each zone. Published in the Arctic Biodiversity Assessment, Chapter 9 - released in 2013
-
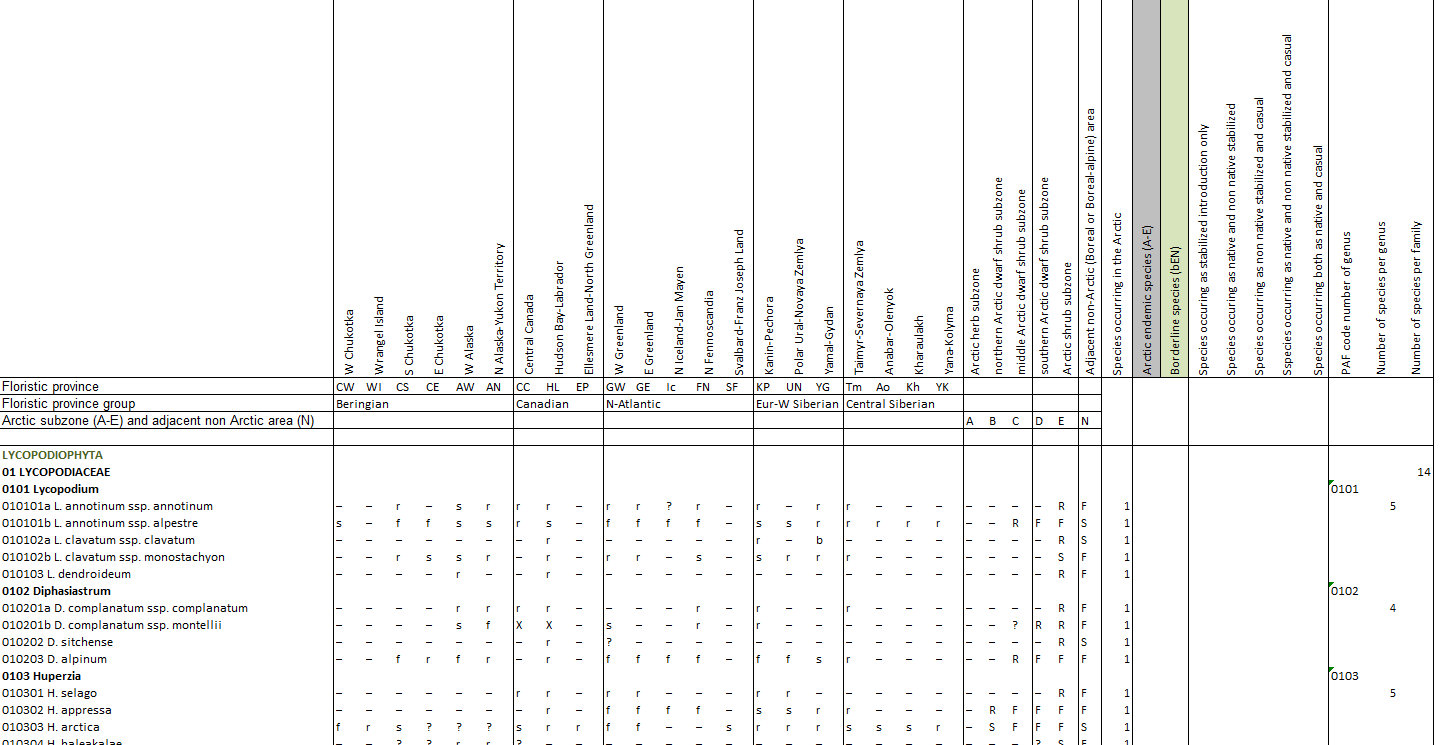
Appendix 9.1 List of all Arctic vascular plant species (with PAF code number) and their distribution in the 21 Arctic floristic provinces and 5 subzones based on Elven (2007).
-
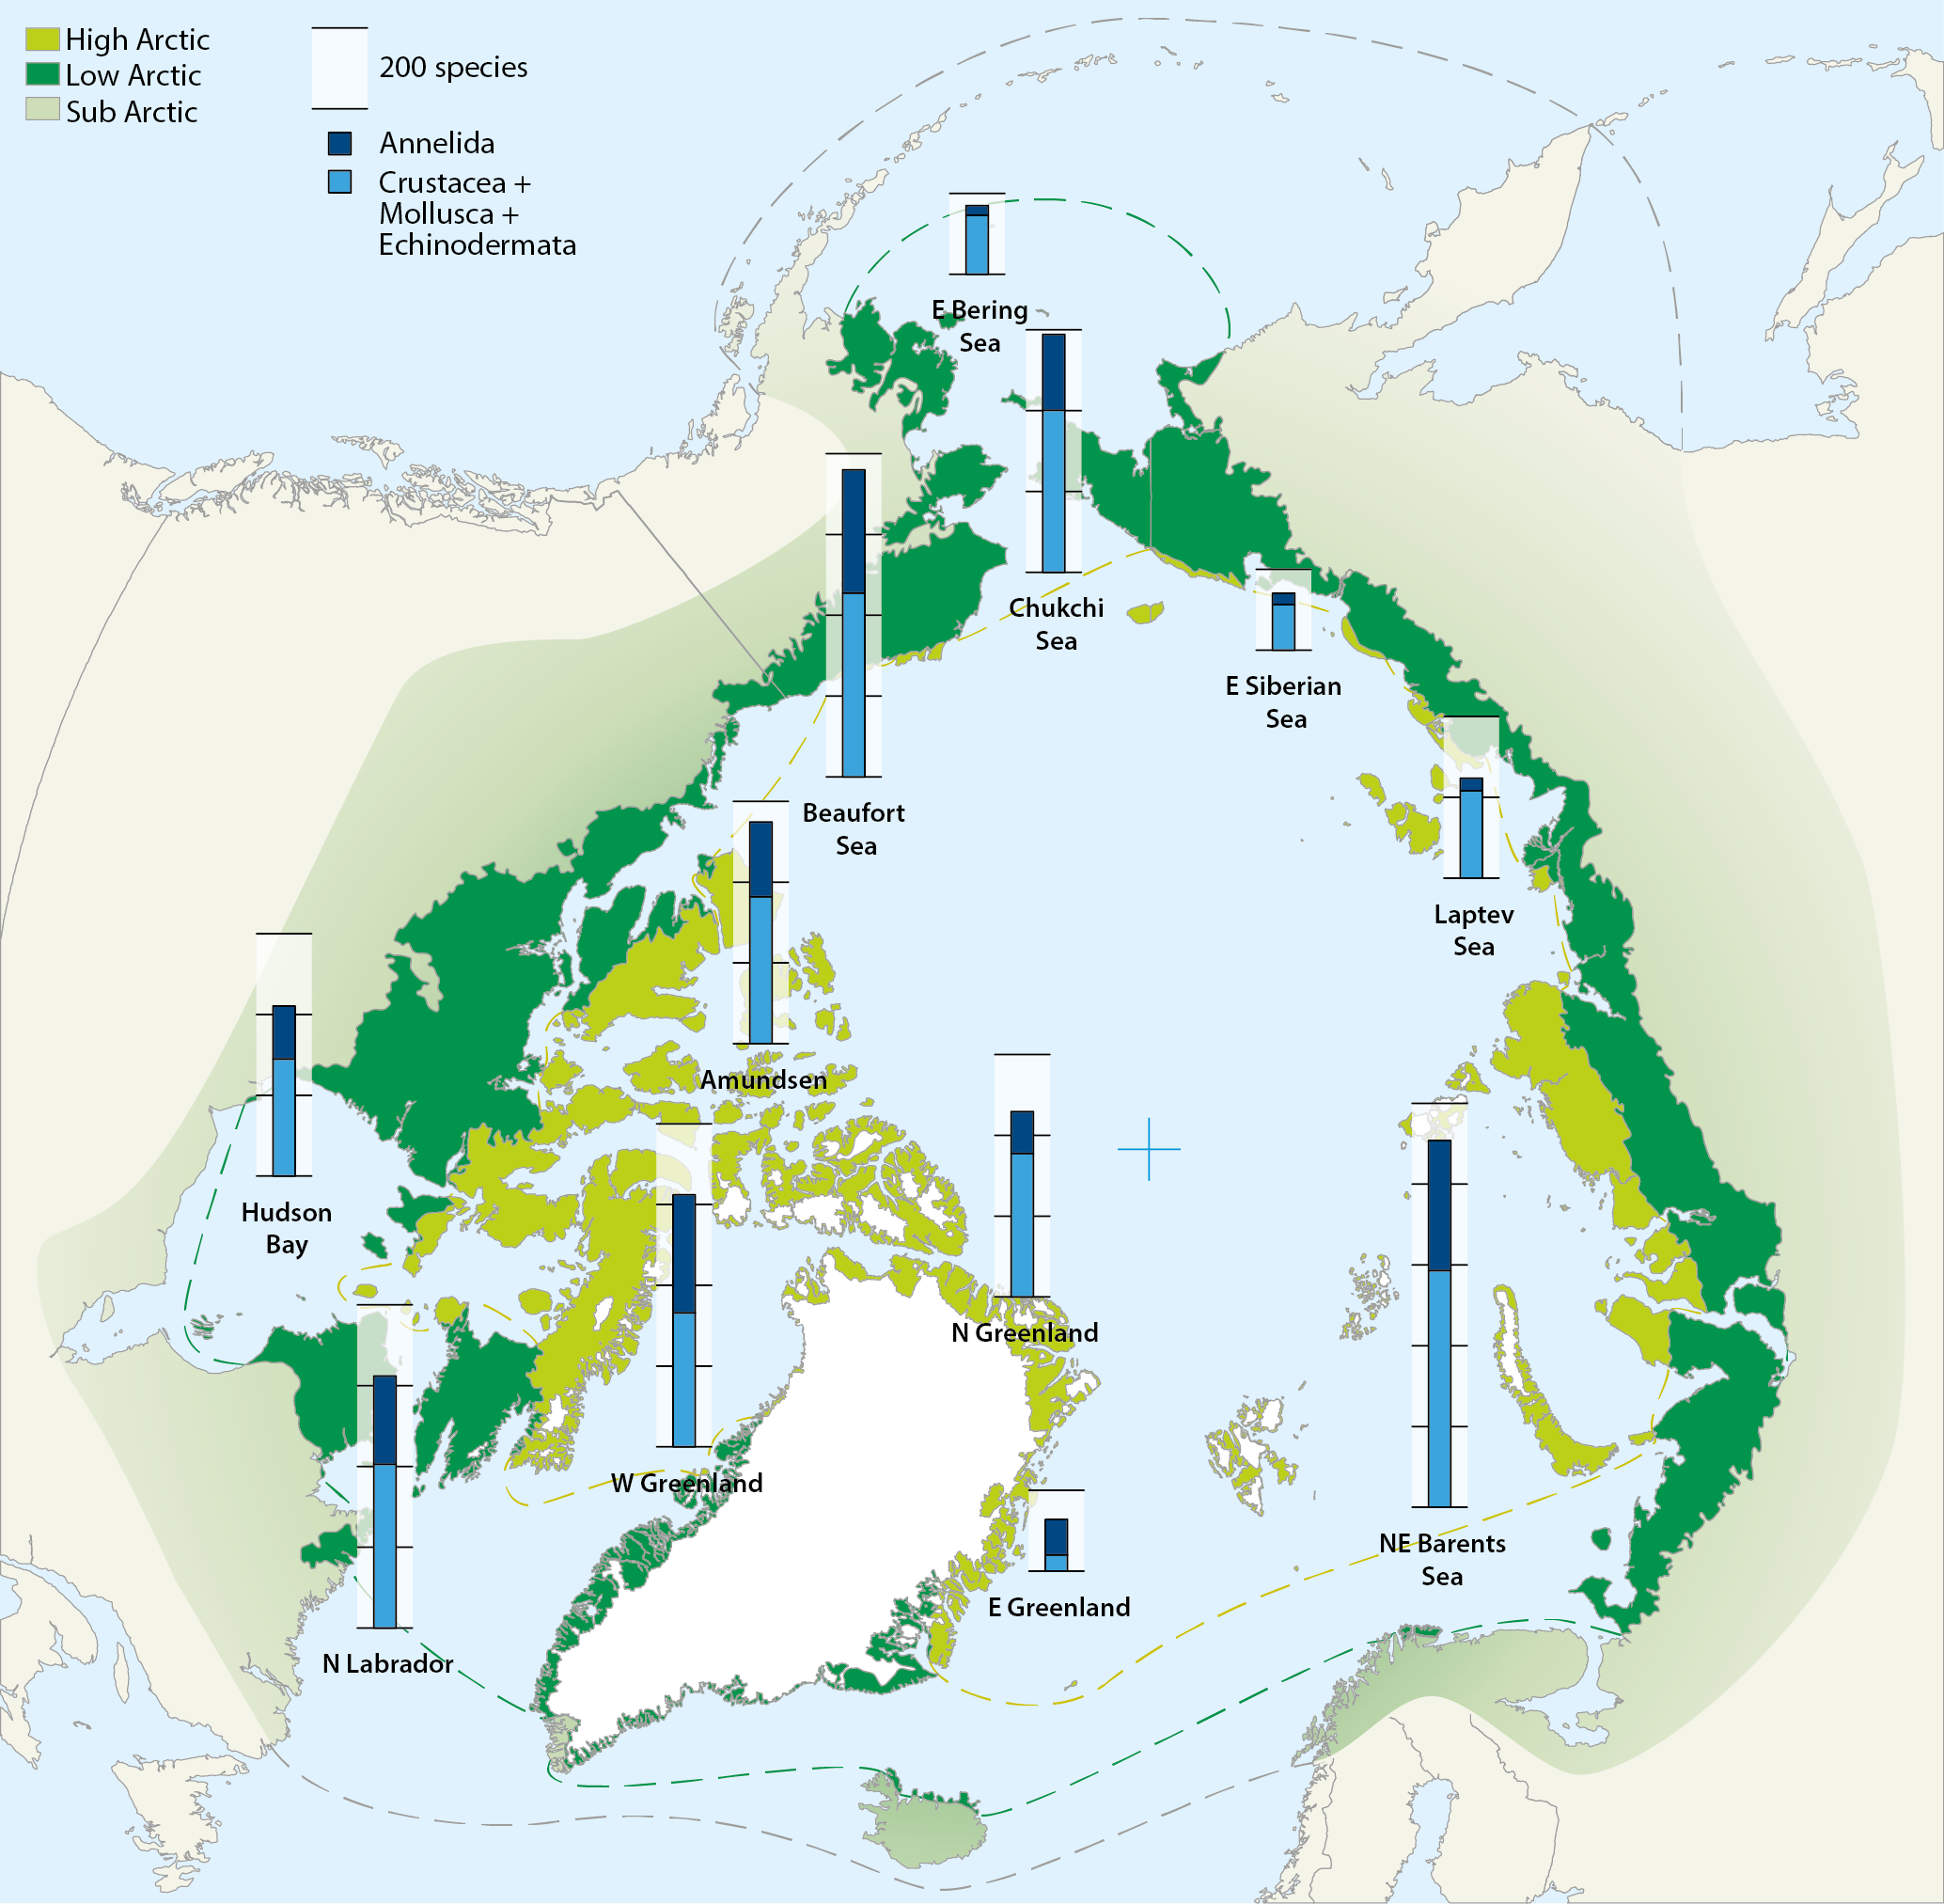
Map of the Arctic Ocean with superimposed stacked bars representing species numbers of macrozoobenthos from different shelf sea areas: Crustacea+Mollusca+Echinodermata (blue) and Annelida (black). Compiled by Piepenburg et al. (2011). Conservation of Arctic Flora and Fauna, CAFF 2013 - Akureyri . Arctic Biodiversity Assessment. Status and Trends in Arctic biodiversity. - Marine Invertebrates(Chapter 8) page 282
-
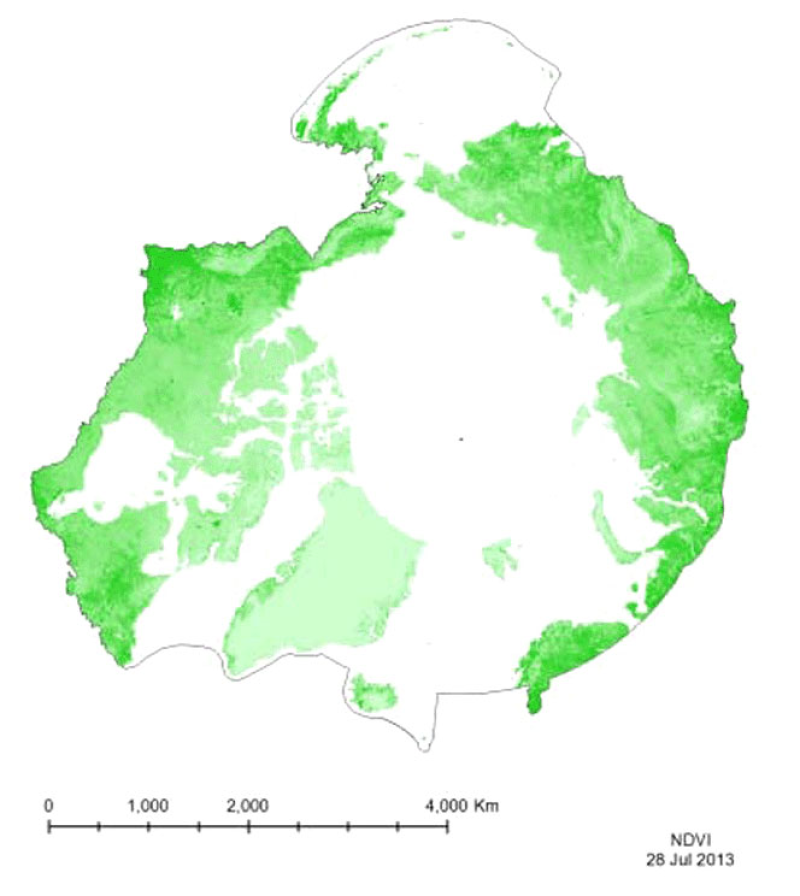
Vegetation indices quantify the concentrations of green leaf vegetation (chlorophyll)around the globe, in an attempt to monitor and correlate vegetation health and stress. The MODIS vegetation products include the Normalized Difference Vegetation Index (NDVI)and an Enhanced Vegetation Index (EVI). Included in the MOD13C1 product is both NDVIand EVI, so both have been provided for the CAFF Dedicated Pan-Arctic Satellite RemoteSensing Products and Distribution System. These indices come in a variety of resolutions,but MTRI has provided a monthly global composite on a 0.05° Climate Model GRID(CMG).
-
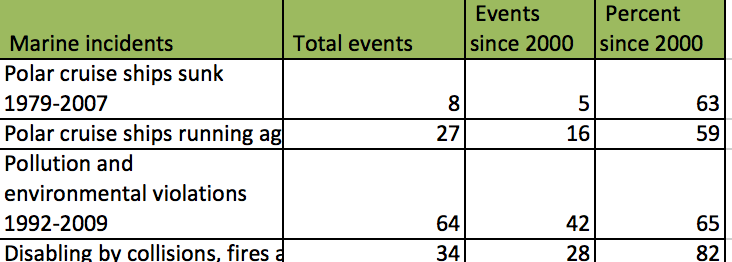
Arctic Biodiversity Assessment (ABA) 2013. Table 18.1. Marine incidents involving cruise ships in Arctic and Antarctic waters (the same vessels often alternate polar region according to season) (aggregated from reports from national coast guards, admiralty courts and insurers, and www.cruisejunkie.com).
-
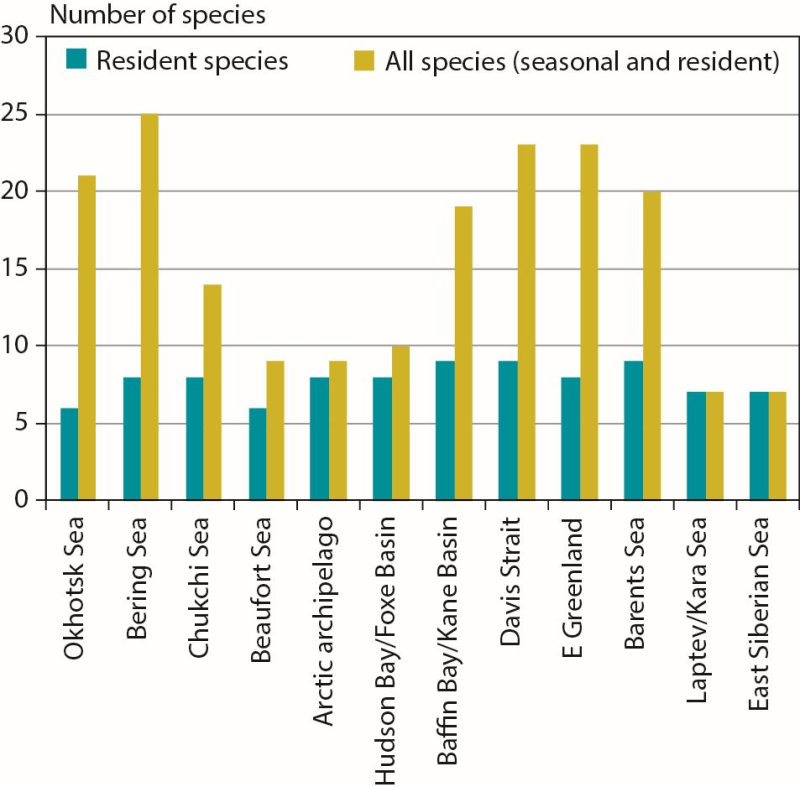
Number of marine mammal species in Arctic marine regions classified by resident species (n = 11 total) or all species (including seasonal visitors, n = 35 total). CAFF 2013. Arctic Biodiversity Assessment. Status and Trends in Arctic biodiversity. Conservation of Arctic Flora and Fauna, Akureyri - Mammal (Chapter 3) page 84
-
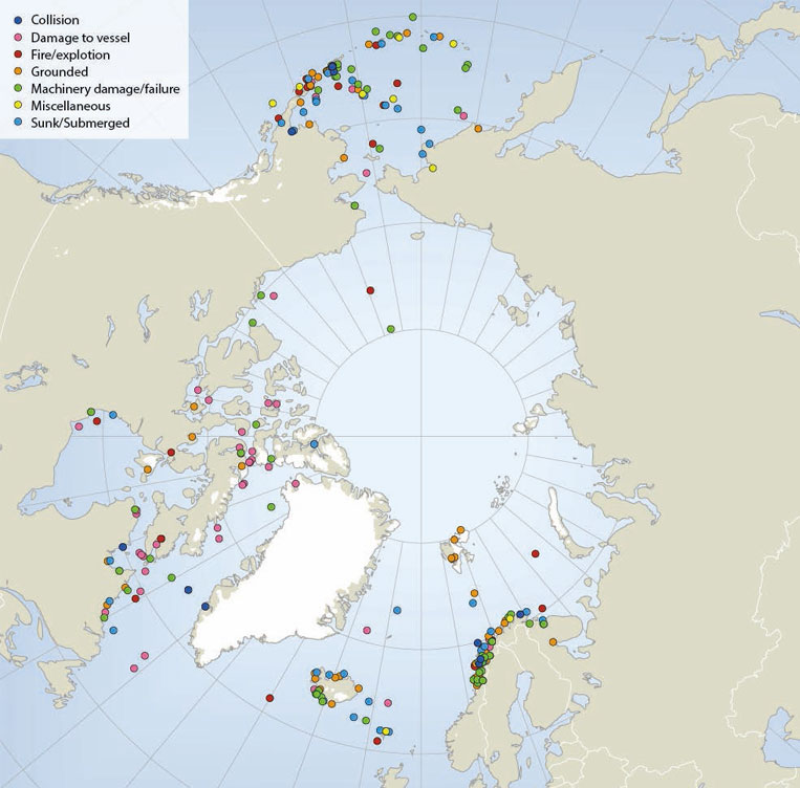
Locations of sub-Arctic and Arctic shipping accidents and incident causes, 1995-2004 (source: Arctic Marine Shipping Assessment 2009). Published in the Arctic Biodiversity Assessment (ABA) released in 2014.
-
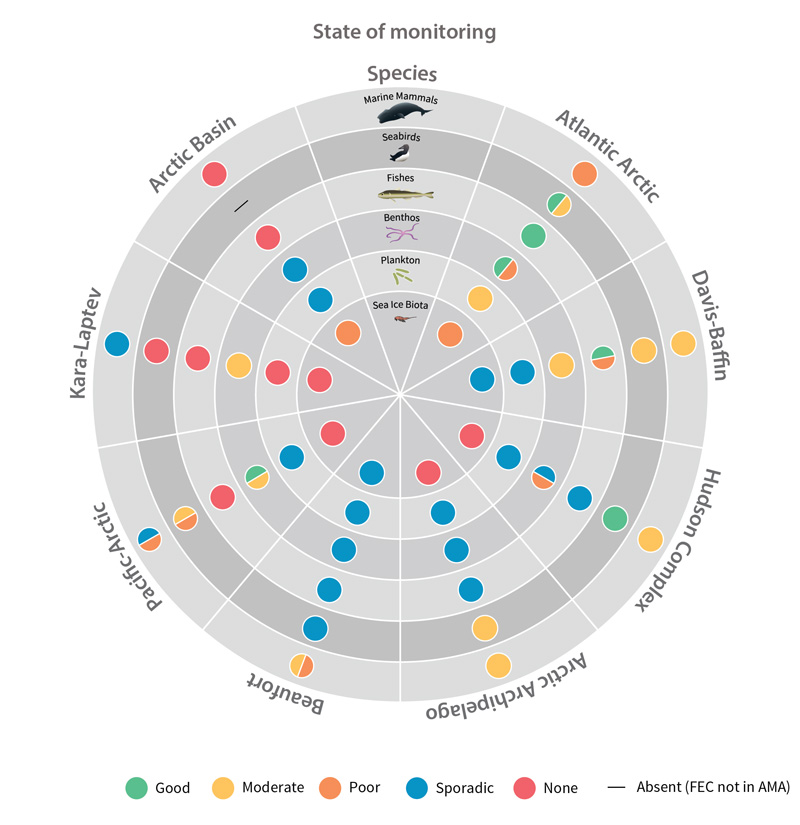
Status of monitoring activities for each Focal Ecosystem Component (i.e., selected species groups) across each Arctic Marine Area as included in this report. STATE OF THE ARCTIC MARINE BIODIVERSITY REPORT - <a href="https://arcticbiodiversity.is/monitoring-status-and-advice" target="_blank">Key Findings</a> - Page 5 - Figure 1