 CAFF - Arctic Biodiversity Data Service (ABDS)
Conservation of Arctic Flora and Fauna (CAFF)
Type of resources
Available actions
Topics
Keywords
Contact for the resource
Provided by
Years
Formats
Representation types
Update frequencies
status
Service types
Scale
-
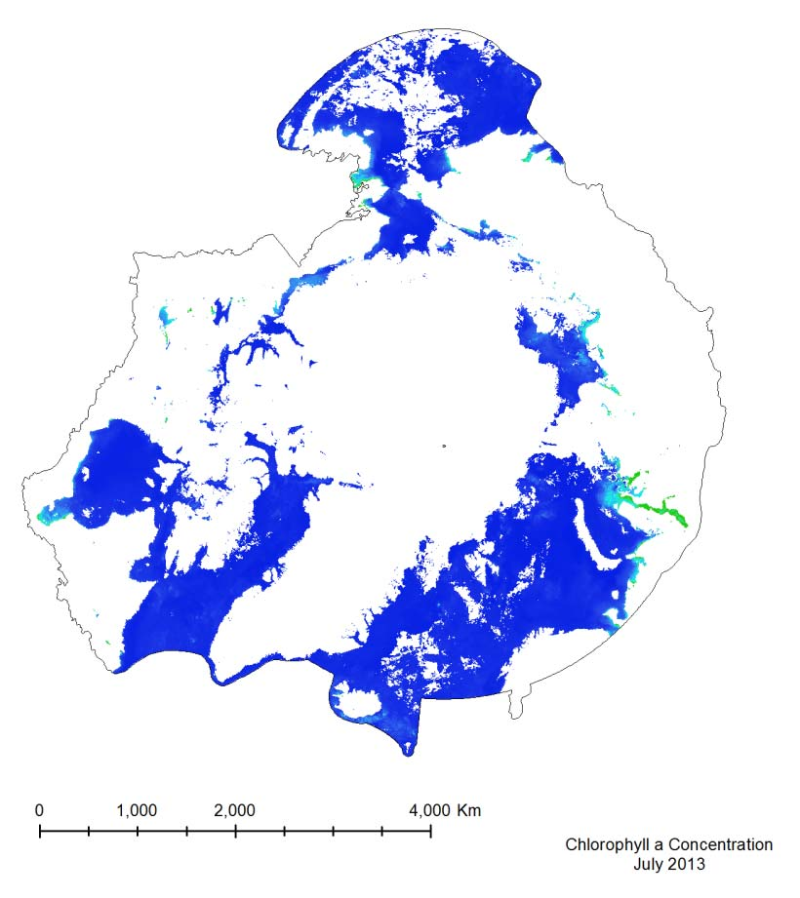
The MODIS marine chlorophyll a product provided, similar to SST, is a 4 km global monthly composite based on smaller resolution daily imagery compiled by NASA. The imagery is reliant on clear ocean (free of clouds and ice) so only months from March to October have been provided, as the chlorophyll levels in the Arctic diminish during the winter months, when sea ice is prevalent. The marine chlorophyll a is measured in mg/m3
-
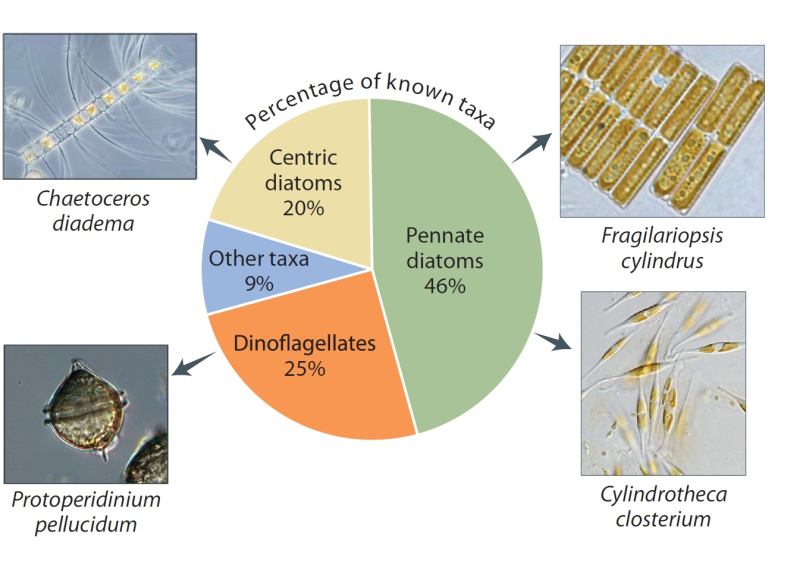
The number of species depends partly on what has been studied. Proportions vary somewhat around the Arctic, but diatoms and dinoflagellates are the most diverse groups everywhere. The greatest sampling effort has been in the Laptev Sea, Hudson Bay, and the Norwegian sector of the Barents Sea. Species shown are among the most commonly recorded. Published in the Life Linked to Ice released in 2013, page 26. Life Linked to Ice: A guide to sea-ice-associated biodiversity in this time of rapid change. CAFF Assessment Series No. 10. Conservation of Arctic Flora and Fauna, Iceland. ISBN: 978-9935-431-25-7.
-
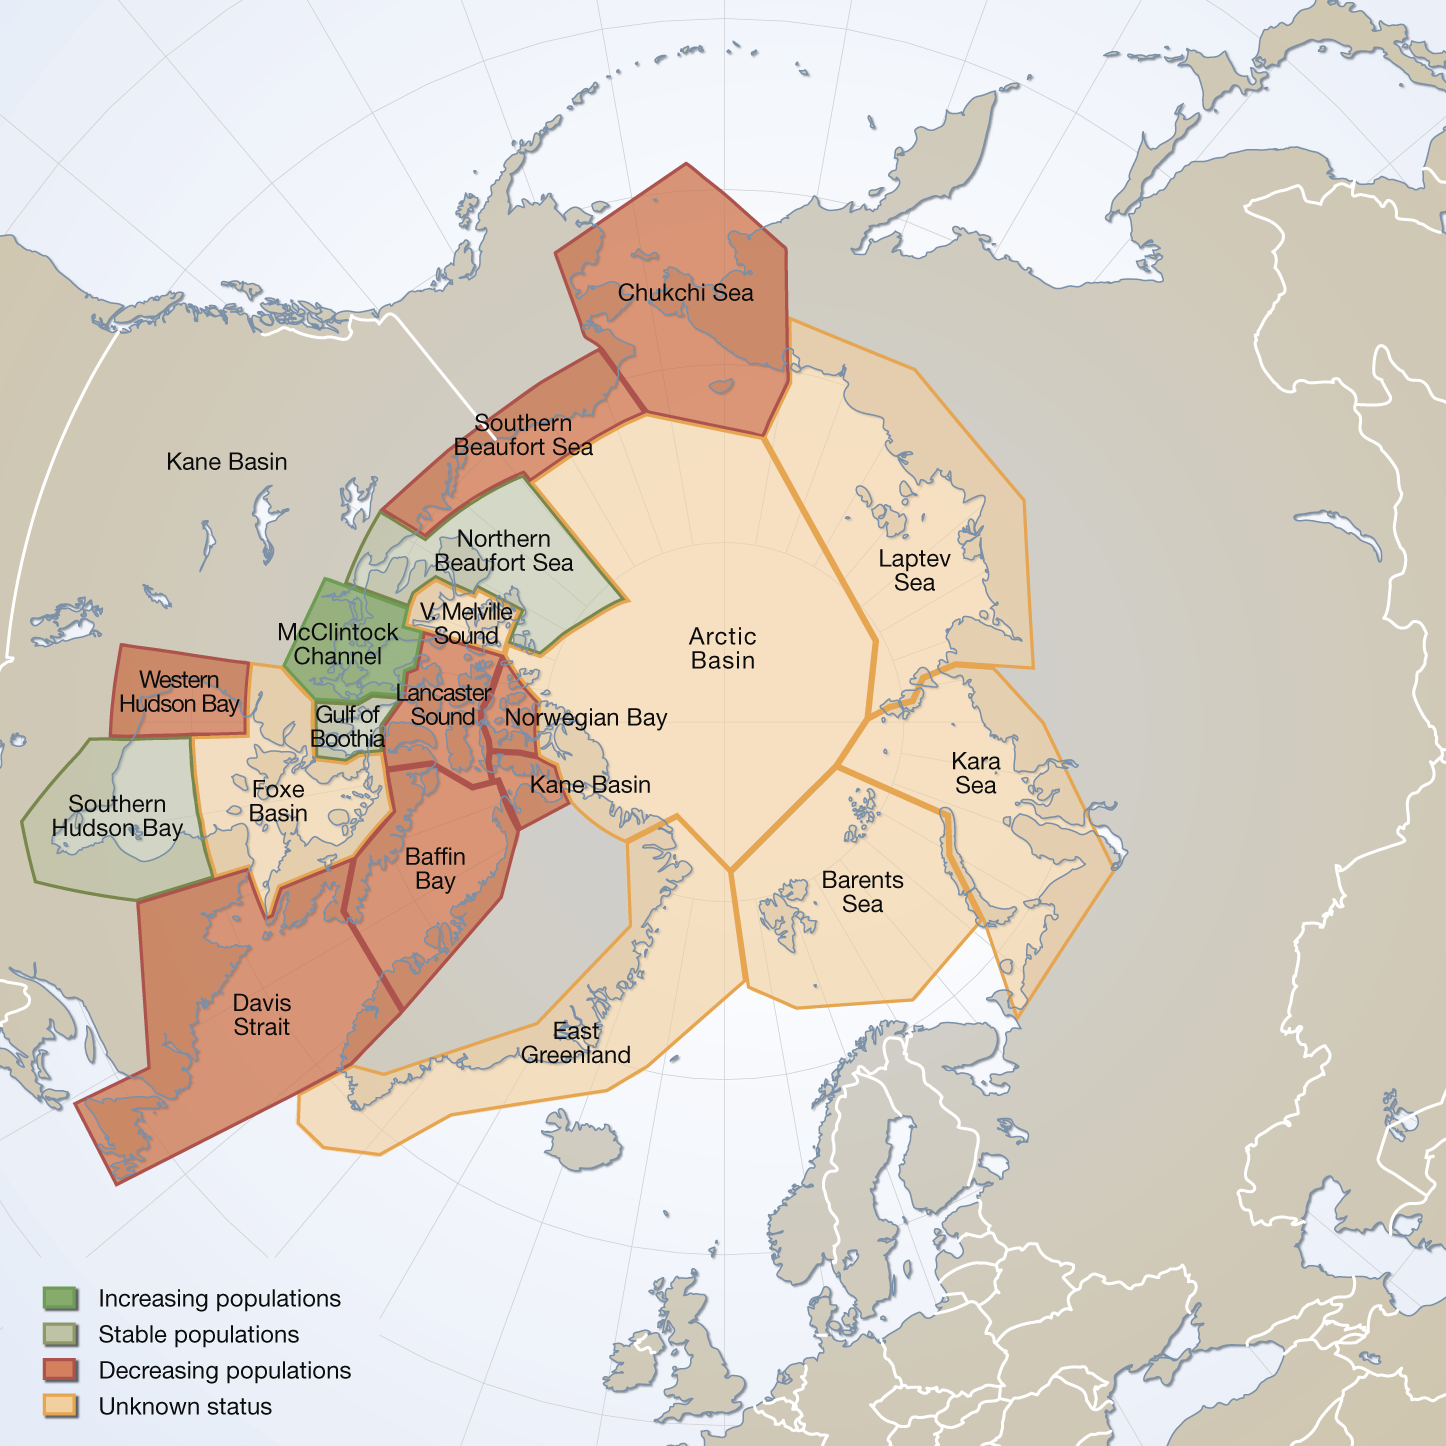
Circumpolar map of all polar bear subpopulation as recognized by the IUCN/Polar Bear Specialist Group in 2009 (PBSG 2010a). Total area covered = 24 mill. km(2). Vongraven, D and Peacock, E. Development of a pan-Arctic monitoring plan for polar bears:background paper. Published in the Arctic Biodiversity trends 2010, Indicator #01 - released in May 2010 Updated in feb.2025 with spatial data from 2022
-
The Land Cover Dynamics MODIS product is a yearly product that represents thetiming of vegetation phenology globally. Sub-datasets include vegetation growth, maturity,senescence, and dormancy. This product also includes the NBAR-(Nadir Bidirectionalreflectance distribution function (BRDF) adjusted Reflectance) based EVI, in part becausethe EVI is used to create the Land Cover Dynamics. The Land Cover Dynamics product uses both Terra and Aqua MODIS data. Version005 (provided) has a 500 m spatial resolution, which is an improvement from the 1,000 mversion 004 product. This product is only available in MODIS tiles, so the tiles needed tocover the CAFF pan-Arctic region has been downloaded but not clipped to the pan-Arcticextent at this time.
-
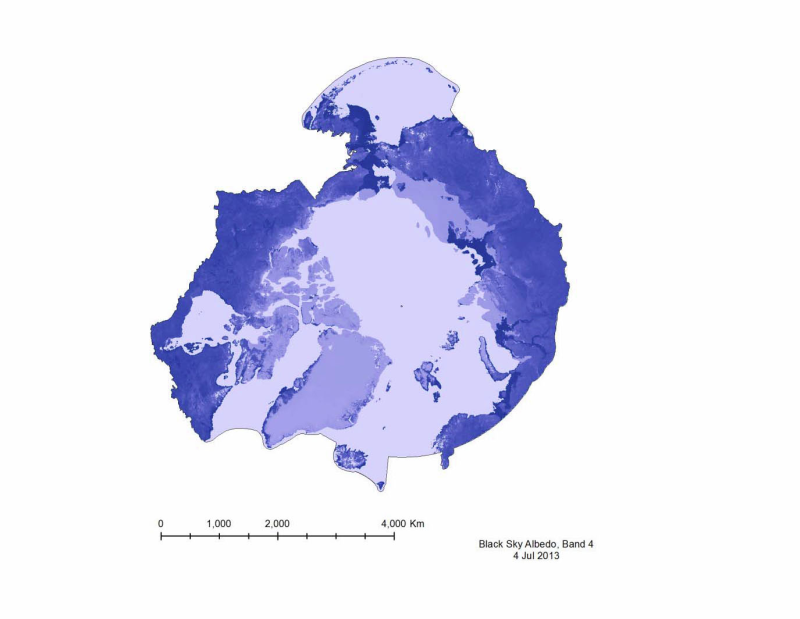
Albedo is a reflection coefficient that describes the reflecting power of a surface. Data compiled for CAFFs Land Cover Change Initiative with dataset for the firs of very month during 2001- 20112. - <a href="http://www.caff.is/indices-and-indicators/land-cover-change-index" target="_blank"> Land Cover Change Initiative (LCC)</a>
-
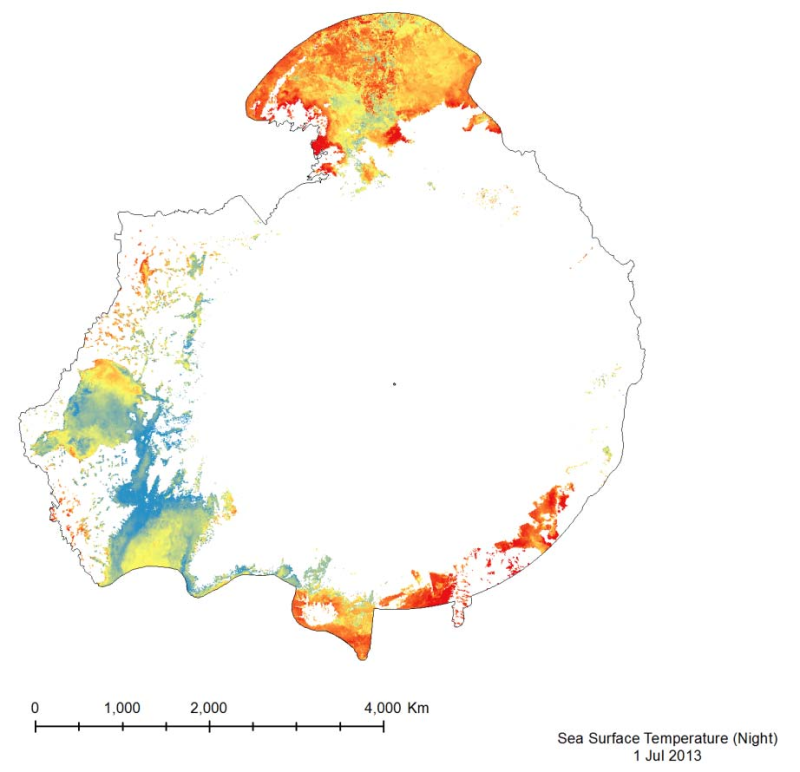
The MODIS Sea Surface Temperature (SST) product provided is a 4km spatialresolution monthly composite made from nighttime measurements from the Aqua Satellite.The nighttime measurements are used to collect a consistent temperature measurement that isunaffected by the warming of the top layer of water by the sun.
-
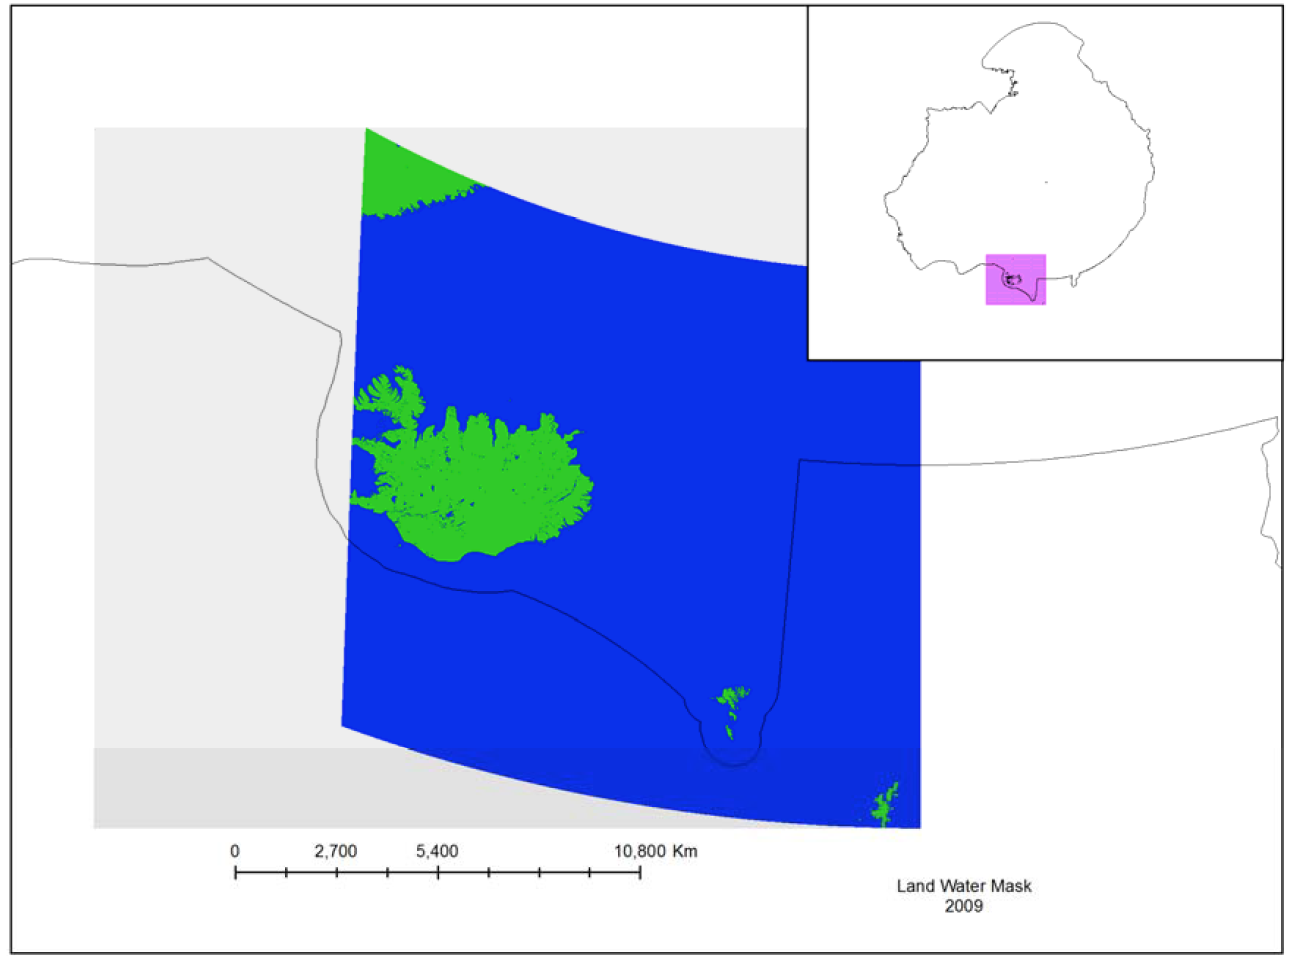
The MODIS Land Water Mask is created from MODIS 250 m imagery incombination with Shuttle Radar Topography Mission (SRTM) Water Body Data (SWBD) tocreate a global map of surface water at 250 m spatial resolution. Currently, only one mapexists, created in 2009 by Carroll et al. (2009). Because only one MODIS-based map exists,an analysis of surface water change is not possible at this time.
-
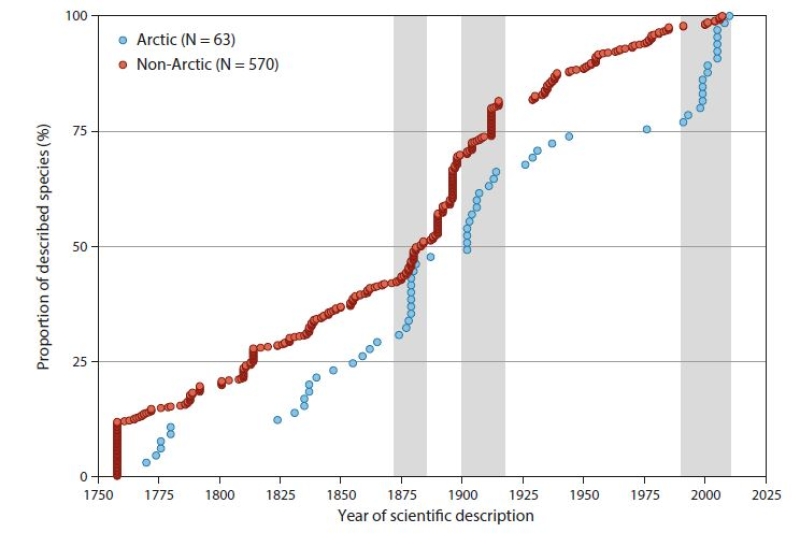
Cumulative numbers of marine fish diversity (n = 633, Appendix 6.2) in the Arctic Ocean and adjacent seas (AOAS) from 1758 to the present. Species are broadly grouped according to zoogeographic pattern (cf. Section 6.3.1): Arctic (A, blue symbols) and non-Arctic (Σ AB, B, WD, red symbols). Grey bars denote periods with many descriptions of new Arctic species. Note that 75% of the non-Arctic species known to science were described by 1912, whereas the same proportion for Arctic species was only reached in 1976. See text for further information. Conservation of Arctic Flora and Fauna, CAFF 2013 - Akureyri . Arctic Biodiversity Assessment. Status and Trends in Arctic biodiversity. - Fishes(Chapter 6) page 220
-
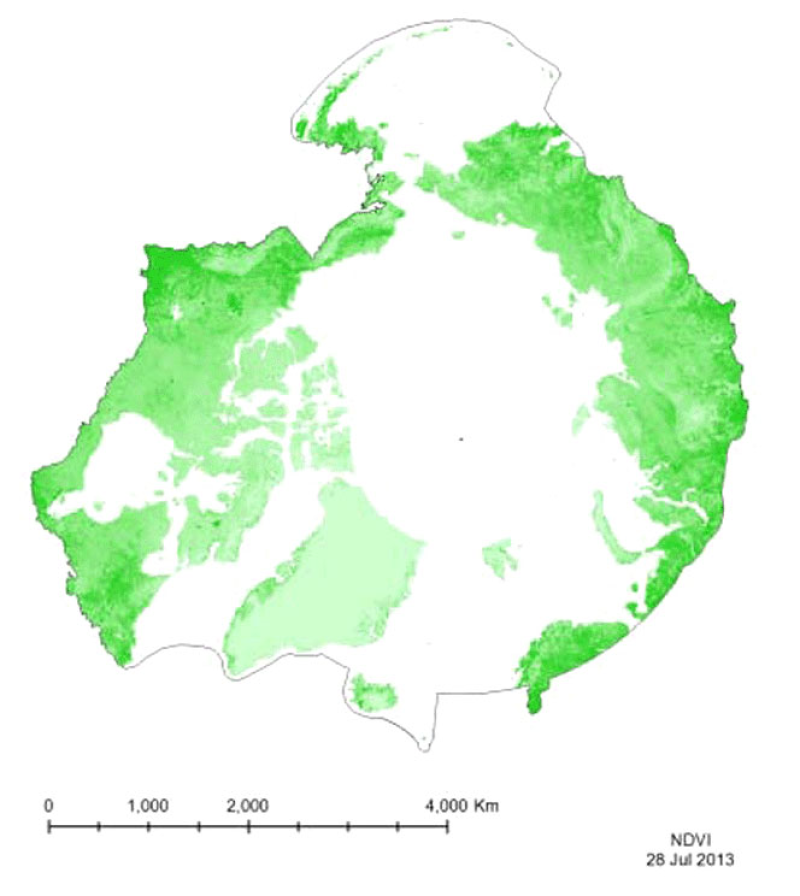
Vegetation indices quantify the concentrations of green leaf vegetation (chlorophyll)around the globe, in an attempt to monitor and correlate vegetation health and stress. The MODIS vegetation products include the Normalized Difference Vegetation Index (NDVI)and an Enhanced Vegetation Index (EVI). Included in the MOD13C1 product is both NDVIand EVI, so both have been provided for the CAFF Dedicated Pan-Arctic Satellite RemoteSensing Products and Distribution System. These indices come in a variety of resolutions,but MTRI has provided a monthly global composite on a 0.05° Climate Model GRID(CMG).
-
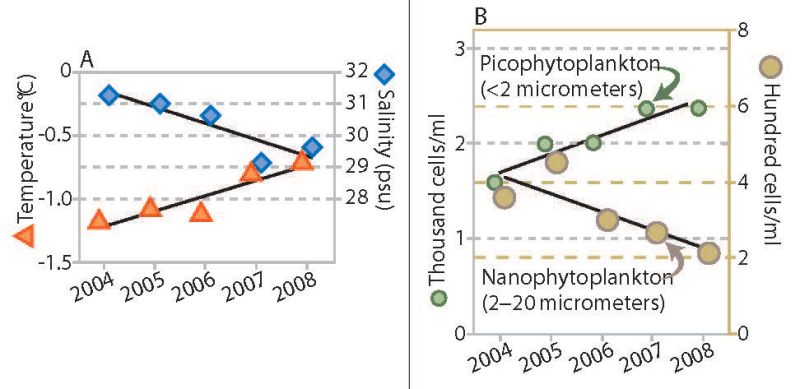
Trends in water temperature and salinity (A) and density of phytoplankton of two size ranges (B), Canada Basin, 2004 to 2008. Stratification of the water column increased throughout the Canada Basin over a recent five-year period, accompanied by a change in phytoplankton communities. The upper ocean layer showed trends of increased temperature and decreased salinity (Figure 18A), which combine to make this layer progressively less dense. The layer of water below this did not change in density over this period (not shown). The larger size class of phytoplankton (which would include diatoms) decreased in abundance, while the smaller types of plankton increased (Figure 18B). In addition to the trends shown, nutrient content in the upper ocean water layer decreased. Abundance of microbes (bacteria and similar organisms) that subsist on organic matter increased. Total phytoplankton biomass, however, remained unchanged. If this trend towards smaller species of phytoplankton and microbes is sustained, it may lead to reduced production of zooplankton, an impact that would be transmitted through the food web to birds, fish and mammals. Published in the Life Linked to Ice released in 2013, page 30. Life Linked to Ice: A guide to sea-ice-associated biodiversity in this time of rapid change. CAFF Assessment Series No. 10. Conservation of Arctic Flora and Fauna, Iceland. ISBN: 978-9935-431-25-7.